

Abstract
A flow cytometric method for analyzing suspension cell cultures for micronucleus content has been previously reported [Environ. Molec. Mutagen. 47 (2006) 56–66]. The experiments described herein were undertaken to evaluate the compatibility of this method (In Vitro MicroFlow®) with attachment cells. Initially, CHO-K1 cells were studied in nine independent experiments using mitomycin C and cyclophosphamide. The results demonstrated the effectiveness of the cell processing procedure, and also provided historical control data that were useful for setting criteria for making positive calls. Subsequently, CHO-K1 cells were treated with methyl methanesulfonate, mitomycin C, etoposide, vinblastine sulfate, dexamethasone, and sodium chloride. Whereas the four genotoxicants were each observed to increase micronucleus frequencies, the non-genotoxicants induced no such response up to cytotoxic concentrations. Following this initial work, inter-laboratory transferability was evaluated across three sites using a common cell staining and analysis protocol for CHO-K1 or V79 cells that had been treated with the ten chemicals listed in Annex 3 of the OECD Draft Proposal for a New Guideline 487: In Vitro Mammalian Cell Micronucleus Test. With the exception of benzo[a]pyrene at one site, each laboratory observed increased micronucleus frequencies for the genotoxicants, whereas no significant induction occurred with the non-genotoxicants. Interestingly, the method appeared to distinguish between genotoxic modes of action, as only aneugens increased the average micronucleus fluorescence intensity and the frequency of hypodiploid nuclei. Collectively, these data suggest that flow cytometry is capable of providing reliable micronucleus counts, and that additional information is obtained that appears to discern genotoxic modes of action.
Keywords: micronuclei, flow cytometry, genotoxicity, aneugen, clastogen
Introduction
We have previously reported modifications to a flow cytometry-based in vitro micronucleus scoring procedure that was originally developed by Nüsse and colleagues [Nüsse and Kramer, 1984; Schreiber et al., 1992; Wessels and Nüsse, 1995]. One important refinement includes the addition of fluorescent latex microspheres. By acquiring a flow cytometric nuclei to bead ratio (Flow-NBR) concurrently with micronucleus scoring, a useful index of cytotoxity is obtained —relative survival. The second substantial modification is incubation of cells with ethidium monoazide bromide (EMA) prior to digestion of cytoplasmic membranes and pan-DNA labeling with SYTOX Green. This sequential dye application results in differential staining of healthy cells’ chromatin (EMA-/SYTOX+) relative to necrotic and late-stage apoptotic cells’ EMA+/SYTOX+ profile. By excluding EMA+ chromatin from analysis, flow cytometric scoring of nuclei and micronuclei (MN) is accomplished with significantly reduced interference from the presence of dead/dying cells. Using this method, good agreement between microscopy- and flow cytometry-based scoring has been reported for mouse L5178Y and human TK6 cells [Avlasevich et al., 2006; Bryce et al., 2007]. Additionally, a demonstration of interlaboratory transferability was recently published [Bryce et al., 2008].
Whereas our previous work was performed with lymphoblastoid cells that grow as suspension cultures, other cell lines commonly employed for MN analysis grow with a fibroblast-like morphology and exhibit vigorous attachment to culture vessels. Thus, the work described herein with two hamster cell lines, CHO-K1 and V79 cells, was initiated to evaluate the compatibility of these prototypical attachment cell lines with the flow cytometric scoring process. Furthermore, use of these cell lines also provided an opportunity to determine whether immobilized cells would allow for simpler cell processing (i.e., no centrifugation steps).
Once cell processing steps were established, assay performance across several laboratories was evaluated by studying the list of chemicals in Annex 3 of the OECD Draft Proposal for a New Guideline 487 [3rd Draft, December 2007]. The data presented herein therefore provides a systematic assessment of the utility of a flow cytometry-based scoring method for two commonly used attachment cell lines.
Materials and Methods
Reagents
Test chemicals and dimethyl sulfoxide (DMSO) were purchased from Sigma-Aldrich (St. Louis, MO). NADP and isocitric acid were from Sigma-Aldrich, and Aroclor-induced rat liver S9 was from MolTox (Boone, NC). Reagents needed to stain and lyse cells for flow cytometric analysis were from In Vitro MicroFlow® Kits (Litron Laboratories, Rochester, NY). These materials included Buffer Solution, Nuclei Acid Dye A Solution (EMA dye), Nucleic Acid Dye B Solution (SYTOX Green dye), Lysis Solutions 1 and 2, and RNase Solution. Six micron fluorescent beads used to acquire Flow-NBR data were obtained from Invitrogen (Carlsbad, CA; cat. no. P14828).
Cells and culture medium
CHO-K1 cells were studied at Litron Laboratories and BioReliance, and were maintained at 37°C, 5% CO2 in a humid atmosphere. For routine culturing, the cells were maintained at or below approximately 80% confluency. The culture medium consisted of HAM F12 with sodium bicarbonate, penicillin, streptomycin, and 10% v/v heat-inactivated fetal bovine serum. The sources of HAM F12 were Mediatech, Inc (Manassas, VA) and Hyclone (Logan, UT). The suppliers of fetal bovine serum were Invitrogen and Hyclone.
V79 cells were studied at Abbott Laboratories, and were grown in culture medium at 37°C, 5% CO2, and in a humid atmosphere. For routine culturing, the cells were maintained at or below approximately 80% confluency. The culture medium consisted of Minimal Essential Eagle’s, with sodium pyruvate, L-glutamine, gentamycin, and 10% v/v heat-inactivated fetal bovine serum. The source of Minimal Essential Eagle’s, sodium pyruvate, and L-glutamine was Sigma-Aldrich. The supplier of fetal bovine serum and gentamycin was Invitrogen.
Treatments
Proof-of-principle experiments: Assay reproducibility
The following experiments were performed independently on nine separate occasions. One day prior to treatment, logarithmically growing CHO-K1 cells were trypsinized and adjusted to 1.2 × 10⁴/mL with culture medium. 1 mL per well was then plated across 24 well plates. The following day, cells were exposed to solvent alone, 0.025 μg/mL mitomycin C (MMC), or 5.0 μg/mL cyclophosphamide (CP). Both chemicals were prepared as 100x stock solutions in dimethyl sulfoxide (DMSO). MMC treatments occurred for approximately 44 hrs of continuous exposure, at which time flow cytometric scoring was performed as described below. In the case of CP, treatment occurred for 4 hrs in the presence of Aroclor 1254-induced rat liver S9 activation. The metabolic activation system was added from a 10x stock solution that was prepared in growth medium and provided final concentrations of 3% S9, 1.4 mg NADP/mL, and 5.95 mg isocitric acid/mL. After the treatment period, culture medium was aspirated and replacement with 1 mL fresh growth medium. After an additional 40 hrs of culture at 37°C, the cells were processed for flow cytometric analysis as described below.
Proof-of-principle experiments: Internal evaluations
One day prior to treatment, logarithmically growing CHO-K1 cells were trypsinized, adjusted to 1.2 × 10⁴/mL with culture medium, and then 1 mL aliquots were plated across 24 well plates. The following day, duplicate wells were exposed to solvent and at least five concentrations of test article. In the continuous exposure design cells were treated for approximately 44 hrs with methanesulfonate (MMS), etoposide (ETOPO), mitomycin C (MMC), vinblastine sulfate (VB), dexamethasone (DEX), and sodium chloride (NaCl). Whereas NaCl was dissolved in growth medium, the other five chemicals were prepared as 100x stock solutions in DMSO. After approximately 44 hrs of treatment, cells were processed for flow cytometric scoring as described below. Those compounds that were judged to be negative in the continuous exposure design were subsequently studied in a short-term treatment protocol in the presence of Aroclor 1254-induced rat liver S9. The metabolic activation system was added from a 10x stock solution as described above. After a 4 hr treatment period, culture medium was aspirated and replaced with 1 mL fresh growth medium. After an additional 40 hrs of culture at 37°C, the cells were processed for flow cytometric analysis as described below.
Inter-laboratory studies
CHO-K1 or V79 cells were trypsinized and adjusted with growth medium to 1.2 × 10⁴/mL or 2.0 ×10⁴/mL, respectively. 1 mL aliquots were then plated across 24 well plates. The following day, duplicate wells were exposed to solvent and at least five concentrations of each test article. The ten test articles are those listed in Annex 3 of the OECD Draft Proposal for a New Guideline 487. Information about these chemicals as well as choice of solvents appears in Table I. In the continuous exposure design, cells were treated for approximately 24 – 30 hrs, and were then processed for flow cytometric scoring as described below. Short-term treatments (4 hrs for CHO-K1 cells, 3 hrs for V79 cells) were also studied in the presence of the S9 metabolic activation system described above. After the treatment period, culture medium was aspirated and replaced with 1 mL fresh growth medium. After an additional 23 – 27 hrs of culture at 37°C, the cells were processed for flow cytometric analysis as described below. Concurrent positive controls were used at each laboratory: mitomycin C for continuous treatment without S9, and cyclophosphamide for short-term treatment with S9 activation. (Note that the shorter treatment/harvest time used here, relative to the proof-of-principle work described above, was set according to more recent guidance. That is, whereas the 1st Draft of OECD No. 487 suggested 2.0 – 2.5 doubling times, the 3rd Draft advised 1.5 to 2.0.)
Table I.
OECD Chemicals, Information
| Chemical | Cas. No. | Solvent, stock (Litron) | Solvent, stock (Abbott) | Solvent, stock (BioReliance) | Top Conc. Limited by |
|---|---|---|---|---|---|
| Cytosine arabinoside | 147-94-4 | DMSO, 100x | DMSO, 100x | water, 100x | Cytotox |
| Mitomycin C | 50-07-7 | DMSO, 100x | water, 100x | water, 100x | Cytotox |
| Cyclophosphamide | 50-18-0 | DMSO, 100x | water, 100x | water, 100x | Cytotox |
| Vinblastine Sulfate | 143-67-9 | DMSO, 100x | DMSO, 100x | water, 100x | Cytotox |
| Sodium Chloride | 7647-14-5 | GM, 10x | water, 100x | water, 100x | 10 mM |
| Nalidixic Acid | 389-08-2 | DMSO, 100x | DMSO, 100x | water, 100x | Cytotox |
| Colchicine | 64-86-8 | DMSO, 100x | water, 100x | 0.9% saline, 100x | Cytotox |
| Di(2-ethylhexyl)phthalate | 117-81-7 | GM, 10x | DMSO, 100x | ethanol, 100x | Solubility |
| Benzo(a)pyrene | 50-32-8 | DMSO, 100x | DMSO, 100x | DMSO, 100x | Cytotox |
| Pyrene | 129-00-0 | DMSO, 100x | DMSO, 100x | DMSO, 100x | Solubility |
Abbreviations: DMSO = dimethyl sulfoxide; GM = Growth medium; Cytotox = cytotoxicity, relative survival < 40%
Flow cytometric scoring of micronuclei
Cell staining
At time of cell harvest, growth medium was aspirated and plates were placed on a bed of wet ice for 20 minutes. 300 μL of Nucleic Acid Dye A Solution were then added to each well. The plates were maintained on ice for an additional 30 minutes during which time EMA was photoactivated with a fluorescent light that was positioned approximately 15 cm above the specimens. After the photoactivation period, plates were removed from ice, and 1 mL of cold Buffer Solution was added to each well. The buffer was aspirated, and 500 μL of Lysis Solution 1 were added to each well and plates were incubated at 37°C for 1 hr. Next, 500 μL of Lysis Solution II were added to each well, and the specimens were protected from light and allowed to equilibrate to room temperature for at least 30 minutes before flow cytometric analysis. Note that Lysis Solution 2 contained approximately 1 drop of 6 μm counting beads per mL.
Instrumentation and gating
Samples were analyzed with either BD Biosciences FACSCalibur or BD Biosciences FACSCanto II flow cytometers. Data acquisition and analysis were accomplished with CellQuest Pro, v5.2, or FACSDiva, v6.1.2. Strategies for acquiring flow cytometric data, including configuration of regions and gating logic, were performed as described in the In Vitro MicroFlow Kit manual, as well as Avlasevich et al. [2006] and Bryce et al. [2007, 2008]. Briefly, SYTOX-associated fluorescence emission was collected in the FL1 (FITC) channel, and EMA-associated fluorescence was collected in the FL3 (PerCP) channel. Events were triggered on SYTOX-associated fluorescence.
Data analysis
The following values were determined based on the acquisition of at least 10,000 EMA-negative/SYTOX-positive (“gated”) nuclei: %MN, %relative survival, and %hypodiploid nuclei. The manner of performing these calculations has been described previously [Bryce et al., 2007, 2008]. The top analyzable concentration of a test substance was defined as the highest concentration that resulted in approximately 50% reduction to relative survival (without exceeding 60% reduction). For the inter-laboratory study, the same cytotoxicity limit was used. The laboratories handled the case of non-cytotoxic agents slightly differently. In these cases, the top concentration was the highest non-precipitating concentration or else the limit concentration (5 mg/mL or 10 mM at Litron; 5 mg/mL or 10 mM at BioReliance, except NaCl which was tested up to 40 mM; and 0.5 mg/mL at Abbott), whichever was lower.
Relative survival, %MN, fold-increases, and all other calculations were performed with Excel (Microsoft, Seattle, WA). Nine independent MMC and CP experiments provided historical −S9 and +S9 data that were helpful in establishing the variability in negative and positive control MN frequencies. Based on these data, we judged subsequent internal and inter-laboratory experiments to be valid if: i) there were at least three analyzable concentrations, ii) the mean %MN value for the concurrent vehicle control wells was within 1.5 standard deviations of the historical negative control’s mean value, and iii) the concurrent positive control mean %MN value was ≥3-fold over the concurrent mean solvent control value. For test compounds a positive result was defined as any one passing (i.e., not overly cytotoxic) concentration resulting in ≥3-fold increase in mean %MN relative to the concurrent vehicle control mean value.
Results
Initial considerations of compatibility
The procedures for flow cytometric scoring of MN in cells grown in suspension culture were found to be transferable to the attachment cell line CHO-K1. Although the cells were firmly affixed to the growth vessel at the time of harvest, the sequential addition of dyes and lysis solutions provided suspensions of nuclei and micronuclei that were compatible with flow cytometric analysis (see Figure 1). An advantage of CHO-K1 cells relative to suspension cultures was streamlined cell processing. That is, the solid support matrix afforded the elimination of centrifugation steps. Rather, test article, cell debris, and unbound EMA dye were effectively removed through simple aspiration.
Figure 1.

Bivariate graphs illustrate representative Forward Scatter vs. Green Fluorescence profiles of gated (EMA-negative) events resulting from CHO-K1 cells that have been processed for the micronucleus scoring application. Panels A–C: increasing concentrations of mitomycin C; note the increased incidence of micronuclei. Panels D–F: increasing concentrations of vinblastine; note the increased incidence of micronuclei; also note the following two aneugenic signatures, a shift in green fluorescence intensity for induced micronuclei, and a robust induction of hypodiploid nuclei.
Reproducibility
Results from nine independent repeat experiments with MMC and CP are shown in Figure 2. The vehicle control-associated %MN values were relatively consistent across analyses, and similar average frequencies were observed in the continuous exposure versus the metabolic activation arm (mean ± SD = 1.65 ± 0.49% versus 1.57 ± 0.84%, respectively). In each of the 18 trials, exposure to genotoxicants resulted in ≥3-fold increases in mean MN frequency. MMC-induced MN frequencies averaged 5.2-fold over concurrent control, while CP treatment resulted in a mean increase of 9.9-fold. These levels of MN induction were achieved at moderate but not overly cytotoxic conditions: mean relative survival for MMC- and CP-treated cultures were 51% and 78%, respectively.
Figure 2.
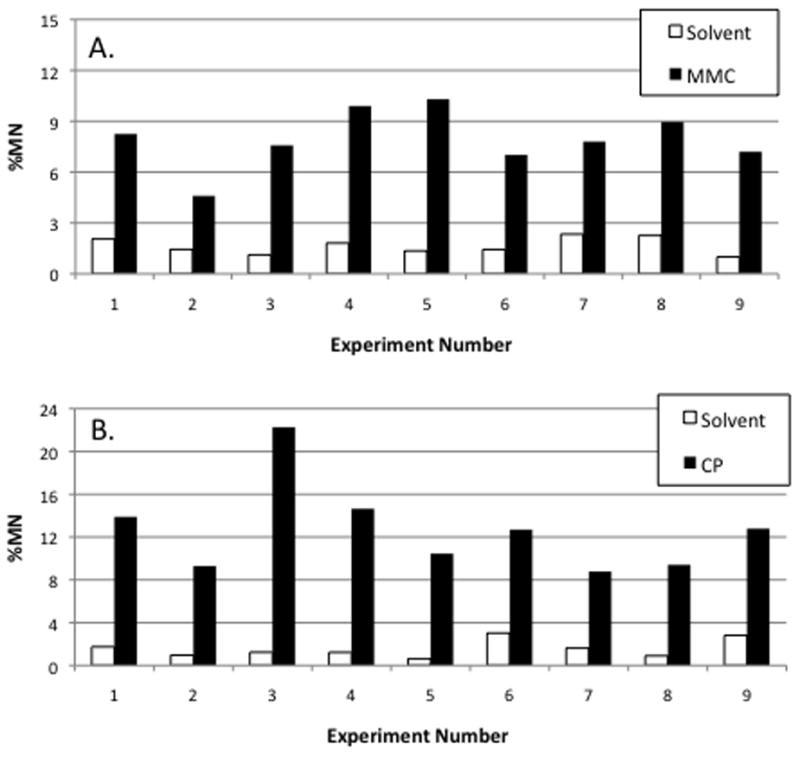
Average frequency of micronuclei are graphed for each of nine independent experiments. Panel A: mitomycin C (0.025 μg/mL, continuous exposure). Panel B: cyclophosphamide (5 μg/mL, with S9 activation, 4 hrs of exposure).
Performance
As described in Table II, each of the four genotoxicants was observed to significantly induce MN in the continuous exposure arm. In each of these cases, the top concentration was limited by cytotoxicity, yet robust MN responses were evident. At similar relative survival values, MN induction exhibited the following rank order: MMS > MMC > ETOPO > VB. Interestingly, unlike MMS, MMC and ETOPO, treatment of cells with the aneugen VB was associated with two qualitative differences to the Forward Scatter vs. SYTOX-Green fluorescence plots. Specifically, as illustrated in Figure 1, large numbers of nuclei with a hypodiploid DNA content became evident, and the average SYTOX Green fluorescence intensity of MN events appeared to increase (presumably a result of the greater DNA content associated with whole chromosome-containing MN as compared to fragments resulting from double-strand breaks).
Table II.
Micronucleus and Relative Survival Data
| Continuous Treatment | Short Term with Metabolic Activation | |||||
|---|---|---|---|---|---|---|
| Chemical | Top Passing Conc. (μg/mL) | Max. MN Fold Incr. | %Relative Survival | Top Passing Conc. (μg/mL) | Max. MN Fold Incr. | %Relative Survival |
| Vinblastine sulfate | 0.003 | 6.5 | 42.5 | |||
| Etoposide | 0.25 | 9.3 | 47.8 | |||
| Mitomycin C | 0.1 | 11.1 | 40.7 | |||
| Methyl methanesulfonate | 12.5 | 13 | 46.3 | |||
| Dexamethasone | 125 | 1.1 | 42.8 | 125 | 1.5 | 42.7 |
| Sodium chloride | 5000 | 2.5 | 60.3 | 5000 | 1.4 | 43.5 |
Continuous treatment with DEX and NaCl did not significantly increase %MN. These negative findings were followed by exposures that occurred in the presence of a metabolic activation system. Again, no significant MN induction was evident.
Transferability
The OECD Annex 3 list of ten compounds was used to test the portability of the method. The chemicals and treatment scenarios, together with resulting data, are presented in Tables III. a – c. Despite different treatment protocols, treatment conditions and/or cell lines utilized across three laboratories, flow cytometric data yielded expected results. Each laboratory observed that the four non-genotoxic compounds lacked appreciable MN-induction, both in direct-acting and metabolic activation arms. Among the six genotoxic agents studied, cyclophosphamide and each of the three direct-acting clastogens were found to induce MN. At one site, (Table III. a,), benzo(a)pyrene caused a 2.1-fold increase in MN, but according to the present cut-off value, this was considered a negative result.
Table III.
| Table III. a. Inter-laboratory data: Litron | ||||||||
|---|---|---|---|---|---|---|---|---|
| Continuous Treatment | Short Term, with Metabolic Activation | |||||||
| Chemical | Top Passing Conc. (μg/mL) | MN Fold Incr. | %Relative Suvival | Aneugenic Signature? | Top Passing Conc. (μg/mL) | MN Fold Incr. | %Relative Suvival | Aneugenic Signature? |
| Mitomycin C | 0.2 | 4.7 | 57 | N | ||||
| Ara C | 0.4 | 4.1 | 64 | N | ||||
| Vinblastine sulfate | 0.01 | 10.5 | 51 | Y | ||||
| Colchicine | 0.04 | 6.5 | 59 | Y | ||||
| Nalidixic acid | 50 | 1.7 | 100 | N | 50 | 1.2 | 84 | N |
| Pyrene | 50 | 0.6 | 100 | N | 50 | 0.8 | 79 | N |
| NaCl | 584 | 1.2 | 100 | N | 584 | 1 | 77 | N |
| DEHP | 976 | 1.3 | 47 | N | 976 | 1.1 | 100 | N |
| Cyclophosphamide | 5.44 | 5.4 | 51 | N | ||||
| Benzo(a)pyrene | 25 | 2.1 | 53 | N | ||||
| Table III. b. Inter-laboratory data: BioReliance | ||||||||
| Continuous Treatment | Short Term, with Metabolic Activation | |||||||
| Chemical | Top Passing Conc. (μg/mL) | MN Fold Incr. | %Relative Suvival | Aneugenic Signature? | Top Passing Conc. (μg/mL) | MN Fold Incr. | %Relative Suvival | Aneugenic Signature? |
| Mitomycin C | 0.2 | 5.7 | 59 | N | ||||
| Ara C | 0.1 | 4.8 | 57 | N | ||||
| Vinblastine sulfate | 0.04 | 3.7 | 81 | Y | ||||
| Colchicine | 0.12 | 3.7 | 41 | Y | ||||
| Nalidixic acid | 100 | 1.0 | 88 | N | 100 | 1.1 | 89 | N |
| Pyrene | 47 | 0.9 | 91 | N | 23 | 1.1 | 44 | N |
| NaCl | 2500 | 1.0 | 100 | N | 2500 | 1.0 | 84 | N |
| DEHP | 0.078 mM | 0.7 | 49 | N | 0.078 mM | 1.2 | 66 | N |
| Cyclophosphamide | 40 | 7.0 | 60 | N | ||||
| Benzo(a)pyrene | 25 | 3.4 | 100 | N | ||||
| Table III. c. Inter-laboratory data: Abbott | ||||||||
| Short Term, without Metabolic Activation | Short Term, with Metabolic Activation | |||||||
| Chemical | Top Passing Conc. (μg/mL) | MN Fold Incr. | %Relative Suvival | Aneugenic Signature? | Top Passing Conc. (μg/mL) | MN Fold Incr. | %Relative Suvival | Aneugenic Signature? |
| Mitomycin C | 0.75 | 44.9 | 54 | N | ||||
| Ara C | 1.5 | 4.4 | 46 | N | ||||
| Vinblastine sulfate | 1 | 15.7 | 50 | Y | ||||
| Colchicine | 1 | 17.0 | 42 | Y | ||||
| Nalidixic acid | 500 | 0.7 | 90 | N | 500 | 0.8 | 96 | N |
| Pyrene | 30 | 1.4 | 64 | N | 30 | 0.6 | 82 | N |
| NaCl | 500 | 0.7 | 97 | N | 500 | 1.5 | 100 | N |
| DEHP | 500 | 1.0 | 91 | N | 500 | 0.8 | 100 | N |
| Cyclophosphamide | 10 | 30.6 | 45 | N | ||||
| Benzo(a)pyrene | 50 | 3.9 | 100 | N | ||||
Beyond causing robust increases in MN frequency, the aneugens vinblastine sulfate and colchicine, but not the clastogens, were also observed to cause a shift in median MN size (fluorescence intensity), and to increase the prevalence of hypodiploid nuclei. These observations appear in Table III under the heading aneugenic signature.
Discussion
These studies were undertaken to evaluate the compatibility of the In Vitro MicroFlow method with attachment cell lines. Beyond finding that the method is indeed compatible with attachment cells, several additional beneficial characteristics were noted. First, the ease by which cells are processed is enhanced. That is, the EMA-staining and the subsequent lysis and SYTOX-Green staining procedures can be applied directly to cells while they are still firmly attached to a growth vessel. Therefore, the several centrifugation steps required for suspension cells are eliminated, replaced by simple and rapid aspiration. This substantially improves assay efficiency. A second interesting benefit of studying certain attachment cell lines, at least CHO-K1 and V79, is that two responses are apparent in the case of aneugens as compared to clastogens.
One of the aneugen responses is a shift in median fluorescence intensity for MN events. (Note that this signature has now been observed for an additional nine aneugens when using CHO-K1 cells; manuscript in preparation.) This signature is likely related to the whole chromosome nature of aneugen-induced MN. It is interesting that this shift was not evident in previous work with L5178Y or TK6 cells [Avlasevich et al., 2006; Bryce et al., 2007, 2008]. We attribute this to the larger average size of hamster chromosomes as compared to mouse and human cells. This characteristic would be expected to enhance the difference in MN size generated by aneugens versus clastogens.
A second mode of action signature was robust increases in the frequency of hypodiploid nuclei. This observation was first noted with TK6 cells [Bryce et al., 2007], although more recent work with that cell line suggest that it does not discriminate between modes of action as reliably as when hamster cell lines are studied. In regards to CHO-K1 cells, discrimination of aneugens and clastogens based on the former’s tendency to strongly induce hypodiploid nuclei is supported by recent studies conducted by Shi et al. [2009]. Thus, we continue to attribute induction of hypodiploidy to aneuploidization, possibly via a pathway that involves failed cytokinesis [Shi and King, 2005]. As noted by many investigators, extra chromosome and centrosome content can lead to multipole division, and this is a mechanism that promotes rapid acquisition of aneuploid status [Andreassen et al., 1996; Lingle et al, 2002]. We hypothesize that the lysis procedure used for flow cytometric MN scoring is capable of revealing aneuploidization, as hypodiploid nuclei are apparent as sub-2n DNA events with the light scatter and DNA staining characteristics of healthy cells’ nuclei: EMA-negative and SYTOX-intensity slightly lower than 2n.
The OECD Annex 3 list provided a means to systematically evaluate the In Vitro MicroFlow technique’s ability to reliably score MN frequency in two commonly used attachment cell lines across three laboratories. The diversity of these chemicals also helped us study flow cytometric assessments of cytoxicity (relative survival) as well as the mode of action signatures described above. Each of the endpoints was found to be transferable across laboratories. The fact that different cell lines and somewhat dissimilar experimental designs were used by each site reinforces the fact that the in vitro micronucleus assay is a versatile and robust system for evaluating chemicals for clastogenic and/or aneugenic activity [Kirsch-Volders et al., 2003; Parry and Parry, 2006]. Continued evaluation and validation of this and other techniques for automatically acquiring MN data is another important chapter in the assay’s evolution.
Acknowledgments
This work was funded by a grant from the National Institute of Health/National Institute of Cancer (S.D.D., No. 5R44CA117093). The contents are solely the responsibility of the authors, and do not necessarily represent the official views of the NCI.
Footnotes
Disclosure
S.M.B., S.A., S.R., J.C.B., and S.D.D. are employees of Litron Laboratories. Litron holds a patent covering flow cytometric methods for scoring micronuclei as described herein, and sells kits based on this technology (MicroFlowR).
References
- Andreassen PR, Martineau SN, Margolis RL. Chemical induction of mitotic checkpoint override in mammalian cells results in aneuploidy following a transient tetraploid state. Mutat Res. 1996;372:181–194. doi: 10.1016/s0027-5107(96)00138-8. [DOI] [PubMed] [Google Scholar]
- Avlasevich SL, Bryce SM, Cairns SE, Dertinger SD. In vitro micronucleus scoring by flow cytometry: differential staining of micronuclei versus apoptotic and necrotic chromatin enhances assay reliability. Environ Molec Mutagen. 2006;47:56–66. doi: 10.1002/em.20170. [DOI] [PubMed] [Google Scholar]
- Bryce SM, Bemis JC, Avlasevich SL, Dertinger SD. In vitro micronucleus assay scored by flow cytometry provides a comprehensive evaluation of cytogenetic damage and cytotoxicity. Mutat Res. 2007;630:78–91. doi: 10.1016/j.mrgentox.2007.03.002. [DOI] [PMC free article] [PubMed] [Google Scholar]
- Bryce SM, Avlasevich SL, Bemis JC, Lukamowicz M, Elhajouji A, Van Goethem F, De Boeck M, Beerens D, Aerts H, Van Gompel J, Collins JE, Ellis PC, White AT, Lynch AM, Dertinger SD. Interlaboratory Evaluation of a Flow Cytometric, High Content In Vitro Micronucleus Assay. Mutat Res. 2008;650:181–195. doi: 10.1016/j.mrgentox.2007.11.006. [DOI] [PMC free article] [PubMed] [Google Scholar]
- Kirsch-Volders M, Sofuni T, Aardema M, Albertini S, Eastmond D, Fenech M, Ishidate M, Jr, Kirchner S, Lorge E, Morita T, Norppa H, Surralles J, Vanhauwaert A, Wakata A. Report from the in vitro micronucleus assay working group. Mutat Res. 2003;540:153–163. doi: 10.1016/j.mrgentox.2003.07.005. [DOI] [PubMed] [Google Scholar]
- Lingle WL, Barrett SL, Negron VC, D’Assoro AB, Boeneman K, Liu W, Whitehead CM, Reynolds C, Salisbury JL. Centrosome amplification drives chromosomal instability in breast tumor development. PNAS. 2002;99:1978–1983. doi: 10.1073/pnas.032479999. [DOI] [PMC free article] [PubMed] [Google Scholar]
- Nüsse M, Kramer J. Flow cytometric analysis of micronuclei found in cells after irradiation. Cytometry. 1984;5:20–25. doi: 10.1002/cyto.990050105. [DOI] [PubMed] [Google Scholar]
- Organisation for Economic Co-operation and Development (OECD) Guidelines for the testing of chemicals, Draft Guideline 487: In vitro micronucleus test, December 13, 2007 (3rd version).
- Parry JM, Parry EM. The use of the in vitro micronucleus assay to detect and assess the aneugenic activity of chemicals. Mutat Res. 2006;607:5–8. doi: 10.1016/j.mrgentox.2006.04.007. [DOI] [PubMed] [Google Scholar]
- Schreiber GA, Beisker W, Bauchinger M, Nüsse N. Multiparametric flow cytometric analysis of radiation-induced micronuclei in mammalian cell cultures. Cytometry. 1992;13:90–102. doi: 10.1002/cyto.990130114. [DOI] [PubMed] [Google Scholar]
- Shi J, Bezabhie R, Szkudlinska A. Further evaluation of a flow cytometric in vitro micronucleus assay in CHO-K1 cells: a reliable platform that detects micronuclei and discriminates apoptotic bodies. Mutagenesis. 2009 doi: 10.1093/mutage/gep040. in press. [DOI] [PubMed] [Google Scholar]
- Shi Q, King RW. Chromosome nondisjunction yields tetraploid rather than aneuploid cells in human cell lines. Nature. 2005;437:1038–1042. doi: 10.1038/nature03958. [DOI] [PubMed] [Google Scholar]
- Wessels J, Nüsse M. Flow cytometric detection of micronuclei by combined staining of DNA and membranes. Cytometry. 1995;19:201–208. doi: 10.1002/cyto.990190303. [DOI] [PubMed] [Google Scholar]