Abstract
This report describes recent efforts on our continuous development of a synthetic signal injection method for quantification of metabolite content in MR spectroscopy and imaging. Previous work showed that conversion of spectral peaks to quantitative units of metabolite content could be achieved with a calibrated synthetic free induction decay (FID) generated by an inductively coupled injection coil. This work demonstrates that calibrated synthetic voxels, injected in the same manner, can be used to quantify metabolite content in real 19F image voxels. Images of vials containing different concentrations of sodium fluoride (NaF) were converted to units of moles by reference to precalibrated synthetically-injected voxels. Additional images of vials containing variable sodium chloride (NaCl) demonstrate that the quantification process is robust and immune to changes in coil loading conditions.
Introduction
Accurate conversion of images into quantitative units of metabolite content is challenging because it requires knowledge of the proportionality factor between the quantity of excited nuclei and the intensity of the voxels in the processed image. In general, a very high degree of diligence is required to account for all of the parameters that affect this calibration factor (1,2). As a result, nearly all MR images are presented in terms of arbitrary intensity units, which are of limited clinical and experimental utility.
We previously described a synthetic signal injection method for MR spectroscopy that addresses some of the problems, such as variable coil loading conditions and receiver gain stability, associated with determining the conversion factor (3). The basic principle behind this method is similar to the Electronic REference To access In vivo Concentrations (ERETIC) method (4-8) in that it relies on injection of an artificial free induction decay (FID), a pseudo-FID, to create a calibrated reference peak in the processed spectrum. The key difference between our method and the ERETIC method is that our pseudo-FID is generated by a small (about 1 mm diameter) injection coil mounted very close to the main RF coil. Mutual inductance (or shared magnetic field) allows the pseudo-FID to be transmitted by the injection coil and received by the main RF coil so that it is acquired and processed under the same conditions as the real FIDs. Since mutual inductance is the same mechanism by which the field created by excited nuclei in the sample couples with the main RF coil, the real peaks and the pseudo-peaks will vary proportionately due to changes in coil loading conditions or receiver gain. This ensures that the calibration factor, as determined during a separate calibration session, remains constant when acquisition conditions change.
In this study, we have adapted the synthetic signal injection method for use in 19F image quantification. We used very similar hardware as for the previous spectroscopy experiments but we modified the injection protocol so that, rather than injecting a pseudo-FID, we injected an appropriate k-space signal corresponding to several pseudo-voxels. The location and intensity of the pseudo-voxels was easily controlled, allowing pre-calibration against a phantom with a known 19F concentration.
Our results demonstrate that the inductively injected pseudo-voxels provide a robust calibration factor for converting real voxels into units of 19F concentration. Further, by varying the salt concentration in the 19F solutions, we demonstrate that the image quantification process is immune to changes in coil loading conditions.
Methods
The experiments were conducted on a Bruker 4.7 T horizontal bore magnet equipped with a Varian Inova spectrometer and VNMR version 6.1 software. Before each measurement, the tune and match capacitors were adjusted to yield 50 ohms impedance and the Bo field was optimized by manually adjusting the shims. Fluorine images were acquired using a spin echo sequence with the following parameters: TR/TE = 10 s/14 ms, 4 averages, slice thickness of 8 mm, matrix size of 128 × 64, field of view of 60 × 60 mm2. The total acquisition time was 43 minutes. A custom-built 57 mm diameter 19F saddle coil was used for transmitting and receiving the real 19F signals and for receiving the artificial reference signals. The artificial reference signals were transmitted via a 1.5 mm diameter single-turn injector coil rigidly mounted about 1 mm away from the main RF coil.
A C-program was written to generate the k-space waveform that was injected to create the reference pseudo-voxels. Input to the program was a one-dimensional array containing the same number of points as the read-out direction of the image. The points where pseudo-voxels were to appear were set to 1 and the remaining points were set to 0. The C-program performed an inverse Fourier transform of the array, to produce the corresponding k-space waveform, and put the result into a format that was compatible with the Varian pulse sequence programming language. When the pulse sequence ran, it read in the k-space waveform and played it through the second RF amplifier during the data acquisition period. More details on how the pseudo-signal waveform is played out can be found in our previous work (3). The phase of the waveform was not modulated with the phase encoding steps so the pseudo-voxels always appeared at the center of the image along the phase-encoding direction.
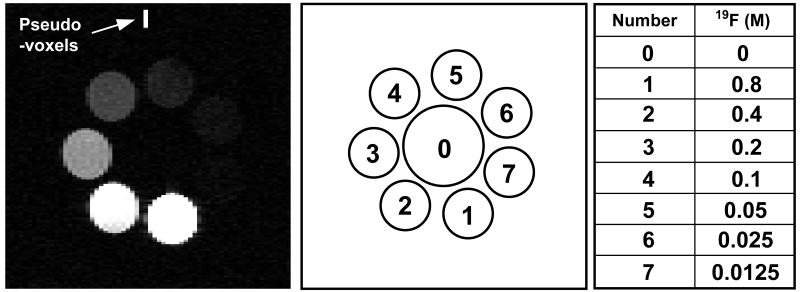
Images of seven 2 cc vials containing sodium fluoride (NaF) solutions with 19F concentrations of 0.8, 0.4, 0.2, 0.1, 0.05, 0.025 and 0.0125 M were acquired. The vials were arranged in a circular pattern as shown in the middle diagram of Fig. 1. Coil loading conditions were altered by adding salt to create NaCl concentrations of 0, 0.2 and 2 M in a 10 cc loading syringe located at the center of the NaF vials. The loading syringe contained no NaF.
Figure 1.
The eight pseudo-voxels appear at the top of the image of the seven NaF vials. The configuration of the NaF vials and the loading syringe is illustrated in the middle diagram. The table indicates the NaF concentrations in each of the vials. The signals from vials 6 and 7, containing the two lowest NaF concentrations, were not detectable above the image noise so no attempt was made to calculate these concentrations. Salt concentrations in the loading syringe, sample 0, were varied (0, 0.2 and 2 M) to induce different coil loading conditions.
The following equation was used to calculate 19F concentrations (3,4):
| Eq. (1) |
where: Cm is the calculated 19F concentration, Cref is the independently determined 19F concentration in the calibration sample, Am and Ap are the amplitudes of the real and pseudo-voxels, respectively, Am,ref and Ap,ref are the amplitudes of the real and pseudo-voxels acquired during the calibration session. For these experiments, Am,ref was defined by the voxels within the 0.8 M vial acquired with no salt in the syringe. Circular regions of interest consisting of 146 voxels centered over each of the vials were used to determine the Am values.
Results and Discussion
Figure 1 shows an image of the 7 NaF vials. The adjacent diagram and table show the 19F concentrations in each vial and indicate the position of the loading syringe near the center of the image. The 8 pseudo-voxels appear at the top of the image. As expected, signal intensities decrease with decreasing fluorine concentration. The signals from the vials containing the two lowest 19F concentrations (0.025 and 0.0125 M) were too low to be detected under these conditions and no attempt was made to quantify these concentrations.
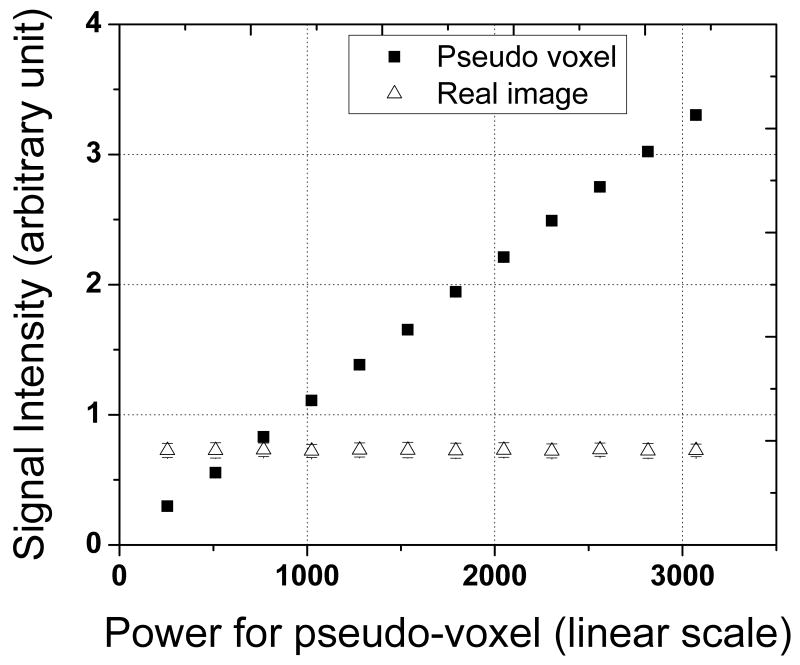
The quantification procedure is based on the assumption that the amplitude of the real voxels is independent of the amplitude of the pseudo-voxels (3). This independence is demonstrated in Fig 2. The amplitude of the signal from the pseudo-voxels increased linearly as current in the injector coil increased by raising the setting for the power in the second RF amplifier, the one connected to the injector coil. In contrast, the amplitude of the signal from real voxels remained constant. The external reference method often requires remaking reference samples to approximate the concentrations of real signals. Our quantification method provides pseudo-voxels with intensities that can be easily adjusted to match real signals, eliminating the need to create multiple reference samples.
Figure 2.
Pseudo-voxel signal and real signal from the 0.8 M NaF vial as a function of the power setting for the RF amplifier connected to the injector coil. The amplitude of the pseudo-voxel signal increased linearly with RF power. The amplitude of the real signal remained constant.
The independence between the real and pseudo-voxel amplitudes is ensured by the design of the injector coil. The injector coil is small (1.5 mm diameter) and rigidly mounted to the main RF coil so that it is always at least two times the diameter away from the sample. This is to reduce the potential for coupling between the injector coil and the sample. Such coupling would cause the amplitude of the field created by the injector coil to change for samples of different electrolyte content and destroy the calibration factor.
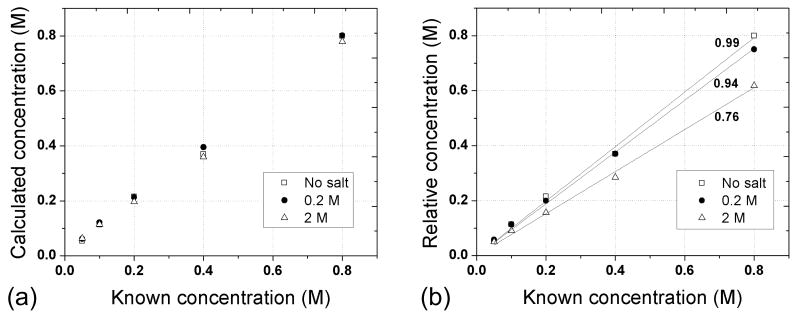
Figure 3a shows the correlation between the known 19F concentrations and the concentrations as calculated by equation 1. Increasing the salt concentration in the loading syringe caused the quality factor to drop by about 35%, from 192 to 141, and the 90 degree pulse width to increase by about 25%, from 54 to 68 msec, reflecting changes in the loading conditions for the main RF coil (see Table 1). The changes in coil loading conditions caused the absolute intensity of the signal within the vials to drop substantially, as shown in the diagram. Despite these changes in acquisition conditions, the image intensity can be accurately converted to units of concentration. The calculated concentrations fall along the line of identity (Pearson product moment correlation coefficients for three salt concentrations of 0, 0.2 and 2 M are 0.998, 0.999 and 0.999, respectively), validating that the conversion from image intensity to concentration is accurate and immune to changes in coil loading conditions.
Figure 3.
(a) The graph shows the correlation between known concentrations and the concentrations calculated using equation (1). In comparison, the relative concentrations (b) reflect a substantial drop in signal as the loading of the coil increased. The relative amplitudes acquired with no salt in the loading syringe were about 25% higher than they were at the highest salt concentration. Relative concentrations generate the slopes of 0.99 ± 0.02, 0.94 ± 0.01 and 0.76 ± 0.02 for the loading samples of 0, 0.2 and 2 M NaCl, respectively.
Table 1.
Quality factors and pulse lengths for three salt concentrations
| NaCl concentration (M) | Quality factor | Pulse length at 54 dB (ms) |
|---|---|---|
| 0 | 192 | 54 |
| 0.2 | 172 | 58 |
| 2 | 141 | 68 |
Quality factors and RF pulse lengths were measured for the custom-built 19F RF coil to compare different coil loading conditions induced by three NaCl concentrations (0, 0.2 and 2 M) doped for distilled water filled in a 10 cc syringe.
As the salt concentration in the loading syringe increased, the intensities of the NaF signal decreased due to heavier loading conditions. At the highest salt concentration the signal intensities were approximately 25% lower than they were with no salt. Notice that intensities of 0.8 M sample in three images were decreased with salt concentration due to increased coil loading. However, the ratio of sample intensities to their corresponding pseudo-signal intensity remained unchanged, which provided high correlation (∼ 0.99 of correlation coefficients) between the calculated and known concentrations as shown in the graph of Fig. 3a. The concentration values were calculated using Eq (1) as described in the method section.
To compare our method with the conventional relative quantification technique, we used the highest 19F concentration of the loading sample with no salt as a reference and performed relative quantification for the other two coil loading cases. Figure 3b demonstrates that coil loading match is important for accurate quantification. Matching of coil loading conditions for in vivo quantification is a time consuming process. Different subjects provide different loading conditions and different reference measurements need to be acquired whenever there is a loading change. In addition, physiological changes during the measurements could alter coil loading conditions. The degree of such loading changes is not easily monitored.
Conclusions
MRI is an emerging modality in noninvasive cell tracking in vivo. Recently, paramagnetic contrast agents, such as SPIO (super-paramagnetic iron oxide) nanoparticles, have been utilized to label cells (9,10). Paramagnetic contrast agents change MR relaxation times of labeled cells, thus generating image contrast in 1H images. However, quantification of the number of labeled cells is challenging and experimentally complicated. 19F MRI of labeled cells has been recently reported to demonstrate potential of cell tracking of labeled cells (11,12). 19F MRI is attractive due to its background-free images and could be advantageous in quantifying 19F labeled cells. However, there exist the same challenges to achieve absolute quantification of 19F MRI as those for conventional MR quantification methods. In the present study, we attempted 19F MRI quantification because of its important potential applications for tracking labeled cells and its background-free images, demonstrating the potential use of our method for quantifying 19F labeled cells.
We demonstrated that our pseudo-FID injection method can be modified to create pseudo-voxels in images and that these pseudo-voxels provide a robust calibration factor that can be used to quantify 19F concentrations. The intensities of real and pseudo-voxels decreased in the same proportion when the loading conditions of the main RF coil were increased. This allowed accurate conversion to units of concentration. These results demonstrate that the quantification process is immune to variations in the loading conditions.
Acknowledgments
The authors are grateful to the following funding sources for supporting this work: NIH grants R21EB008166 (DL) and R21EB009438 (KM).
References
- 1.Kreis R. Quantitative localized 1H MR spectroscopy for clinical use. Progress in Nuclear Magnetic Resonance Spectroscopy. 1997;31(23):155–195. [Google Scholar]
- 2.Jansen JF, Backes WH, Nicolay K, Kooi ME. 1H MR spectroscopy of the brain: absolute quantification of metabolites. Radiology. 2006;240(2):318–332. doi: 10.1148/radiol.2402050314. [DOI] [PubMed] [Google Scholar]
- 3.Marro KI, Lee D, Shankland EG, Mathis CM, Hayes CE, Amara CE, Kushmerick MJ. Synthetic signal injection using inductive coupling. J Magn Reson. 2008;194(1):67–75. doi: 10.1016/j.jmr.2008.05.022. [DOI] [PMC free article] [PubMed] [Google Scholar]
- 4.Barantin L, Le Pape A, Akoka S. A new method for absolute quantitation of MRS metabolites. Magnetic Resonance in Medicine. 1997;38(2):179–182. doi: 10.1002/mrm.1910380203. [DOI] [PubMed] [Google Scholar]
- 5.Akoka S, Trierweiler M. Improvement of the ERETIC method by digital synthesis of the signal and addition of a broadband antenna inside the NMR probe. Instr Sci and Tech. 2002;30(1):21–29. [Google Scholar]
- 6.Akoka S, Barantin L, Trierweiler M. Concentration measurement by proton NMR using the ERETIC method. Analytical Chemistry. 1999;71(13):2554–2557. doi: 10.1021/ac981422i. [DOI] [PubMed] [Google Scholar]
- 7.Silvestre V, Goupry S, Trierweiler M, Robins R, Akoka S. Determination of substrate and product concentrations in lactic acid bacterial fermentations by proton NMR using the ERETIC method. Analytical Chemistry. 2001;73(8):1862–1868. doi: 10.1021/ac0013204. [DOI] [PubMed] [Google Scholar]
- 8.Molinier V, Fenet B, Fitremann J, Bouchu A, Queneau Y. Concentration measurements of sucrose and sugar surfactants solutions by using the <sup>1</sup>H NMR ERETIC method. Carbohydrate Research. 2006;341(11):1890–1895. doi: 10.1016/j.carres.2006.04.034. [DOI] [PubMed] [Google Scholar]
- 9.Corot C, Robert P, Idee JM, Port M. Recent advances in iron oxide nanocrystal technology for medical imaging. Adv Drug Deliv Rev. 2006;58(14):1471–1504. doi: 10.1016/j.addr.2006.09.013. [DOI] [PubMed] [Google Scholar]
- 10.Liu W, Frank JA. Detection and quantification of magnetically labeled cells by cellular MRI. Eur J Radiol. 2009;70(2):258–264. doi: 10.1016/j.ejrad.2008.09.021. [DOI] [PMC free article] [PubMed] [Google Scholar]
- 11.Ahrens ET, Flores R, Xu H, Morel PA. In vivo imaging platform for tracking immunotherapeutic cells. Nat Biotechnol. 2005;23(8):983–987. doi: 10.1038/nbt1121. [DOI] [PubMed] [Google Scholar]
- 12.Partlow KC, Chen J, Brant JA, Neubauer AM, Meyerrose TE, Creer MH, Nolta JA, Caruthers SD, Lanza GM, Wickline SA. 19F magnetic resonance imaging for stem/progenitor cell tracking with multiple unique perfluorocarbon nanobeacons. FASEB J. 2007;21(8):1647–1654. doi: 10.1096/fj.06-6505com. [DOI] [PubMed] [Google Scholar]


