

Abstract
Landmark-based high-dimensional diffeomorphic maps of the hippocampus (although accurate) is highly-dependent on rater’s anatomic knowledge of the hippocampus in the magnetic resonance images. It is therefore vulnerable to rater drift and errors if substantial amount of effort is not spent on quality assurance, training, and re-training. A fully-automated, FreeSurfer-initialized large-deformation diffeomorphic metric mapping procedure of small brain substructures, including the hippocampus, has been previously developed and validated in small samples. In this report, we demonstrate that this fully-automated pipeline can be used in place of the landmark-based procedure in a large-sample clinical study to produce similar statistical outcomes. Some direct comparisons of the two procedures are also presented.
Keywords: Computational anatomy, Automated segmentation, MR imaging, FreeSurfer
INTRODUCTION
As large imaging databases of hundreds and sometimes thousands of cross-sectional and longitudinal magnetic resonance (MR) images become available (e.g., Alzheimer Disease Neuroimaging Initiative), accurate, automated tools are needed to perform brain structure segmentation reliably and accurately. Recent advances in computational anatomy have begun to provide such segmentation tools. Powerful whole-brain segmentation tools such as FreeSurfer (Fischl et al., 2002) can produce an initial automated segmentation of brain substructures such as the hippocampus and deep brain nuclei. However, the segmentations are not smooth enough to be suitable for shape computation and analysis, which have been shown to provide additional discriminant power and understanding of disease process as compared to volume alone (Csernansky et al., 2004).
Template-based global whole-brain mapping methods often require the computation of an invertible transformation (e.g., large-deformation diffeomorphic maps). Although they provide smooth substructure representations, these methods are prone to trapping in local minima because of inaccurate initial whole-brain alignments. Therefore, restriction to a region of interest has a better likelihood of computing an invertible transformation from an anatomical atlas image. Thus far, locating and extracting such a region of interest (ROI) has been achieved by expert raters manually landmarking homologous landmark points in the scans (Haller et al., 1997; Hogan et al., 2000; Du et al., 2001).
For the past decade, our group has applied a landmark-initialized large-deformation high-dimensional brain mapping (LMK + HDBM-LD) procedure for mapping the hippocampus and deep brain nuclei (Csernansky et al., 2004; Wang et al., 2007). This was a variant of the “greedy” algorithm implemented by Christensen et al. (1994). In this procedure, 12 global landmarks were placed at the anterior and posterior commissures, and points at the periphery of the cerebrum; 22 additional, local landmarks were placed at pre-selected points on the surface of the hippocampus along its anterior–posterior axis. Initial landmark-based registration (Joshi et al., 1995; Haller et al., 1997) served to adjust the orientation and size for the head (based on global landmarks) and the hippocampus (based on local landmarks) and therefore provided initial alignment for the HDBM-LD methods (Christensen et al., 1994), which then proceeded independent of further user input. Even though this procedure has been shown to be superior in reliability to the results obtained from manual outlining (Haller et al., 1997), it is not entirely automatic, and the expertise of the neuroanatomist plays a key role. The landmarking procedure depends on individual expert knowledge of the MR scans, and when applied to large-sample clinical imaging studies, may bias the initial landmark-driven transformations. It is also vulnerable to rater drift and errors if sufficient amount of effort is not spent on quality assurance, training, and retraining. A fully-automated procedure that does not involve such expert interactions is needed.
FreeSurfer-initialized large-deformation diffeomorphic metric mapping (FS + LDDMM) as a fully automated mapping pipeline of small brain substructures, including the hippocampus and other deep nuclei, has been validated in small samples against expert manual segmentations (Khan et al., 2008). It has demonstrated improved accuracy over both FreeSurfer alone, or the above LMK + HDBM-LD approaches.
In this study, we sought to demonstrate that the new FS + LDDMM pipeline, as a fully-automated replacement of the previously published studies using the semi-automated approach, when applied to a clinical imaging study, should yield similar statistical outcomes (Wang et al., 2006).
METHODS
Subjects and Scans
A total of 89 CDR 0.5 (clinical dementia rating) with a DAT (dementia of Alzheimer type) diagnosis and 125 non-demented CDR 0 subjects were included in this study. The CDR (Morris, 1993) was performed to assess the severity of dementia symptoms. The CDR rates the presence or absence of cognitive impairment on a 5 point scale: 0 indicates no dementia and 0.5, 1, 2, and 3 indicate very mild, mild, moderate, and severe dementia, respectively. CDR assessments have been shown to have high inter-rater reliability (Morris et al., 1997; Berg et al., 1998). Subject characteristics are summarized in Table 1.
TABLE 1.
Subject Information
| Control (CDR 0) | DAT (CDR 0.5) | Difference | |
|---|---|---|---|
| N | 125 | 89 | |
| M/F Ratio | 44/81 | 45/44 | Chi-square = 5.1 |
| P = 0.025 | |||
| Age (yr) | 76.4 (7.9) | 76.0 (7.3) | t = 0.43, df = 212 |
| [range] | [60.2–103.6] | [60.6–92.6] | P = 0.67 |
MPRAGE scans were collected on a 1.5-Tesla Vision system (Siemens Medical Systems) for all subjects, using a standard head coil with the following parameters: TR = 9.7 μs, TE = 4.0 μs, flip angle = 10°, voxel resolution = 1 mm × 1 mm × 1.25 mm, matrix = 256 × 256, scan time = 6.5 min. Multiple (2–4) MPRAGE image volumes were collected in sequential order for each subject, and were aligned with the first scan and averaged to create a low-noise image volume (Buckner et al., 2004).
The MR image from a non-demented 69-year-old male CDR 0 subject was used as the template scan. This subject was obtained from the same source as the other subjects in the study, but was not otherwise included in the data analysis. The left and right hippocampi in this template scan have been manually segmented (Csernansky et al., 2000). This was the same template as used in Wang et al. (2006).
FS + LDDMM
All MPRAGE images were processed through the FS + LDDMM pipeline, which consisted of the following three stages, (1) FreeSurfer labeling, (2) initial alignment with intensity normalization, and (3) LDDMM-based diffeomorphic transformation. The details can be found in Khan et al. (2008), and we describe them briefly here.
FreeSurfer labeling
Initial, automated segmentation of the template and each target image using FreeSurfer 3.0.5 (autorecon1 and autore-con2), which generated 37 structural labels of the brain (Fischl et al., 2002), formed the first stage in the FS + LDDMM pipeline. The labels of cerebro-spinal fluid (CSF) and the hippocampus were subsequently used by FS + LDDMM to map the hippocampus.
Initial alignment with intensity normalization
LDDMM required the coarse alignment between the target and template ROIs surrounding the hippocampus. This alignment was achieved by an affine transformation between the FS hippocampal labels in the target and the template images. An ROI subvolume was then generated in the template image and each template-aligned target image centered on the FreeSurfer label of the hippocampus.
Inside the ROI, we performed a variant of histogram matching to ensure homogeneity of corresponding tissue type intensities between the images. This step was a specialization of the intensity scale standardization by Nyul et al. (2000) where the knowledge of the tissue intensity distributions was assumed to be known. Before this, the MR image intensities were rescaled by linearly mapping the range between the 0.5 and 99.5 percentile intensities to the full image intensity range. Then, the median image intensities in the FreeSurfer CSF, gray matter, and white matter histograms were located in the ROI. These intensities were aligned using piece-wise linear intensity transformation.
LDDMM-based diffeomorphic registration
LDDMM (Beg et al., 2005) generates a diffeomorphic transformations that is smooth and has a smooth inverse, thus anatomy is mapped consistently, without fusions or tears, while preserving smoothness of anatomical features. A three-step procedure for computing the optimal diffeomorphic transformation was developed in a multi-resolution coarse-to-fine strategy. At each step, LDDMM was initialized with the optimal velocity vector field and map computed at the previous step, with additional anatomical information added into the optimization process. This strategy was designed to guide the optimization away from potential local minima. In the first step, LDDMM was performed using the FreeSurfer CSF labels, or equivalently, the portion of the ventricles in the ROI. In the second step, the ROI was smoothed [convolution with a 3 × 3 × 3 voxel Gaussian mask of 0.5-voxel standard deviation (SD)] and LDDMM was then performed on the ROI. In the third step, a second LDDMM was performed with the smoothing removed. After the above multi-step mapping, the template surface in the atlas space was propagated to the target ROI space using the final LDDMM transformation, followed by the inverse affine transformation to the target’s whole brain space, thus generating the final hippocampus surface in the target.
Hippocampal Subfields
Left and right hippocampal volumes in each subject were calculated as the volumes enclosed by the hippocampal surfaces. An average hippocampal surface constructed from 86 healthy subjects from Wang et al. (2006) was used as a reference surface, from which linear displacements of each subject’s hippocampal surface was calculated at each surface vertex. For each subject, deformations were averaged within surface zones that represent surface deformations for CA1, subiculum, and remainder [CA2, 3, 4, dentate gyrus (DG)] subfields (Csernansky et al., 2005; Wang et al., 2006). Negative values for these measures represented inward variation of the surface while positive values for these measures represent outward variation of the surface. Note what were referred to as lateral, inferior-medial, and superior zones in Wang et al. (2006) were referred to as CA1, subiculum, and remainder subfields, respectively, in the present study.
Data Analysis
All statistical analyses were performed in SAS (SAS Institute, 2000). For volume comparison, we included left and right hippocampal volumes in a repeated-measures analysis of variance (ANOVA) with CDR status as main effect and hemisphere as repeated factor. For subfield deformation comparisons, deformation values from each surface zone were entered into a repeated-measures ANOVA, with CDR status as main effect, hemisphere and surface zone deformations as repeated measurements. Surface zone deformations were listed as “identity” in the repeated statement in SAS. Gender was used as a covariate throughout. Effect sizes (Cohen’s d) were also calculated for each zone per hemisphere.
Finally, to determine post hoc whether hippocampal volume and surface zone deformations could be used for discriminant purposes, logistic regression procedures were used to determine odds ratios, significance (95% confidence limits) and the C-statistics for each variable (i.e., volume and surface zone deformation). The odds ratio is like regression coefficients, whereas the C-statistic is like area under the ROC curve, which can be interpreted as probability of correct classification. An alpha of 0.05 was maintained for all analyses.
For evidence of replication, the results from the above statistical tests were compared with the results from Wang et al. (2006), where LMK + HDBM-LD was used to generate the same kinds of hippocampal volume and surface subfield deformation measures as in the current study. The caveat, however, was that only 79 (27 CDR 0.5, 52 CDR 0) subjects were common to both studies. This was because FLASH scans were used in Wang et al. (2006), MPRAGE scans were used in the present study, and only a portion of the subjects from our previous study had also MPRAGE images at scanning. Also, some subjects included in the present study had not enrolled in the previous study. We therefore could not make a complete comparison with the published data. However, we used the hippocampal data for these subjects from 2006 to correlate with the hippocampal data derived from FS + LDDMM pipeline on these overlapping subjects. Spearman Correlation was calculated between the two methods. Significance was reported without correction for multiple comparisons.
RESULTS
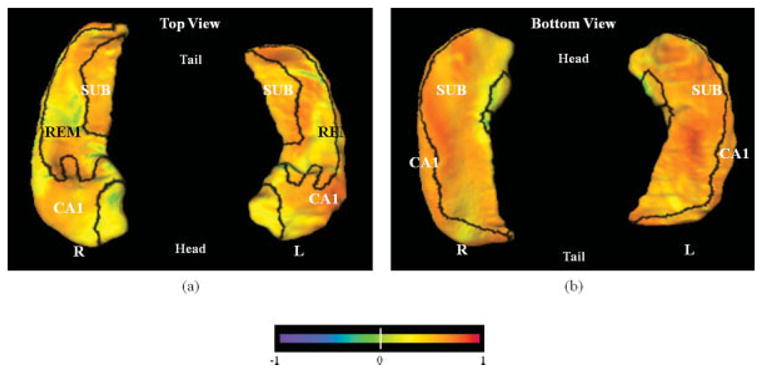
The difference between the DAT group and the non-demented control group is visualized in Figure 1, with the boundaries between the three zones of the hippocampal surface (i.e., CA1, subiculum, and remainder) drawn in black. Areas of hippocampus showing the greatest group differences (as marked by the blue colors) are concentrated in the CA1 and subiculum surface zones. This pattern of deformation resembles our previous findings (Wang et al., 2006). It should also be noted that most of the lateral aspects of the hippocampal surface (also in the CA1 subfield zone) showed much of the inward deformation, a pattern that we have previously reported in non-overlapping subjects (Csernansky et al., 2000; Wang et al., 2003).
FIGURE 1.

Visualization of the pattern of hippocampal surface deformation in subjects with very mild DAT compared with non-demented subjects. Panel a shows the left and right hippocampi from the top (dorsal surface), while panel b shows the left and right hippocampi from the bottom (ventral surface). Panels c and d show the left and right hippocampi from a perspective slightly above and to the left and right of a midline plane, respectively, to highlight deformities along the lateral body of the left and right hippocampi that approximate the CA1 subfield. Boundaries between the three zones of the hippocampal surface (i.e., CA1, subiculum, and remainder) are drawn in black and all three zones are labeled. The flame coloring represents the difference between the mean surface of the subjects with very mild DAT and the mean surface of non-demented subjects. Inward variation of the hippocampal surface is represented by cooler colors (i.e., blue to purple), while outward variation is represented by warmer colors (i.e., orange to red). [Color figure can be viewed in the online issue, which is available at www.interscience.wiley.com.]
Mean hippocampal volume and surface zone deformation with respect to the healthy, reference group mean from Wang et al. (2006) are listed in Table 2 for the DAT and control groups. There was a significant group effect on volume (F = 43.0, df = 1,210, P < 0.0001) and subfield surface deformations (F = 12.1, df = 3,208, P < 0.0001). When the DAT group was compared with the control group, the effect sizes were negative, indicating that the DAT subjects had smaller hippocampal volumes and more inward surface zone deformations. As in the previous study, we found larger effects in the CA1 and subiculum surface zone deformations than in the remainder zone.
TABLE 2.
Mean Hippocampal Variables by the FS + LDDMM Mapping Pipeline
| Variable (unit) | Overall group effect F(df 1,df 2) P | CDR 0.5 | CDR 0 | Effect size | Post-hoc LS means (CDR 0.5 < CDR 0) | ||
|---|---|---|---|---|---|---|---|
| Volume (mm3) | 43.0 (1,210) P < 0.0001 | L | 1639 (351) | 1919 (352) | −0.80 | P < 0.0001 | |
| R | 2107 (474) | 2454 (408) | −0.79 | P < 0.0001 | |||
| CA1 | L | −0.60 (0.47) | −0.33 (0.46) | −0.59 | P < 0.0001 | ||
| R | −0.52 (0.47) | −0.22 (0.38) | −0.70 | P < 0.0001 | |||
| Subfield surface deformation (mm) | 12.1 (3,208) P < 0.0001 | Subiculum | L | −0.25 (0.25) | −0.11 (0.26) | −0.56 | P < 0.0001 |
| R | −0.10 (0.27) | 0.036 (0.23) | −0.57 | P < 0.0001 | |||
| Remainder | L | −0.15 (0.35) | −0.005 (0.27) | −0.49 | P = 0.0009 | ||
| R | 0.040 (0.35) | 0.097 (0.32) | −0.17 | P = 0.25 |
Effect size was calculated for CDR 0.5 versus CDR 0, using Cohen’s d. Statistical tests were done for each variable, using repeated-measures ANOVA with CDR status as main effect and hemisphere as repeated factor. Gender was used as a covariate. Post hoc least squares means tests (CDR 0.5 < CDR 0) were also shown.
Finally, each measure of volume and surface zone deformation was entered into a separate logistic regression procedure to examine its ability to discriminate the two groups, with the healthy non-demented subjects as the reference group; these results are summarized in Table 3. A significant odds ratio of 1.14 for 0.1 mm decrement of the left CA1 can be interpreted as follows: for an inward displacement of 0.1 mm (i.e., negative when compared to the mean of the healthy comparison subjects; inward displacement of 0.1 mm is equivalent to volume reduction of 68 mm3), the odds of a subject being DAT is 1.14 times the odds of it being a healthy comparison subject [In the logistic regression procedure, the healthy comparison group is the reference group, the stricter interpretation of the statistical output is that for a given subject, when the CA1 zone is deformed outward by 0.1 mm (positive increase), the odds of this subject being a healthy comparison subject is 1.13 times the odds of it being a DAT subject. Since diagnosing healthy subjects is not intuitive, we turned the interpretation around because the reciprocity property of the odds ratio allows one to do that]. When the confidence limits for a particular variable do not include 1, the odds ratio is significant. When left and right hippocampal volume, CA1, subiculum, or left remainder surface zone deformation was increased by 0.1 mm, a significant odds ratio was obtained (range, 1.14–1.27). However, odds ratio for the right remainder surface zone deformation was non-significant.
TABLE 3.
Odds Ratios and C-Statistics for Each Morphometric Variable when Used in a Logistic Regression Procedure
| Morphometric measure | Unit of increase | Odds ratio | 95% Confidence limits | C-Statistics | |
|---|---|---|---|---|---|
| Volume | L | 68 mm3 | 1.16 | 1.10–1.24 | 0.71 |
| R | 68 mm3 | 1.13 | 1.08–1.19 | 0.71 | |
| CA1 deformation | L | 0.1 mm | 1.14 | 1.07–1.21 | 0.67 |
| R | 0.1 mm | 1.18 | 1.10–1.27 | 0.68 | |
| Subiculum deformation | L | 0.1 mm | 1.25 | 1.12–1.41 | 0.66 |
| R | 0.1 mm | 1.27 | 1.13–1.44 | 0.64 | |
| Remainder deformation | L | 0.1 mm | 1.17 | 1.07–1.29 | 0.61 |
| R | 0.1 mm | 1.05 | 0.97–1.15 | 0.56 |
When the confidence limits for a particular variable do not include 1, the odds ratio is significant. Significant odds ratios were found for the left and right lateral zone displacements and inferior-medial zone displacements. Other variables had 95% confidence limits too close to 1 to be significant. Interpretation: e.g., CA1: for a decrease of 0.1 mm (i.e., inward displacement when compared to the mean of healthy comparison subjects), the odds of being a DAT subject versus the odds of being a healthy comparison subject is 1.14. Inward displacement of 0.1 mm is equivalent to volume reduction of 68 mm3. The C-statistic is like area under the ROC curve, which can be interpreted as probability of correct classification.
For the 79 subjects that were common to both studies, the hippocampal maps computed via the FS + LDDMM pipeline in the current study, and the hippocampal maps computed via the LMK + HDBM-LD pipeline in the previous study were used to compute correlations. The correlations across surface vertices were summarized in Table 5, and visualized on the template surface in Figure 2, where the significant correlations were painted as a flame scale onto each surface point. Surface points for which correlations were not significant were painted yellow–green. Scatter plots (correlation and Bland-Altman) of hippocampal volume and surface deformation measures derived from FS + LDDMM pipeline versus measures derived from the LMK + HDBM-LD pipeline are shown in Figure 3, and correlations among the hippocampal variables are listed in Table 4. It is not surprising that the remainder surface zone, which we previously reported to have little impact on DAT discrimination, had the lowest correlations between the two methods.
TABLE 5.
Correlations of Hippocampal Subfield Surface Deformation, by Surface Vertices, Between the LMK + HDBM-LD and the FS + LDDMM Mapping Pipeline for the Overlapping 79 Subjects
| Mean (SD) | Median | Range | % Surface vertices | |
|---|---|---|---|---|
| CA1 | 0.59(0.13) | 0.60 | 0.22–0.87 | 97.6 |
| Subiculum | 0.56(0.13) | 0.57 | 0.22–0.86 | 96.1 |
| Remainder | 0.50(0.14) | 0.51 | 0.22–0.79 | 92.9 |
Spearman correlation coefficients are reported. All correlations are P < 0.0001. The number of surface vertices that show significant correlation is shown as a percentage of total number of surface vertices within each subfield zone.
FIGURE 2.

Scatter plots of hippocampal volume and surface deformation measures derived from FS + LDDMM pipeline versus measures derived from the LMK + HDBM pipeline in the overlapping 79 subjects. Correlation plots (columns a, b) and Bland-Alt-man plots (columns c, d) for volume (top row), CA1 deformation (second row), subiculum deformation (third row), and remainder (bottom row) are shown. Columns a and c are for left hemisphere measures and columns b and d are for right hemisphere measures. [Color figure can be viewed in the online issue, which is available at www.interscience.wiley.com.]
FIGURE 3.
Correlations of hippocampal subfield surface deformation, by surface vertices, between the LMK + HDBM and the FS + LDDMM mapping pipeline for the overlapping 79 subjects. Only the surface vertices that show significant correlations were colored according to the correlation values, others were colored as yellow–green. Panel a shows dorsal view (from the top) and panel b shows ventral view (from the bottom) of the hippocampus. [Color figure can be viewed in the online issue, which is available at www.interscience.wiley.com.]
TABLE 4.
Correlations of Hippocampal Variables Between the LMK + HDBM and the FS + LDDMM Mapping Pipeline for the Overlapping 79 Subjects
| L | R | |
|---|---|---|
| Volume | 0.85 | 0.85 |
| CA1 | 0.85 | 0.85 |
| Subiculum | 0.72 | 0.73 |
| Remainder | 0.60 | 0.42 |
Spearman correlation coefficients are reported. All correlations are P < 0.0001.
DISCUSSION
The overall deformation pattern of DAT subjects versus the control subjects was visually similar to that reported in our previous study using the LMK + HDBM pipeline (Wang et al., 2006), with CA1 and subiculum surface zones showing the majority of the differences between these two subjects groups.
With the exception of the left remainder surface zone, all the other surface zones showed similar group effect, compared with the previous study: compared with CDR 0 subjects, CDR 0.5 subjects had significantly smaller hippocampal volumes and more inward deformation in the CA1 and subiculum subfield surface zones. The CDR 0.5 subjects showed similar mean (SD) surface zone deformations. However, the CDR 0 subjects exhibited greater surface zone deformations compared with our previous study. For example, in the current study, the mean (SD) of the CA1 zone was −0.33 (0.46) mm, while the previous study showed a mean (SD) of 0 (0.40) (unpublished, reference data). The phenomenon is similar for the other subfield zones, where the SD (variability) was similar between the two studies and the mean was 0 in the previous study (the mean was zero because the average of the CDR 0 subjects were used as the reference).
The effect sizes of hippocampal surface zone deformations in this study were smaller than previously reported. This was probably due to the fact that the reference groups were different. Although the DAT group exhibited similar means and standard deviations and the control group had similar standard deviations, the control group in this study showed an appreciable amount of inward deformation in the CA1 (left −0.33, right −0.22) while the healthy reference group from Wang et al. (2006) had an average of 0 (used as reference). This difference could be due to the fact that 20 healthy subjects from a study of schizophrenia were included in the reference group of the previous study. The subjects included in this study were somewhat older, and aging may be related to hippocampal volume loss and shape deformities.
The odds ratios and C-statistics also reflected the above trend when comparing the two studies: that the values in the current study were similar but slightly lower compared with those reported in the previous study, primarily due to the fact that the current CDR 0 subjects had more inward deformations and smaller hippocampal volumes. For example, for every volume decrease in the left hippocampus by 68 mm3, the odds ratio of DAT diagnosis increases by 16%, and such relationship was non-significant in the right remainder subfield zone.
We could not make a complete comparison between the two studies because only 79 (27 out of 89 CDR 0.5, 52 out of 125 CDR 0) subjects included in this study overlapped with Wang et al. (2006). We did, however, report correlations for the shared subjects, as a further validation of the fully-automated FS + LDDMM pipeline. In addition, the averaged MPRAGE scans used in the present study were of considerably higher quality [visually higher signal-to-noise (S/N) and contrast-to-noise ratios] than the FLASH scans used in the previous study, which led to better segmentation quality (by visual inspection).
The influence of segmentation accuracy on the surface measurements is worth commenting. In Khan et al. (2008), we reported a mean surface distance of 1.23 mm for CDR 0.5 subjects and 1.52 mm for CDR 0 subjects when compared with manually delineated hippocampi. This group-dependent difference was similar for both the FreeSurfer-only and FS + LDDMM approaches. This indicates that a tendency for any algorithm to overestimate the hippocampus may exist for one group versus the other. Furthermore, the 10 subjects used in Khan et al. (2008) were not included in this study.
Limitations of this approach includes the dependence on a single-subject template, which can be alleviated in the future by using average templates computed from populations. Another limitation is the lack of testing on scans collected on higher-field (e.g., 3-Tesla) scanners. The overall statistical comparisons indicate that the fully-automated FS + LDDMM pipeline could be used in place of the semi-automated LMK + HDBM-LD pipeline that depended upon manual placement of anatomic landmarks.
Acknowledgments
Grant sponsor: PHS; Grant numbers: P01 AG026276, P01 AG03991, P50 AG05681, R01 AG025824, R01 MH60883, P50 MH71616, P41 RR15241, NSERC 31–611387, CHRP 751115; Grant sponsor: Pacific Alzheimer Research Foundation; Grant number: 869294.
Ali Khan was supported by NSERC PGS-M scholarship.
References
- Beg MF, Miller MI, Trouve A, Younes L. Computing large deformation metric mappings via geodesic flows of diffeomorphisms. Int J Comput Vis. 2005;61:139–157. [Google Scholar]
- Berg L, McKeel DW, Jr, Miller JP, Storandt M, Rubin EH, Morris JC, Baty J, Coats M, Norton J, Goate AM, Price JL, Gearing M, Mirra SS, Saunders AM. Clinicopathologic studies in cognitively healthy aging and Alzheimer’s disease: Relation of histologic markers to dementia severity, age, sex, and apolipoprotein E genotype. Arch Neurol. 1998;55:326–335. doi: 10.1001/archneur.55.3.326. [DOI] [PubMed] [Google Scholar]
- Buckner RL, Head D, Parker J, Fotenos AF, Marcus D, Morris JC, Snyder AZ. A unified approach for morphometric and functional data analysis in young, old, and demented adults using automated atlas-based head size normalization: Reliability and validation against manual measurement of total intracranial volume. Neuroimage. 2004;23:724–738. doi: 10.1016/j.neuroimage.2004.06.018. [DOI] [PubMed] [Google Scholar]
- Christensen GE, Rabbitt RD, Miller MI. 3D brain mapping using a deformable neuroanatomy. Phys Med Biol. 1994;39:609–618. doi: 10.1088/0031-9155/39/3/022. [DOI] [PubMed] [Google Scholar]
- Csernansky JG, Wang L, Joshi S, Miller JP, Gado M, Kido D, McKeel D, Morris JC, Miller MI. Early DAT is distinguished from aging by high-dimensional mapping of the hippocampus. Neurology. 2000;55:1636–1643. doi: 10.1212/wnl.55.11.1636. [DOI] [PubMed] [Google Scholar]
- Csernansky JG, Wang L, Joshi SC, Ratnanather JT, Miller MI. Computational anatomy and neuropsychiatric disease: Probabilistic assessment of variation and statistical inference of group difference, hemispheric asymmetry, and time-dependent change. Neuroimage. 2004;23 (Suppl 1):S56–S68. doi: 10.1016/j.neuroimage.2004.07.025. [DOI] [PubMed] [Google Scholar]
- Csernansky JG, Wang L, Swank J, Miller JP, Gado M, McKeel D, Miller MI, Morris JC. Preclinical detection of Alzheimer’s disease: Hippocampal shape and volume predict dementia onset in the elderly. Neuroimage. 2005;25:783–792. doi: 10.1016/j.neuroimage.2004.12.036. [DOI] [PubMed] [Google Scholar]
- Du AT, Schuff N, Amend D, Laakso MP, Hsu YY, Jagust WJ, Yaffe K, Kramer JH, Reed B, Norman D, Chui HC, Weiner MW. Magnetic resonance imaging of the entorhinal cortex and hippocampus in mild cognitive impairment and Alzheimer’s disease. J Neurol Neurosurg Psychiatry. 2001;71:441–447. doi: 10.1136/jnnp.71.4.441. [DOI] [PMC free article] [PubMed] [Google Scholar]
- Fischl B, Salat DH, Busa E, Albert M, Dieterich M, Haselgrove C, van der Kouwe A, Killiany R, Kennedy D, Klaveness S, Montillo A, Makris N, Rosen B, Dale AM. Whole brain segmentation: Automated labeling of neuroanatomical structures in the human brain. Neuron. 2002;33:341–355. doi: 10.1016/s0896-6273(02)00569-x. [DOI] [PubMed] [Google Scholar]
- Haller JW, Banerjee A, Christensen GE, Gado M, Joshi S, Miller MI, Sheline Y, Vannier MW, Csernansky JG. Three-dimensional hippocampal MR morphometry with high-dimensional transformation of a neuroanatomic atlas. Radiology. 1997;202:504–510. doi: 10.1148/radiology.202.2.9015081. [DOI] [PubMed] [Google Scholar]
- Hogan RE, Mark KE, Wang L, Joshi S, Miller MI, Bucholz RD. Mesial temporal sclerosis and temporal lobe epilepsy: MR imaging deformation-based segmentation of the hippocampus in five patients. Radiology. 2000;216:291–297. doi: 10.1148/radiology.216.1.r00jl41291. [DOI] [PubMed] [Google Scholar]
- Joshi SC, Miller MI, Christensen GE, Banerjee A, Coogan TA, Grenander U. Hierarchical brain mapping via a generalized dirichlet solution for mapping brain manifolds. SPIE International Symposium on Optical Science, Engineering, and Instrumentation (Vision Geometry IV); San Diego, CA. 1995. pp. 278–289. [Google Scholar]
- Khan AR, Wang L, Beg MF. FreeSurfer-initiated fully-automated subcortical brain segmentation in MRI using large deformation diffeomorphic metric mapping. Neuroimage. 2008;41:735–746. doi: 10.1016/j.neuroimage.2008.03.024. [DOI] [PMC free article] [PubMed] [Google Scholar]
- Morris JC. The clinical dementia rating (CDR): Current version and scoring rules. Neurology. 1993;43:2412–2414. doi: 10.1212/wnl.43.11.2412-a. [DOI] [PubMed] [Google Scholar]
- Morris JC, Ernesto C, Schafer K, Coats M, Leon S, Sano M, Thal LJ, Woodbury P. Clinical dementia rating training and reliability in multicenter studies: The Alzheimer’s disease cooperative study experience. Neurology. 1997;48:1508–1510. doi: 10.1212/wnl.48.6.1508. [DOI] [PubMed] [Google Scholar]
- Nyul LG, Udupa JK, Zhang X. New variants of a method of MRI scale standardization. IEEE Trans Med Imaging. 2000;19:143–150. doi: 10.1109/42.836373. [DOI] [PubMed] [Google Scholar]
- SAS Institute Inc. SAS System for Windows, V8. Cary, NC: SAS Institute Inc; 2000. [Google Scholar]
- Wang L, Swank JS, Glick IE, Gado MH, Miller MI, Morris JC, Csernansky JG. Changes in hippocampal volume and shape across time distinguish dementia of the Alzheimer type from healthy aging. Neuroimage. 2003;20:667–682. doi: 10.1016/S1053-8119(03)00361-6. [DOI] [PubMed] [Google Scholar]
- Wang L, Miller JP, Gado MH, McKeel DW, Rothermich M, Miller MI, Morris JC, Csernansky JG. Abnormalities of hippocampal surface structure in very mild dementia of the Alzheimer type. Neuroimage. 2006;30:52–60. doi: 10.1016/j.neuroimage.2005.09.017. [DOI] [PMC free article] [PubMed] [Google Scholar]
- Wang L, Lee DY, Bailey E, Hartlein JM, Gado MH, Miller MI, Black KJ. Validity of large-deformation high dimensional brain mapping of the basal ganglia in adults with Tourette syndrome. Psychiatry Res. 2007;154:181–190. doi: 10.1016/j.pscychresns.2006.08.006. [DOI] [PMC free article] [PubMed] [Google Scholar]