Abstract
We present detailed results for the motion of a finite sized gas bubble in a blood vessel. The bubble (dispersed phase) size is taken to be such as to nearly occlude the vessel. The bulk medium is treated as a shear thinning Casson fluid and contains a soluble surfactant that adsorbs and desorbs from the interface. Three different vessel sizes, corresponding to a small artery, a large arteriole, and a small arteriole, in normal humans, are considered. The hematocrit (volume fraction of RBCs) has been taken to be 0.45. For arteriolar flow, where relevant, the Fahraeus-Lindqvist effect is taken into account. Bubble motion cause temporal and spatial gradients of shear stress at the cell surface lining the vessel wall as the bubble approaches the cell, moves over it and passes it by. Rapid reversals occur in the sign of the shear stress imparted to the cell surface during this motion. Shear stress gradients together with sign reversals are associated with a recirculation vortex at the rear of the moving bubble. The presence of the surfactant reduces the level of the shear stress gradients imparted to the cell surface as compared to an equivalent surfactant-free system. Our numerical results for bubble shapes and wall shear stresses may help explain phenomena observed in experimental studies related to gas embolism, a significant problem in cardiac surgery and decompression sickness.
1 Introduction
An understanding of the motion of a gas bubble through a blood vessel is of fundamental importance in gas embolism studies related to illnesses such as decompression sickness. Gas bubbles may enter the blood stream during cardiopulmonary bypass for cardiac operations or in vascular procedures. This may also happen due to decompression from hyperbaric exposures, such as in diving or extravehicular activity during space exploration. The intravascular gas emboli may deposit into organs, like the heart or the brain, and as a result, cause permanent injury.
A gas bubble moving in a blood vessel may cause damage to the cells lining the interior wall of the vessel (endothelial cells). The mechanisms for the injury appear to be related to the shear stress level imparted and the stress reversals that occur at the cell surface during the bubble motion (Mukundakrishnan et al., 2008a). Independently, experiments in our laboratory have shown that such an injury to the cell may be mitigated by the addition of a soluble surfactant to the continuous phase (Suzuki et al., 2004). The surfactant in the blood stream appears to significantly change the dynamics of the bubble-cell interaction (Branger & Eckmann, 2002). Furthermore, a non-toxic, soluble, inert surfactant introduced into the bulk phase opportunistically adsorbs onto the gas-liquid interface and modifies the interfacial tension. This results in a change of the bubble shape and its residence time adjacent to the cell surface as compared to an equivalent surfactant-free system. The adsorbed surfactant molecules may also shield biological moieties in the blood stream from encountering the adsorptive surface. The actual mechanisms responsible for this mitigation are not understood, and in this context, an understanding of the role of the surfactant is warranted (Eckmann et al., 2006).
In earlier studies, we have experimentally and numerically investigated the motion of a bubble through a surfactant-laden Newtonian fluid and through a blood-like liquid medium (Casson fluid) without the presence of a surfactant (Cavanagh & Eckmann, 1999; Eckmann & Lomivorotov, 2003; Mukundakrishnan et al., 2007, 2008a; Zhang et al., 2006; Mukundakrishnan et al., 2009, 2008b). Here, through advanced numerical modeling, we investigate the effect of the presence of a soluble surfactant on the motion of a finite sized gas bubble in a blood vessel.
A number of numerical techniques for treating the motion of a fluid particle or bubble through a surfactant laden fluid, either soluble (Muradoglu & Tryggvason, 2008; Johnson & Borhan, 2003; Ghadiali & Gaver, 2003) or insoluble (Tsai & Miksis, 1994; Li & Pozrikidis, 1997; Yon & Pozrikidis, 1998; Eggleton et al., 1999, 2001) have been described in the literature. These are complemented by experimental studies (Rodrigue et al., 1996; Branger & Eckmann, 1999) and some analyses (Oguz & Sadhal, 1988; Park, 1992; Milliken & Leal, 1994; Rodrigue et al., 1999). The numerical methods for the study of free-surface flows include, front-tracking or immersed-boundary (Shin & Juric, 2002; Unverdi & Tryggvason, 1992; Torres & Brackbill, 2000), level set (Osher & Fedkiw, 2001; Sussman et al., 1999), phase-field (Jacqmin, 1999), volume-of-fluid (Scardovelli & Zaleski, 1999; James & Lowengrub, 2004), coupled level-set and volume-of-fluid (Sussman & Puckett, 2000), immersed interface (Lee & Leveque, 2003), ghost-fluid methods (Udaykumar et al., 2003), and moving mesh interface tracking (Quan & Schmidt, 2007). Combined experimental and numerical studies examining the rise of a bubble in a surfactant laden fluid have also been described (Palaparthi et al., 2006).
In this paper, a numerical procedure for evaluating the axisymmetric motion of a nearly occluding gas bubble (the topology of interest to the health sciences) in a surfactant laden Casson fluid in a cylindrical tube been described and implemented. The interface of the bubble is tracked using a modified front-tracking method. Flow and species discontinuities are smoothed and the surface tension force is distributed over a thin layer near the interface to become a equivalent volume force. The Navier-Stokes and continuous phase mass-transfer equations are solved on a fixed Eulerian mesh. A level contour reconstruction procedure is employed for the periodic redistribution of the front points and reconstruction of a new front. An explicit background mesh of interconnected marker points is used to represent the interface. Surface convection-diffusion equations are solved on this interface with suitable coupling to the bulk species concentrations to account for interfacial adsorption and desorption.
The properties of the bulk fluid include both the shear-thinning effects of blood as well as the Fahraeus and Fahraeus-Lindqvist effects (see Ayyaswamy (2008)), while the non-dimensional parameters associated with the surfactant have been broadly chosen from Somasundaran (2006) and Chang & Franses (1995). Results are also provided for a specific case of C12E6 whose properties are provided in Palaparthi et al. (2006). The surfactant properties, in general, are similar to those of ethoxylated surfactants and follow the Langmuir isotherm. The specific case of C12E6, however, follows the follows the Frumkin isotherm. Three different vessel sizes, corresponding to a small artery, a large arteriole, and a small arteriole, in normal humans (Fung, 1997), have been considered. The corresponding representative flow Reynolds numbers are 200, 2 and 0.2, respectively. The degree of bubble occlusion is characterized by the ratio of the equivalent-volume bubble radius to vessel radius (aspect ratio), λ, in the range 0.9≤ λ ≤ 1.05. For non-spherical bubbles, the applicable radius of the bubble is taken to be that of a spherically shaped bubble which has the same volume as the non-spherical one (equivalent-volume spherical radius). The initial bulk flow corresponds to a fully established Casson flow in a cylindrical vessel.
Bubble motion causes temporal and spatial gradients of shear stress at the cell surface lining the blood vessel wall as the bubble approaches the cell, passes over it and departs. Rapid reversals occur in the sign of the shear stress imparted to the cell surface during this motion. Shear stress gradients together with sign reversals are associated with a recirculation vortex at the rear of the bubble. Presence of the surfactant in the bulk and the interface reduces the level of the shear stresses and the strengths of the vortical motions as compared to an equivalent clean system. Furthermore, the shape of the bubble, and consequently the gap between the bubble and the vessel wall changes in the presence of the surfactant resulting in a change in the bubble residence time near the proximity of a cell surface. The net effect is to reduce the level or eliminate the mechanically driven injury to the cell surface. The model predictions concur with our experimental findings and are thought to seriously impact gas embolism studies.
The organization of this paper is as follows. The problem formulation is followed by a description of the numerical methodology. The numerical procedure is validated. Detailed computational results are described for the surfactant problem and where necessary comparisons with the clean system study are presented. The final two sections deal with the major results and the important conclusions therein.
2 Problem Formulation
The axisymmetric motion of a nearly occluding gas bubble of density ρg and viscosity μg in a cylindrical vessel of radius R (diameter d) has been considered here as shown in figure 1. For the vertical configuration of the vessel, gravity acts in the direction from top to bottom.
Figure 1.
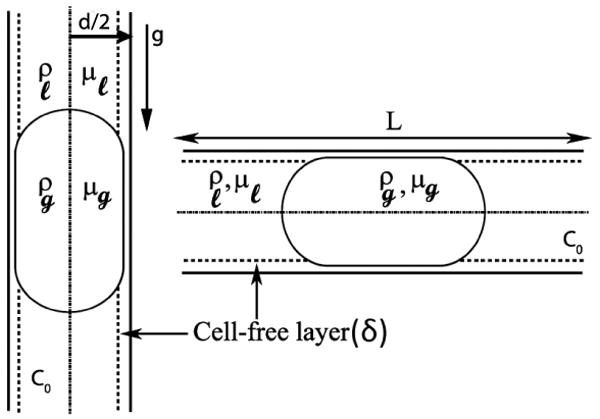
Schematic of a nearly occluding bubble in vertical and horizontal vessel configurations.
Both the gas and the liquid phases are modeled as incompressible fluids governed by the equations of motion (Tryggvason et al., 2001; Zhang et al., 2006):
| (1) |
| (2) |
Here, u ≡ (vr, vz), is the fluid velocity with vr, vz as the velocity components along the radial and axial directions, p is the pressure, ρ and μ, are the density and the viscosity of the medium (defined below), g is the gravitational acceleration (9.8 m/sec2), s is an arc length measure along the interface,  is the curvature, σ is the surface tension coefficient and is a function of the surfactant concentration Γ, S(t) denotes the instantaneous location of the interface, nf and tf are the the unit outward normal and tangential vectors on the interface, xf denotes the position vector on the interface, and δˆ(x − xf) stands for the 2D axisymmetric Dirac delta function that is non-zero only when x = xf. The integral is carried out over the entire surface to create a force on the interface. The density and viscosity of the medium are
| (3) |
| (4) |
Here, t is time, and  (r, z, t) is a Heaviside function such that,
| (5) |
The bulk liquid has been modeled as a two-layer fluid of density ρl consisting of a cylindrical core of concentrated red blood cell (RBC) suspension, surrounded by a cell-free layer. The cell-free layer is modeled as a Newtonian fluid of constant viscosity μlayer (Sharan & Popel, 2001) while the RBC suspension is modeled as a shear-thinning Casson fluid of viscosity μc (Fung, 1997). The viscosity of the liquid μl as a function of the radial position in a bubble-free tube is thus,
| (6) |
where δ is the non-dimensional thickness of the cell-free layer normalized with R. The evaluation of this thickness and the two viscosities μlayer and μc have been discussed in detail in Mukundakrishnan et al. (2008a). Following Papanastasiou (1987) and Mukundakrishnan et al. (2008a), we write,
| (7) |
where μ∞ is the asymptotic Newtonian viscosity, τy is the yield stress, γ is the prevalent local shear rate and m is the Casson viscosity regularization exponent. The viscosity of the fluid layer, μlayer, which usually varies as a function of hematocrit is a constant here. Further details on the dependence of the viscosity on the hematocrit and the tube size are given in Appendix B.
The surface tension of the interface, separating the continuous and dispersed phases, varies with the surfactant concentration, Γ, on the interface, according to the equation of state given by the Langmuir isotherm (Levich, 1962):
| (8) |
where σs is the surface tension of a surfactant-free clean interface, ℜ is the ideal gas constant, T is the absolute temperature and Γ∞ is the maximum monolayer interface surfactant concentration. The evolution of the surfactant concentration at the interface is given by Stone (1990) as,
| (9) |
with jn being the diffusional flux at the interface given by Fick's law: jn = Dl (nf · ∇) C. Also, us and u·nf are the tangential and normal components of the velocity on the interface, respectively, Ds is the surface diffusion coefficient, Dl is the bulk diffusion coefficient, C is the bulk concentration, and, ∇s = ∇ − nf(nf · ∇) is the gradient operator along the interface. The diffusional flux on the interface, Dl (nf · ∇) C, is balanced by the adsorption and desorption terms as,
| (10) |
in which ka and kd are the adsorption and desorption coefficients, respectively, and Cs is concentration in the sublayer adjacent to the interface. The governing equation for the bulk concentration C then becomes,
| (11) |
where the diffusion coefficient D may be written as.
| (12) |
These equations are coupled with suitable initial and boundary conditions. At the inlet boundary z = 0, the velocity profile is a fully developed two-layer Casson profile. This velocity profile and the associated pressure gradient have to be numerically evaluated for each vessel size using the Casson two layer model (equations 6,7) and applicable boundary conditions (see, Mukundakrishnan et al. (2008a) for details). These evaluations are based on the maximum flow velocity at the centerline of a bubble-free blood vessel of any given size (Berger et al., 1996). The velocity profile and the associated pressure gradient so calculated are used as inlet boundary conditions. In vivo experimental and clinical literature regarding multifocal arterial gas embolization as occurs in cardiac surgery and in decompression sickness indicates that bubble passage and trapping effects are important within the microcirculatory arteriolar vessels. In this size range, the pulsatility effects of the cardiac cycle on blood flow are much less predominant, so that an approximation of steady flow is reasonable. At the outlet boundary, z = L, the outflow condition,
| (13) |
is used. The reflective boundary conditions, at r = 0 are given as:
| (14) |
The wall no-slip, no flux boundary conditions at r = R are,
| (15) |
The initial surfactant concentration in the bulk is taken to be
| (16) |
3 Non-dimensionalization and time scales
Consider the non-dimensional quantities (denoted by superscripted *): s* = s/d, r* = r/d, z* = z/d, ρ* = ρ/ρl, u* = u/Umax, t* = tUmax/d,
, C* = C/C0, Γ* = Γ/Γ∞,  = d
= d and δˆ* = d3δˆ. Here, C0(mol/cm3) is the far field bulk concentration and Γ∞ (mol/cm2) is the maximum monolayer interface surfactant concentration. Recasting the governing equations 2, 9 and 11 in terms of these non-dimensional parameters (and dropping the superscript star for convenience) yields:
| (17) |
| (18) |
| (19) |
in which the relevant non-dimensional parameters are defined as, Reynolds number Re = ρUmaxd/μ, Weber number , Froude number , surface Péclet number Pes = Umaxd/Ds, desorption Stanton number Std = kdd/Umax, dimensionless adsorption depth α = Γ∞/C0d, bulk Péclet number Pe = Umaxd/Dl, and adsorption Stanton number Sta = ka/Umax. The capillary number Ca = μUmax/σ is the ratio of Re and We.
Based on these non-dimensional numbers, the important time scales relevant to this problem are: convection time scale d/Umax, momentum diffusion time scale ρd2/μ, and mass diffusion time scales d2/Dl and d2/Ds.
4 Numerical Method
Equations 1-12, subject to the appropriate initial and boundary conditions (equations 13-16) are solved using a front-tracking method coupled with a level contour reconstruction procedure. Briefly, the procedure consists of,
Given a particular interface position, and bulk and interface concentration distributions, calculate the surface tension forces and distribute them as body forces to the fixed Eulerian grid.
Solve the fluid flow equations with the given conditions to obtain the velocity and pressure fields.
Use the computed velocity field to update the interface and bulk surfactant values.
Update the position of the interface using the velocity field in a Lagrangian fashion.
Reconstruct the interface using the level contour reconstruction procedure if the bubble volume changes by more than 0.5% or periodically after every few time steps.
If the interface is reconstructed, project the surface concentration profile to the new interface in such a way as to conserve the amount of surfactant on the interface.
Repeat these steps until either steady state is reached or the bubble reaches the outlet of the computational domain.
A brief description of the procedure follows.
4.1 Surface tension force redistribution
The surface tension force, fst, acting on a segment of the interface between two points A and B can be derived from equation 2 as,
| (20) |
Following the use of the Frenet formulae for the unit vectors in the r − z plane as given in James & Lowengrub (2004), this reduces to,
| (21) |
nfr is a vector in the r direction whose length equals the r component of the normal vector, and r is the radial distance. This can then be simplified as (see Mukundakrishnan et al. (2007))
| (22) |
where, tA and tB are the tangent vectors on the interface at the points A and B, respectively, and er is the unit radial vector. To distribute these surface forces onto the fixed Eulerian grid and to avoid any numerical instabilities that may result from high surface tension forces in high density and viscosity ratio flows (Van Sint Annaland et al., 2006), a density weighted function is used. The distributed surface tension force Fst is given as,
| (23) |
where x = (iΔr, jΔz), xm = (rm, zm) is the mid-point of the interfacial segment e, ρi,j is the density at the given Eulerian grid point (i, j), and Di,j is,
| (24) |
The one-dimensional delta function in the above is numerically approximated as (Griffith & Peskin, 2005),
| (25) |
and . Here, dˆ denotes the distance from the origin of the source (the front position).
4.2 Flow solver
The unsteady mass and momentum equations are discretized using a second-order finite-difference based variable density projection method (Sussman & Puckett, 2000). The velocity, density, and viscosity are all located at cell centers. The time stepping procedure is based on the second-order Crank-Nicholson method. An intermediate velocity field is obtained using a semi-implicit viscous solver. In this, a second-order predictor-corrector method based on the unsplit Godunov method (Colella, 1990) is used to evaluate the advective terms while a standard second order central finite difference is used to evaluate the diffusion terms. For the diffusion term, the spatial distribution of viscosity is computed explicitly using the second invariant of strain rate tensor evaluated at the nth time step. Such an evaluation does not impose any additional stability criteria as noted in Radl et al. (2007). The resulting equations for the components of the intermediate velocity are solved by a multigrid method based on Red-Black Gauss-Siedel smoother (Wesseling, 1992). A projection method is invoked on the intermediate velocity to obtain the final divergence-free velocity, the details of which along with the corresponding time step restrictions for numerical stability are given in Sussman & Puckett (2000).
4.3 Surfactant concentration solver
The surfactant exchange between the bulk and the interface is modeled as occurring in a thin layer adjacent to the interface (see Muradoglu & Tryggvason (2008)). This technique is different from that described in an earlier paper by Zhang et al. (2006) wherein this exchange occurs exactly on the interface.
The interface surfactant evolution equation (9) is used to update the concentration explicitly. First the diffusion flux jn, given in equation 10, is computed in an explicit manner using the previous time step values. The computed diffusion flux is then used in equation 9 to update the interface concentration. This update is done on the Lagrangian grid. The bulk surfactant evolution equation (11), is solved on the Eulerian grid. The diffusion flux on the interface is converted to a bulk source term. This is done using a method similar to that used for the distribution of surface tension (see equation 23). The bulk source term Ji,j assumes the form
| (26) |
where Di,j (x − xm) is given by equation 24, re is the radial distance of the center of the interface element, le is the length of the element, ri,j is the radial distance of the Eulerian grid point and  is defined in equation 5. The bulk concentration is then updated explicitly using equation 11.
4.4 Interface reconstruction
The redistribution of the front points and the conservation of the bubble volume are simultaneously achieved using a level contour reconstruction procedure (Shin & Juric, 2002; Shin et al., 2005). As the bubble moves, and especially if the interface significantly deforms, it becomes necessary to recompute the front points defining the interface. Here, this is done in such a way that the final mass (volume) of the bubble, based on the calculation of a new interface, is within 0.5% of the original volume of the bubble while at the same time minimizing the deviation from the computed advected boundary (see, Mukundakrishnan et al. (2007)). Upon reconstruction, the new front points are assigned using the intersection of the computed boundary with the Eulerian grid.
4.5 Interface surfactant projection and mass conservation
Subsequent to the reconstruction of the interface, the surfactant concentration on the new front points must be recomputed to be consistent with the previous interface points. The surfactant mass on the interface Γm must be conserved. The total interface surfactant mass may be written as
| (27) |
where, r is the radial distance in a cylindrical coordinate system measured from the axis of the tube and si is the arc length to the ith node point of the interface. For any two points A and B on the old interface, the surfactant mass, spanning across multiple interface segments, is
| (28) |
Here sAB represents the arc length between the two points. Since the total length of the interface itself may change during reconstruction, the equivalent point for A on the new interface, A′, is defined by its arc length sA′0 as
| (29) |
with a corresponding interface point B′ corresponding to B. We conserve the mass locally such that
| (30) |
wherein A, B, A′ and B′ in general do not coincide with the interface points i. This is achieved by projecting the surfactant mass from each segment of the old interface into the appropriate, scaled new interface segment(s). This mass conservation will automatically satisfy the total mass conservation limit given in equation 27 to within computational accuracy, which is verified upon each projection.
5 Validation
Validation for the surfactant-free cases are given in Mukundakrishnan et al. (2007, 2008a) and will not be repeated here. We have now validated the code in the presence of the surfactant, the details of which are presented in Appendix A.
5.1 Uniqueness of the steady state interface concentration
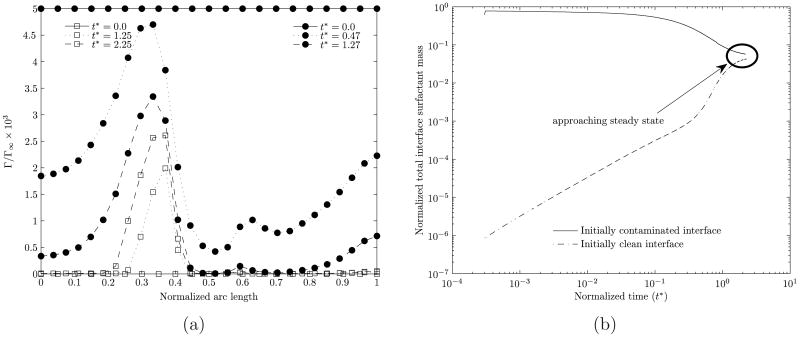
Here, we examine, for otherwise identical conditions, the time histories of an initially clean bubble and an initially contaminated bubble as they both attain steady states in the surfactant-laden bulk medium. Figures 2(a) and 2(b) show that the steady state, the interface concentrations are independent of the imposed initial conditions.
Figure 2.
Interface concentration profiles at various times for two cases starting from different initial prescribed concentrations. (a) Variation of the interface surfactant concentration for various various times. (b) Variation with time of the total interface surfactant mass. The Reynolds number is 0.2, the dimensionless adsorption depth is 4.75 and the aspect ratio is 1.05. In (a) the different symbols indicate the different starting conditions and the three different line types denote different times. The arc length along the surface of the bubble is measured from the rear stagnation point. In (b), the total interface surfactant mass is normalized with 4πa2Γ∞ where a is the equivalent-volume bubble radius.
In figure 2(a), the interface concentration profile for three different times is shown for both the cases, and with increasing time, both the profiles converge to the same profile. In figure 2(b), we observe that the total interface surfactant mass is converging to the same steady state value starting from the two different initial conditions.
The feature that the eventual steady state interface concentration is independent from the starting condition is particularly noteworthy. Our numerical experimentation has shown that the computational time to obtain the steady state starting from a clean bubble is considerably larger than that starting with an initially contaminated bubble. Where the transient history is not of concern, for computation it is therefore convenient to start with a slightly contaminated bubble, with an initial shape identical to that of a clean bubble, uniformly coated with the surfactant. This feature becomes particularly advantageous at lower Péclet numbers. In this paper, results for Re=0.2 have been developed using initially contaminated bubbles thus saving considerable computational time. The characteristics shown in figure 2(a) are further discussed in detail in section 6.1).
6 Results
Results for bubble motion in the presence of a soluble surfactant in the bulk phase have been compared with those for an equivalent clean bubble (Mukundakrishnan et al., 2008a). Fluid flow direction is from the bottom of the vertical vessel towards the top and occurs at a fixed pressure gradient. A soluble surfactant with a far-field concentration of C0 is assumed to be present in the bulk phase. The bubble rises in the vessel under the action of body forces (due to gravity) and surface forces (fluid motion), and deforms as it moves.
For all the cases considered here, excepting for the C12E6 surfactant, C0 is assumed to be the same. This leads to different values of α (see table 1). Table 1 also lists the parameter values for Ca, Pe and Sta/Std. The clean interface Ca values are provided in table 1 (Mukundakrishnan et al., 2008a). All the other properties of the surfactant, including adsorption and desorption coefficients (Ka and Kd), bulk and surface diffusion coefficients (D and Ds) and the maximum interface concentration (Γ∞ = 1.9 × 10⁻⁹ mol/cm2) are taken to be the same for all the cases considered (except C12E6). The values for the C12E6 surfactant are provided in section 6.5.
Table 1. Dimensionless adsorption depths used for the three Reynolds numbers, along with other relevant parameters.
| Re | d(μm) | Umax (cm/s) | α | Ca | Pe = Pes | Sta/Std |
|---|---|---|---|---|---|---|
| 0.2 | 40 | 1.75 | 9.5 × 10⁻⁴ | 1.225 × 10⁻³ | 1.49 × 10³ | 4.5 × 10⁻⁵ |
| 2.0 | 100 | 7.0 | 3.8 × 10⁻⁴ | 4.9 × 10⁻³ | 1.49 × 10⁴ | 1.8 × 10⁻⁵ |
| 200 | 2000 | 35.0 | 1.9 × 10⁻⁵ | 2.45 × 10⁻² | 1.49 × 10⁶ | 8.9 × 10⁻⁷ |
Three aspect ratios, λ, have been considered, and are 0.9, 1.0 and 1.05. For all the cases studied, a thin annular film is assumed to be present between the bubble and the vessel wall at bubble introduction. For λ ≥ 1.0, the initial shape of the bubble is assumed to be elongated with a hemispherical cap at each end. The shape, the velocity and the surface concentration of the bubble eventually attain steady states. In this study, we choose to discuss phenomena after the attainment of the steady state.
6.1 Flow field and Concentration Profiles
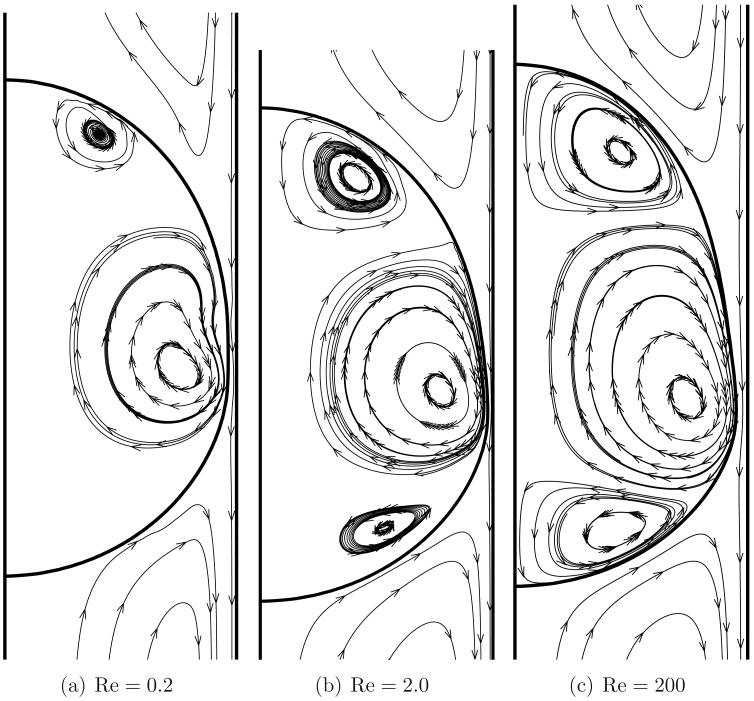
Figure 3 shows the streamlines for flow over a clean bubble in a reference frame attached to the bubble for various Reynolds numbers and λ = 1.0. The bubbles are generally deformed with a bulge at the rear primarily due to the imposed pressure gradient. At a certain location along the interface, a very narrow layer of fluid separates the bubble from the wall. This proximity of the bubble to the vessel wall is of particular interest in this problem as shall be seen later. The drainage flow squeezes through this narrow gap and is mainly responsible for the surface mobility of the bubble. This in turn gives rise to internal vortical motions. Secondary internal vortices are also noted and the vortex strengths increase at higher values of Re. The sense of rotation of the secondary vortices is opposite to that of the primary vortex. Two distinct recirculatory bolus formations may be discerned, one at the front region of the bubble and the other at the rear. Two stagnation rings, one convergent ring at the rear and the other a divergent ring at the front, exist on the bubble surface where the back flow adjacent to the wall (drainage flow) meets the recirculating boluses. For the convergent stagnation ring (zone), the streamlines move radially outward from near the axis of the tube towards this ring. For the divergent stagnation ring, the streamlines are directed inward towards the axis of the tube. More details for the clean bubble case are available in Mukundakrishnan et al. (2008a).
Figure 3.
Streamlines for flow over a clean bubble as viewed in a reference frame moving with the steady state velocity of the bubble for three representative Reynolds numbers. The aspect ratio (λ) is 1.0.
Next, we consider bubble motion in a soluble surfactant laden flow through the vessel. Upon the introduction of the bubble, diffusive and convective mechanisms in the bulk phase will bring the surfactant from the bulk medium to the gas-liquid interface. Here, adsorption and desorption mechanisms will be initiated. Although the vortical motions inside the bubble are essentially similar in their dynamic characteristics to the clean bubble case, they are considerably weaker in strength. Diffusion and advection of the adsorbed surfactant occur at the interface, the latter due to surface mobility. Consistent with the bulk concentration and interfacial capacity for adsorption and desorption of the surfactant, a steady state mass transfer profile is eventually established displaying a non-uniform distribution of the surfactant at the interface.
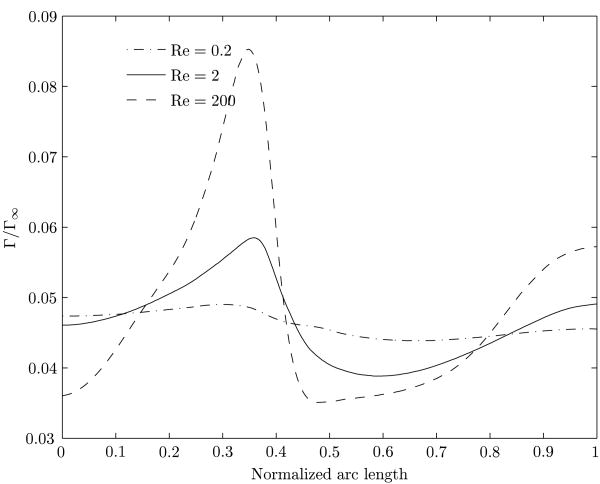
We now discuss the steady state concentration profiles at the interface. In an unbounded stationary medium containing a soluble surfactant, the motion of a gas bubble would sweep the surfactant on the interface towards the rear, and the front region will be of higher surface tension (see Sadhal et al. (1997), Chapter 3). However, for a nearly occluding bubble moving inside a circular tube, the distribution of the surfactant at the interface is complex. In figure 4, we display the steady state interface concentrations of the surfactant as a function of arc length for various Reynolds numbers. The arc length along the interface is measured starting from the trailing edge of the bubble. In view of the deformed shape of the bubble, the arc length measured is normalized with respect to the total arc length from the trailing edge to the leading edge. At every Reynolds number, the highest and the lowest surfactant concentrations on the interface occur in the vicinity of the convergent and divergent stagnation rings, respectively, accompanied by a complicated distribution elsewhere along the interface.
Figure 4.
Interface concentration for the three cases of Reynolds numbers with identical far-field concentration. The aspect ratio (λ) is 1.0. The normalized arc length along the surface of the bubble is measured from the rear stagnation point.
The attainment of the steady state concentration profiles may be explained using figure 5 which is a schematic of the streamlines inside and outside the bubble in the reference frame of the bubble. Points A and D in this figure are the rear and front points located on the axis of the bubble, respectively. Points B and C show the approximate locations of the convergent and divergent stagnation rings. Upon the introduction of the bubble, there will be increased accumulation of the surfactant in the vicinity of A relative to that near D. The prevailing interface convection will sweep the surfactant from A towards B. On the bubble front, surfactant will be swept by the incoming flow towards C. From C, interface convection moves the surfactant toward D and B. The drainage flow will sweep the surfactant deposited between B and C towards B. Thus at B, there is increased accumulation due to contributions from both A and C. The accumulation of surfactant at B and depletion at C will set up interface concentration gradients. This leads to surface diffusion (measured by the surface Péclet number Pes) which will tend to equalize the surfactant distribution. The final concentration profile is thus determined by the interplay between these various mechanisms. The surfactant boundary layer in this problem is very small compared to the bubble diameter for all three Reynolds numbers. This is consistent with the high values of bulk Péclet number, Pe (see table 1). There is negligible variation in the value of the bulk surfactant concentration level near the vessel wall. Our computations show this variation to be less than 1%.
Figure 5.

Schematic of streamlines.
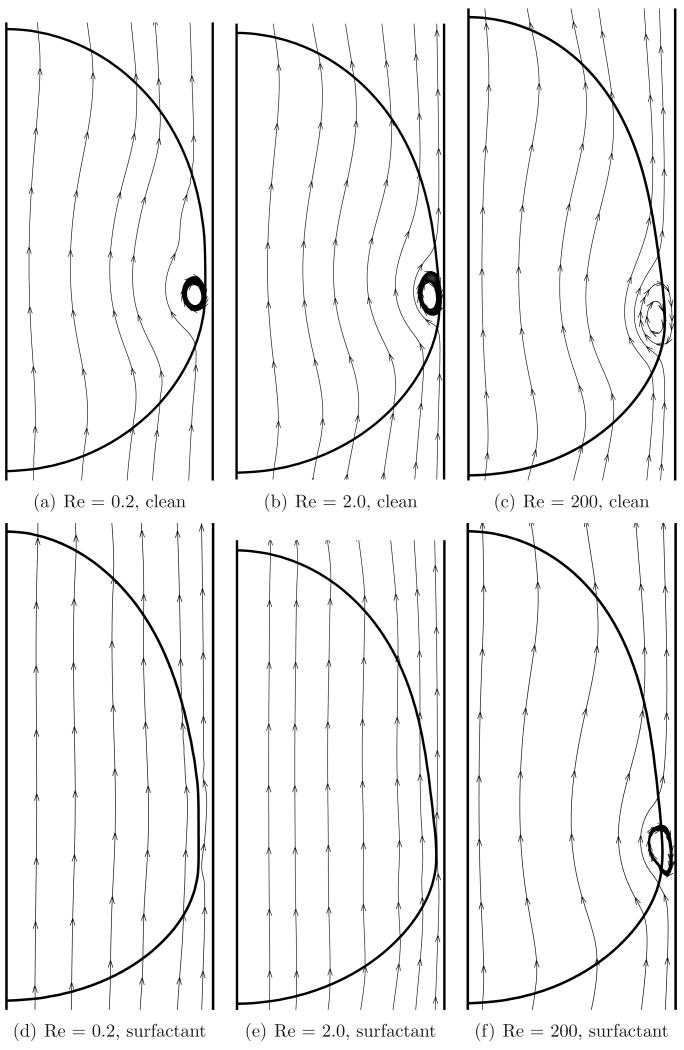
A major effect of the presence of the surfactant on the bubble surface is the reduction in surface mobility. As the bubble moves, an internal vortex is formed (somewhat similar to a Hill's spherical vortex (Happel & Brenner, 1983), or more generally a toroidal vortex). A surfactant coating changes the properties (shape and strength) of this vortex (Sadhal & Johnson, 1983; Johnson & Sadhal, 1983). The streamlines for a clean and a surfactant coated bubble as viewed in an inertial frame of reference, for λ = 1.0, are shown in figure 6 for various Reynolds numbers. Presence of the surfactant causes the recirculation vortex noted here to be weaker as evident from the increased distortion of the streamlines for the clean bubble case.
Figure 6.
Streamlines as viewed in an inertial reference frame for clean and surfactant coated bubbles. The aspect ratio (λ) is 1.0.
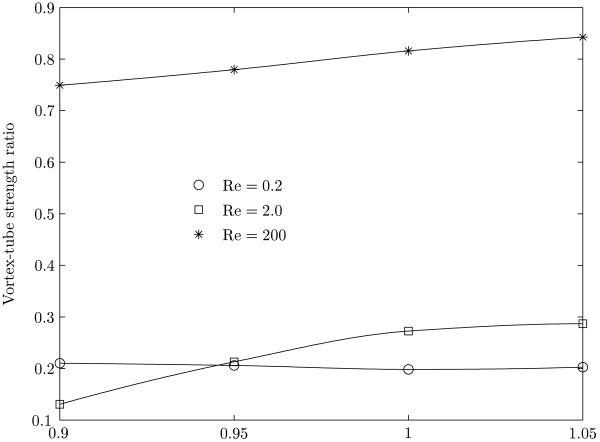
A measure of the internal circulation in the bubble is given by the strength of the vortex tube(s) (see Batchelor (1967), section 2.6), and is ∫ ωdV, where ω is the vorticity, dV is an elemental volume. The integral is carried out over the volume of the bubble. The ratio of the strengths of the vortex-tubes, between a clean and a surfactant coated bubble, is shown in figure 7 for various Reynolds numbers. The strength of the toroidal vortices present in the bubble (figure 3) decrease upon the addition of a surfactant. The reduction in vortex strength is the lowest for the largest Reynolds number considered here (200) where the inertial forces are dominant.
Figure 7.
Variation of the ratio of the vortex-tube strengths between a clean and surfactant coated bubble, as function of the aspect ratio for three Reynolds number cases.
6.2 Steady state shape
A detailed study of the steady state shapes of clean bubbles in motion has been described in Mukundakrishnan et al. (2008a). Briefly, at smaller Reynolds numbers (0.2 and 2), the capillary effects dominate over the inertial and viscous effects. For these two Reynolds numbers, for λ = 0.9, the bubble essentially remains spherical, while for λ ≥ 1.0, it nearly occludes the vessel. At the higher Reynolds number (200), inertial forces dominate. At λ = 0.9 bubbles form a flatter interface at the rear and are prolate spheroidal at the front. For λ ≥ 1.0, the bubble elongates in the axial direction due to the increased wall effects accompanying the inertial forces.
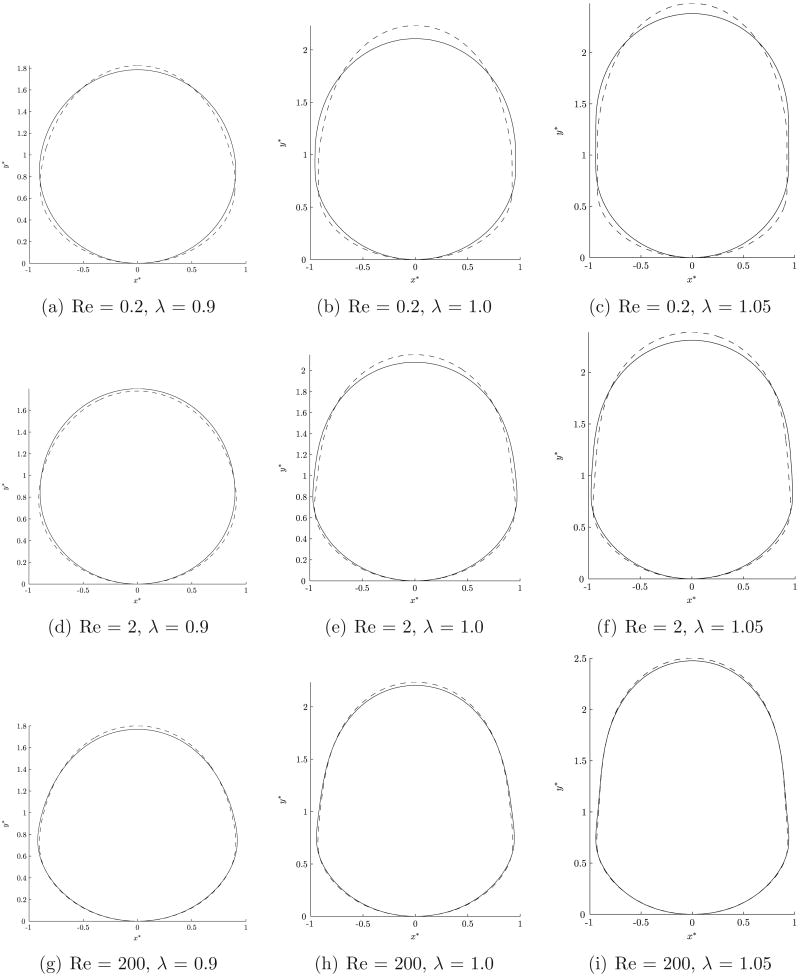
Figure 8 shows the variations in the shapes of surfactant-coated bubbles as compared to clean bubbles. There are three primary surface forces which affect the shape of the nearly occluding bubble. The first is the surface tension on the interface of the bubble and this tends to make the bubble spherical. The second is a result of the prevailing pressure gradient driving the flow. This force will tend to “flatten” the bubble in the rear causing it to be oblate spheroidal. The third force arises due to the presence of the wall. As the bubble gets closer to the wall, the drainage flow generates a force which acts to push the sides of the bubble radially inward, away from the wall causing it to elongate in the direction of its motion. The final shape of the bubble is the result of a balance of these three forces together with the body force (buoyancy). However, the body force does not play a major role in this problem, as shown later. Reduction in the value of the surface tension due to the surfactant results in increased departure from sphericity and the bubble shape is more responsive to fluid flow induced deformation forces.
Figure 8.
Comparison of the steady state shape of an occluded bubble with and without interfacial surfactants. The solid line represents the shape of the clean interface bubble, while the dotted line represents a surfactant coated bubble.
For λ = 0.9 (see figure 8(a,d,g)), a clean bubble is nearly spherical with a larger gap between the interface and the vessel wall. The forces that mainly govern the shape of the bubble are the imposed pressure force, tending to flatten the bubble at the rear and the surface tension force which acts to preserve its sphericity. Reduction in surface tension results in an oblong shape. However, for λ ≥ 1.0, for a clean bubble, all the three surface forces are significant since the bubble interface is closer to the wall. The radially inward force arising from the drainage flow becomes more important in this case because the fluid is being squeezed through a narrower gap, and this force acts to elongate the bubble in the direction of its motion resulting in an elongated oblong shaped bubble. In the presence of a surfactant, the imposed pressure force flattens the rear of the bubble further while the force due to the draining flow acts to counter this. The result is that the minimum gap between the interface and the wall actually increases.
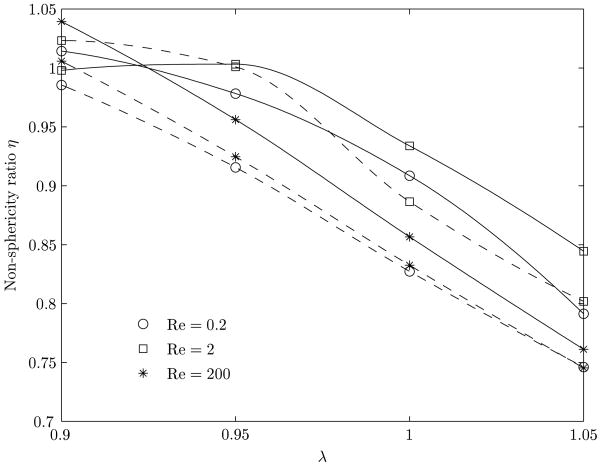
The non-sphericity index, (η), of the bubble may be defined by the ratio of twice the maximum radial extent of the bubble, as measured perpendicular from the axis of the vessel, to its axial length. For a spherical bubble, η is 1.0, although η = 1.0 does not always imply sphericity. For axially elongated bubbles, η is less than 1, while for radially flattened bubbles, η is greater than 1. Figure 9 shows the variation of η with λ, at various Reynolds numbers, for a clean and surfactant-coated bubble.
Figure 9.
Variation in the non-sphericity (η) of the bubble upon introduction of a surfactant as a function of the aspect ratio for the three different Reynolds numbers. The solid line indicates a clean bubble while the dashed line indicates a surfactant coated bubble.
From figures 8 and 9, for Reynolds number 200, the inertial forces are noted to be dominant for both the clean and the surfactant-coated bubble. The value of η decreases in the presence of the surfactant but the shape of the bubble does not change much. For Reynolds numbers 0.2 and 2 and λ ≥ 1.0, with a lowered surface tension, the wall effects become more pronounced and the interface is pushed radially inward causing a lowering of η. This indicates that the bubble has axially elongated. For λ = 0.9, η does not change appreciably. As the rear of the bubble flattens due to the imposed pressure, the gap between the bubble and the vessel wall decreases resulting in increased wall effects that counter this flattening.
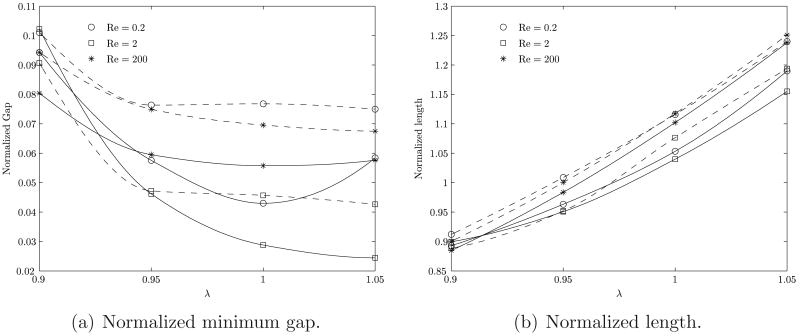
The change in bubble shape may also be evaluated in terms of the minimum gap size between the bubble and the tube wall, and the length of the bubble, as shown in figures 10(a) and 10(b), respectively. This gap will impact the flow field near the wall and the magnitude of the shear stress experienced by the cells lining the interior of the vessel wall. Thus the minimum gap size is an important parameter to be considered in the gas embolism problem. Both shear and normal stresses applied to endothelial cells are known to produce membrane stretch and induce intracellular calcium (Ca2+) signaling (Sigurdson et al., 1993; Oike et al., 1994), as is commonly observed by one of the authors (DME) in current in vitro studies of cell/bubble interactions.
Figure 10.
Variation in the normalized minimum gap and normalized length of the bubble upon introduction of a surfactant as a function of the aspect ratio for the three different Reynolds number ratios. The solid line indicates a clean bubble while the dashed line indicates a surfactant coated bubble. The gap is normalized with the vessel radius and the length is normalized with vessel diameter.
6.3 Velocity and stress variation
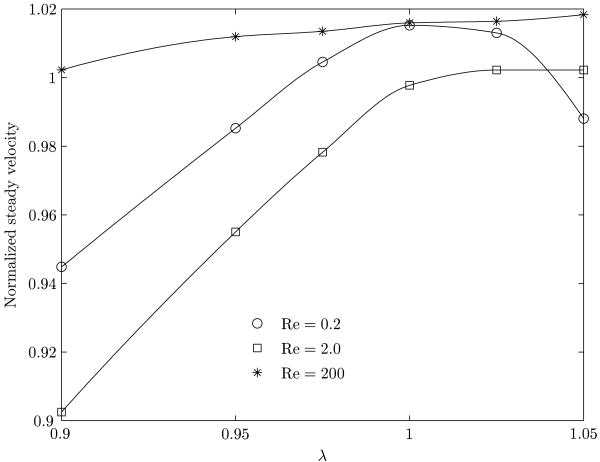
Bubble length (figure 10(b)) and its velocity determine the duration of time during which any given point located on the vessel wall will experience the effect of the bubble passing over it (bubble residence time). The variation in the steady velocity of the bubble in the presence of the surfactant is shown in figure 11. This velocity has been normalized with reference to that for a corresponding clean bubble.
Figure 11.
Normalized steady velocity of the bubble for three different Reynolds numbers as a function of aspect ratio. The normalization has been done with the velocity for a corresponding clean bubble. The clean bubble velocities (in cm/sec) for the three Reynolds numbers 0.2, 2 and 200 are 1.31, 4.5 and 20.65 respectively.
In general, a bubble moving in an infinite medium will experience increased retardation in the presence of a surfactant (Bond & Newton, 1928) primarily through the setup of tangential surface tension gradients (Marangoni forces). It will therefore move at a lower velocity compared to that of a clean bubble. In our problem of a deformed nearly occluding bubble in a confined flow, the steady state velocity will significantly dependent on its shape. For a given inlet velocity, up to λ = 1.0, the occlusion and the profile drag increase causing a reduction in the steady velocity. Beyond λ ≥ 1.0, the behavior is complicated. From figure 11, for Re = 200, the normalized bubble velocity increases, although not significantly. In the presence of the surfactant, there is very little change in shape of the bubble (form drag is reduced slightly compared to an equivalent clean bubble) at this Reynolds number (figure 9). The inertial forces dominate the Marangoni forces resulting in increased speed. For Re = 2 and λ < 1.0, the inertial forces are of the same order as viscous forces, and the Maragoni force slows down the bubble. But with increasing λ, the surfactant effect is such as to cause an elongation of the bubble in the axial direction. This increases the speed of the bubble and for λ > 1.0, the bubble moves faster than a corresponding clean bubble, although this increase in speed is small. For Re = 0.2 and λ < 0.97, viscous forces dominate. Together with Maragoni forces there is a reduction in the bubble speed. However beyond λ ∼ 0.97, bubble elongation causes the bubble to speed up relative to a clean bubble. But, for λ > 1.0 there are competing effects between the shape change at the rear of the bubble (bulging) and the elongation in the axial direction. Around λ > 1.02 the shape change at the rear is responsible for the slowing down of the bubble compared to a clean bubble.
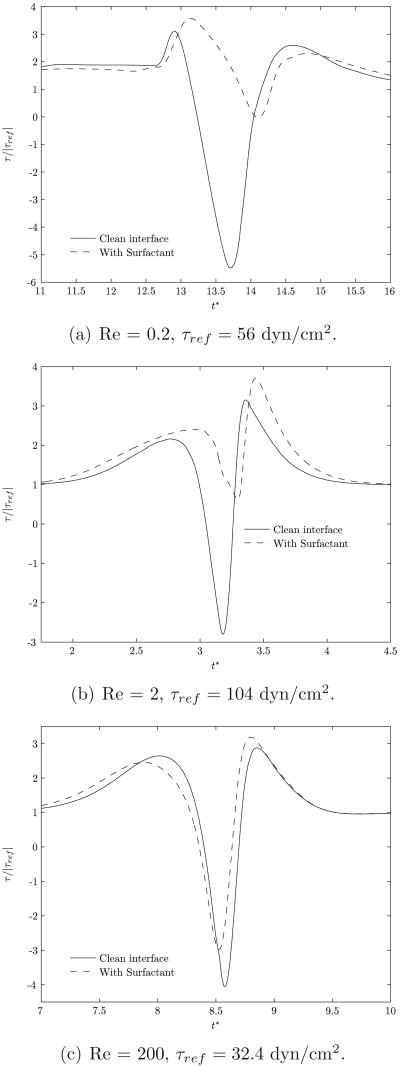
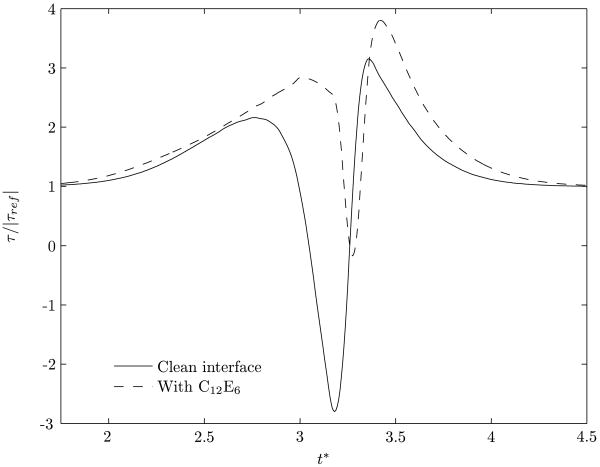
An important quantity of interest is the time variation of the shear stress τ at any given point on the vessel wall as the bubble approaches, moves over this point and departs. As the bubble moves, the entrained fluid surrounding it causes rapid changes in the magnitude and the sign of the shear stresses experienced by the wall. For a given point on the wall, the changes in shear stress manifest as a solitary wave (see Mukundakrishnan et al. (2008a) for discussions related to a clean bubble). Briefly, the shear stress variation occurs as follows. When the bubble is far upstream from the point under consideration, it has negligible effect on this point and the shear stress is at its basal value. As the bubble moves closer to the point, the local fluid velocity is increased. Both the local pressure gradient and the flow rate at the location of this point attain higher values and there is a corresponding increase in the shear stress. As the bubble moves over the point, the flow decelerates due to entrainment and the shear stress gradually reduces to zero. The local pressure gradient reverses from being favorable to adverse during this period. As the maximum bulge in the bubble passes over the point, a local flow reversal occurs due to the presence of the recirculating vortex (see figure 6). This vortex arises due to the drainage flow interacting with the forward flow. These interactive effects are ascribable due to the finite size of the bubble and the resultant physical interplay of the trailing gas-liquid interface and the presence of the wall. In particular, the sign of the shear stress becomes negative. Beyond this, as the maximum bulge of the bubble departs the location, there is fluid flow recovery and a significant increase in local fluid velocity in the direction of motion of the bubble. This causes the shear stress to become positive and attain a value higher than its basal value. As the bubble moves farther away from the point, the entrainment effects become progressively weaker and the shear stress gradually returns to the basal value staying there for the remainder of the motion of the bubble. This solitary wave has major potential physiological implications including induction of a complex pattern of endothelial cell membrane stretch and compression, activation of mechanotransduction pathways, loss of plasma membrane integrity and plasma membrane stress failure (Vlahakis & Hubmayr, 2000; Butler et al., 2001; Huang et al., 2004; McNeil & Steinhardt, 1997; Mendez et al., 2004).
A comparison of the shear stresses experienced by a point on the vessel wall, for clean and surfactant-coated bubble motions, is shown in figure 12. The shear stress is normalized with the corresponding base value, τref. As seen in figure 6, the recirculating vortex is significantly weakened by the presence of the surfactant. As a result the variations in shear stresses, although following a behavior similar to that for a clean bubble, are considerably lowered in magnitude. In figure 12, only the duration of time where there is significant deviation in the stress from its basal value is displayed, and this period corresponds to the motion of the bubble over the point. The effect of the surfactant is more pronounced at the lower two values of Reynolds numbers (0.2 and 2), while for Re=200, the profile of the solitary wave does not change much from that for a corresponding clean bubble. This can be explained by noting that a decrease in Reynolds number corresponds to a decrease in the surface mobility of the bubble. In turn, the recirculating vortex that is primarily responsible for causing the stress reversals is also weaker. Furthermore, as previously discussed, for λ ≥ 1.0, the presence of the surfactant increases the minimum gap size between the bubble interface and the vessel wall. This increase in the minimum gap size is more pronounced at lower Reynolds numbers (see figure 10(a)) resulting in reduced shear stress variations. The presence of the surfactant will therefore have predominant effects at lower Reynolds numbers.
Figure 12.
Variation of shear stress at a point on the vessel wall as the bubble passes over it. The normalization of the shear stress is done with the corresponding basal value. λ is 1.0.
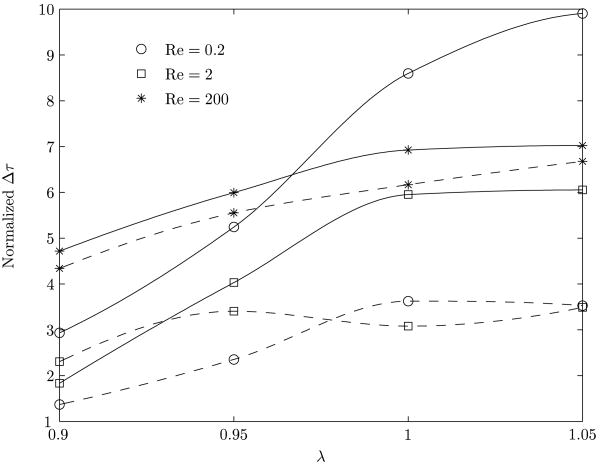
In figure 13, the jump in the value of the shear stress, Δτ = τmax − τmin, has been plotted as a function of λ for various Reynolds numbers. The corresponding clean bubble results are also given for comparison. The value of Δτ is an index of the magnitude of the shear stress change to which the luminal endothelial cell surface is subjected. The time rate of change of Δτ is a measure of the impulse character of the solitary wave as it traverses the cell surface. Together they provide a mechanism for cell injury by rapid bidirectional stretching of the cell surface. In vivo observations of surfactants attenuating gas embolism-associated impairment of vessel tone regulatory function mediated by endothelial cells have been recorded (Branger & Eckmann, 2002). It may be seen from the figure that the decrease in the value of Δτ is more pronounced for Re = 0.2 and λ > 1.0. This confirms observations from figure 12. The reduction in the value of Δτ is due both to the weakening of the recirculation vortex (figure 6) and the change in shape of the bubble (figure 8). At lower Reynolds numbers, in the presence of a surfactant, bubbles with λ ≥ 1.0 tend to be farther away from the proximity to vessel wall compared to a corresponding clean bubble (figure 10(a)). As a result, there is a reduction of the bubble effect on the wall. The protective surfactant effects to reduce cellular injury or death have occurred in vessels of a size corresponding to lower Reynolds numbers, as predicted here.
Figure 13.
Variation of the difference between the maximum and minimum shear stress experienced by a point on the vessel wall. The normalization of the shear stress is done with the corresponding base value. The solid line represents the clean interface and the dashed line represents the surfactant coated interface.
6.4 Comparison with horizontal configuration
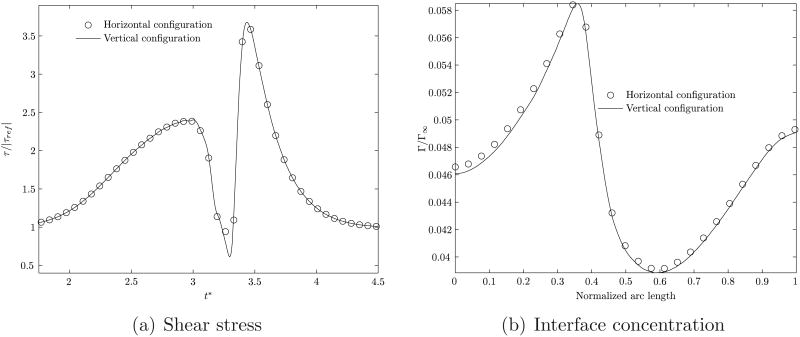
Thus far we have reported on the motion of a bubble in a vertical tube. In this section a comparison is provided with the results for a bubble moving under identical conditions in a horizontal tube. The representative Reynolds number is take to be 2 and the aspect ratio λ = 1.0. The comparisons for the shear stress level and the interface concentration are shown in figure 14.
Figure 14.
Comparison of the shear stress level and interfacial surfactant concentration profiles between a horizontal and vertical tube. The flow Reynolds number is 2.0 and the aspect ratio is 1.0. The Froude number is ∼0.71.
The results for the steady velocity of the bubble, the flow patterns and shear stress levels from the horizontal configuration are nearly identical to those for the vertical geometry. This confirms that at the levels of pressure drops considered for the forced flow, buoyancy effects are negligible in this problem.
6.5 Comparison with C12E6 surfactant
The properties of the surfactant stated in table 1 have been chosen from a broad range of ethoxyl group surfactants given in Chang & Franses (1995). In order to demonstrate the validity of our results with a different surfactant, we now simulate the motion of a bubble in the presence of hexaethylene glycol dodecyl ether (C12E6). From Palaparthi et al. (2006), we have obtained the relevant parameter values for the surfactant C12E6 and carried out the simulation for Re=2. All surfactant properties, except for the diffusivity (which will be higher in blood than in glycerol-water mixture), are assumed to be identical to those obtained for the 70:30 glycerol-water mixture listed therein. In this simulation, C0 is 0.2 mol/m3 (this is assumed to be less than the critical micelle concentration, reported as 0.209 mol/m3 in Palaparthi et al. (2006)), Γ∞ is 5 × 10⁻⁶ mol/m2, both Dl and Ds are 1.3 × 10⁻¹⁰ m2/sec (this value is from Chang & Pranses (1995)), Kd is 9 × 10⁻³ sec−1 and Ka is 5 × 10⁻⁵ m/sec−1. The equation of state for this surfactant is the Frumkin isotherm (in contrast to the Langmuir isotherm used thus far) and is given by
| (31) |
where ξ is the Frumkin interaction parameter and is set as 5.47 in our simulation (Palaparthi et al., 2006). A comparison of the shear stress experienced by a point on the vessel wall, with and without the presence of the surfactant C12E6, is shown in figure 15.
Figure 15.
Variation of shear stress at a point on the vessel wall as the bubble passes over it with and without the presence of the surfactant C12E6. The normalization of the shear stress is done with the corresponding basal value. λ = 1.0 and Re = 2.
The characteristics displayed in displayed in figure 15 show that the predictions follow the same trends that are observed with other surfactants, although there is a quantitative difference (compared with figure 12(b)). This gives us confidence in the validity of our results.
6.6 Surfactant concentration effect
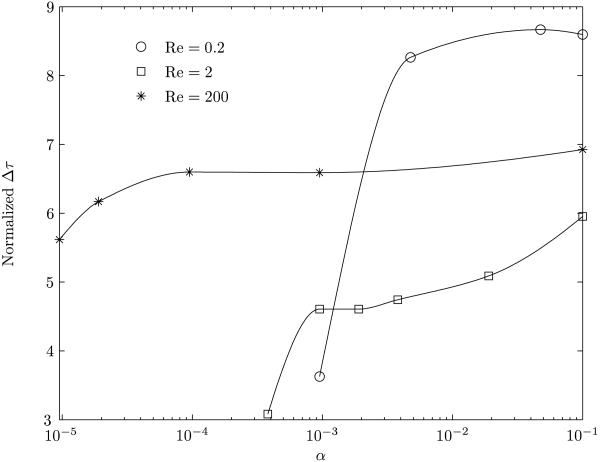
Thus far, we have examined bubble motion at a given far-field bulk surfactant concentration level. This has helped us to delineate the role of the surfactant on the bubble motion and to compare the results with an equivalent clean bubble case. The comparisons have shown that the presence of the surfactant helps in lowering the shear stress level imparted to the endothelial cell surface and prevent or minimize injury. However it is important to examine the behavior of differing bulk concentration levels of the surfactant in order to identify the most suitable concentration for application purposes. Towards this objective, we are embarked upon a systematic study of various concentration levels in the bulk phase. Herein we provide an illustrative result in figure 16 that shows the variation of the difference between the maximum and minimum shear stresses experienced by a point on the vessel wall for the three different Reynolds numbers, as a function of the dimensionless adsorption depths α.
Figure 16.
Variation of the difference between the maximum and minimum shear stress experienced by a point on the vessel wall for different values of the dimensionless adsorption depths. The normalization of the shear stress is done with the corresponding base value. The aspect ratio is fixed at 1.0.
At a given Re, an increase in α denotes a decrease in C0, the bulk concentration of the surfactant. Δτ is noted to decrease with increasing C0, and this indicates that the shear stress levels are increasingly attenuated at larger C0 values. The recirculation vortex strengths decrease with C0. Therefore higher levels of C0 would be preferable from cell injury view point although other effects such as toxicity may have to be considered. In Swaminathan et al. (2009), a more detailed study will be presented.
7 Conclusions
A numerical method for the evaluation of the axisymmetric motion of a finite sized, nearly occluding gas bubble in a blood vessel containing a soluble surfactant in the bulk medium has been described and implemented. Convective and diffusive mechanisms, both in the bulk medium and on the interface, have been considered. The surfactant adsorbs on to and desorbs from the interface as governed by interfacial thermodynamics. The effect of the presence of the surfactant in the bulk medium on the motion of the bubble has been systematically examined by comparing the characteristics of the results with those for an equivalent surfactant-free clean bubble motion. This comparison allows for a better understanding of exogenous surfactant-based intervention of gas embolism. The main observations include:
Multiple intravital microscopy studies (Branger & Eckmann, 2002, 1999; Eckmann & Lomivorotov, 2003; Eckmann et al., 2005) have shown that microvascular gas embolism bubbles deposit with an elongated sausage-shaped geometry (i.e., λ > 1) into blood vessels. We have shown that all the three surface forces are significant with this configuration, especially for clean bubbles close to the wall. A major resultant effect is the propagation of a shear stress solitary wave along the wall caused by the bubble, bulk fluid and interfacial motion. In vivo, this spatially and temporally varying shear stress wave is likely responsible for having induced the injurious or lethal membrane stretch of endothelial cells lining the vasculature observed during in vivo experiments of gas embolism (Eckmann & Armstead, 2006) and is consistent with other membrane stretch mechanisms of cell death (Liu et al., 2002; McKinney et al., 1996). We have herein demonstrated that the presence of a surfactant dramatically and beneficially alters the shear stress, yielding an important cellular mechanoprotective influence that may have a substantial clinical role in the prevention of gas embolism related tissue injury, a significant problem in cardiac surgery and decompression sickness.
The surfactant is shown to opportunistically adsorb onto the gas-liquid interface. This modifies the interfacial tension resulting in a change of the bubble shape and its residence time adjacent to the cell surface. Residence time of the bubble adjacent to an endothelial cell is a critical quantity in gas embolism. Experimental studies have shown that this time determines cell response.
The pressure driven flow causes the bubble to deform with a bulge at the rear. A drainage flow squeezes through the narrow gap between the bubble and the wall. This flow is primarily responsible for the surface mobility of the bubble and vortical motions. We have shown that the strengths of the recirculation and of the vortical motions are reduced by the presence of the surfactant.
For a given bulk concentration level of the surfactant chosen here, the effect of the surfactant is shown to be most prominent in the small arteriole, followed by the large arteriole and is least for the small artery.
Acknowledgments
This work was sponsored by the Office of Naval Research Grant No. N00014-08-1-0436. NIH Grant No. R01-HL067986 and NASA Grant No. N00014-08-1-0436. The authors also thank one of the reviewers for helpful insights.
Appendix A Validation
A.1 Interface diffusion
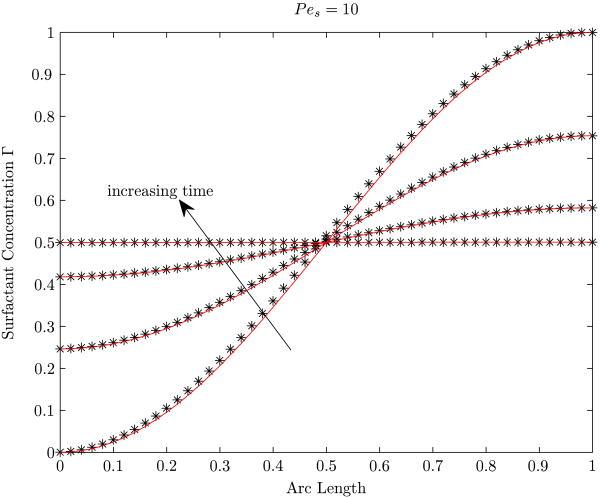
The first validation involves the role of the diffusive terms in the surfactant concentration equation at the interface (equation 9). The algorithm is tested for a stationary spherical bubble with only the interface diffusion term enabled. Initially, a prescribed variation in the distribution of the interface concentration given by
| (32) |
is assumed. This surfactant is insoluble. The bubble is assumed to be in an infinite medium (bounding walls are set to be very far away from the bubble). The interface has no additional source term. The interface concentration is then evaluated as a function of time. The number of grid points along the interface and time step restrictions are chosen as in Zhang et al. (2006). An analytical solution to this problem is given in James & Lowengrub (2004) as
| (33) |
where, for this comparison we define Pes = Ua/Ds as the surface Péclet number, t* = tU/a is the non-dimensional time scale, U is a velocity scale, and a is the radius of the bubble. A comparison of the analytical solution with the present numerical results is displayed in figure 17. Our numerical prediction agrees well with the analytical solution in this case.
Figure 17.
Concentration on the interface of a spherical bubble, with an initial surfactant distribution, placed in an infinite medium, for various times. The four lines correspond to t* = 0, 3.9, 9.0 and 34. The solid line corresponds to the analytical solution and the “*” symbols correspond to our numerical results.
A.2 Bulk diffusion and mass transfer
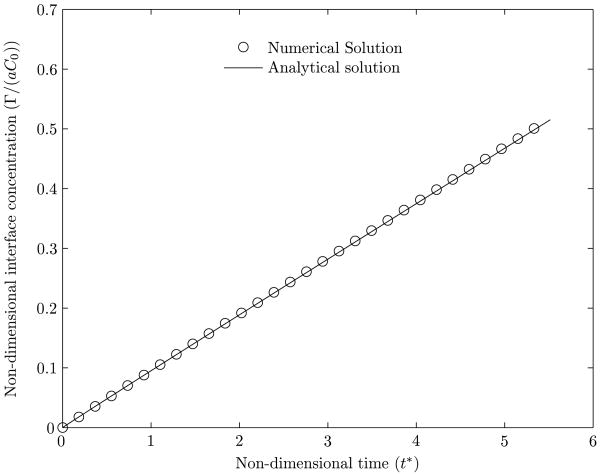
The next validation considers an initially clean bubble of radius a, placed in a stationary medium with a uniform soluble surfactant concentration C0. The interface concentration Γ as a function of time t for a given diffusion coefficient Ds is calculated. The analytical solution to this problem is given in Muradoglu & Tryggvason (2008) as,
| (34) |
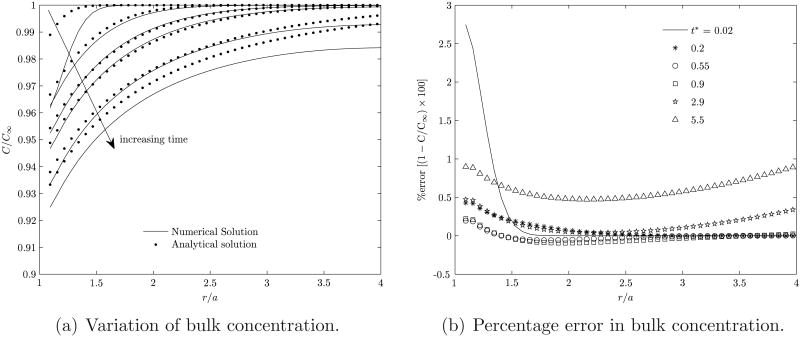
where ka is the adsorption coefficient, ω = ka/Ds, and . The desorption coefficient is set equal to zero. The comparison between the analytical result and the present numerical computation is shown in figure 18. Figure 19(a) shows a comparison between the analytical and numerical values of the concentration of the surfactant in the bulk as a function of the distance from the center, r, of the bubble, for various times. The higher curves correspond to shorter times. Figure 19(b) shows the percentage error in the computation of the bulk surfactant concentration for various times. It can be noted from figures 18, 19(a) and 19(b) that the numerical predictions compare very well with the analytical solution for the grid sizes employed.
Figure 18.
Interface concentration as a function of time for an initially clean bubble placed in a bulk medium with uniform initial surfactant concentration. The analytical result is from Muradoglu & Tryggvason (2008).
Figure 19.
Variation of bulk concentration as a function of distance from the center of the particle and the percentage error compared compared to the analytical results. The analytical result is from Muradoglu & Tryggvason (2008). The six non-dimensional times plotted here correspond to t* = 0.02, 0.2, 0.55, 0.9, 2.9 and 5.5.
A.3 Marangoni effects
To test for the Marangoni effect, we consider a bubble that is initially covered with a non-uniformly distributed insoluble surfactant with an interface concentration Γ given by,
| (35) |
where z is the axial coordinate, Γ∞ is a reference concentration, and L is the length of the tube. The bubble has a radius a and is placed axi-symmetrically in the tube of radius R = 5a and length L = 15a. Initially, the bubble and the bulk medium are quiescent. The motion of the bubble is therefore solely due to Marangoni stresses. This example is derived from the thermocapillary migration study of a viscous drop by Young et al. (1959). A linear equation of state, relating the surface tension σ with Γ, Γ∞, the surface tension of the clean interface σs and an elasticity number βs of the form,
| (36) |
is employed. The steady terminal velocity of the drop is given by Young et al. (1959) as:
| (37) |
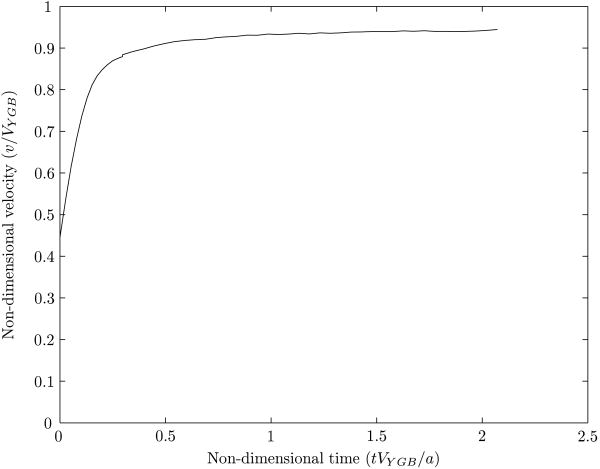
With ρ0 = ρd = 0.2, μ0 = μd = 0.1, a = 0.5 and βs = 2.0, the comparison of the terminal velocity of the drop with the theoretical result is shown in figure 20. This plot shows the velocity approaching the theoretical result (v/VYGB = 1). The small difference at the end may be attributed to the bounding wall present in our simulation.
Figure 20.
Prediction for non-dimensional terminal velocity of a bubble motion purely driven by Maragoni forces.
A.4 Buoyancy driven rising bubble
The results for an axisymmetric bubble rising in a cylindrical tube, in the presence of a surfactant, due to buoyancy has been computed by Muradoglu & Tryggvason (2008). Here we show a comparison between our computations and their results. The values for the various parameters used in this comparison are derived from figure 21 in Muradoglu & Tryggvason (2008) and are: ρg/ρl = 0.1, μg/μl = 0.025, Pe = 100, Pes = 100, kaC0/kd = 1, Γ∞/C0d = 0.2, ℜTΓ∞/σs = 0.5, Δρgd/σs = 10 and . The tube diameter is 5d and the length is 30d. The bubble is initially clean and spherical. Under these conditions, the contaminated bubble deforms strongly. Bubble shapes for various times, are shown in figure 21 and match well with their results.
Figure 21.
Shape of an axisymmetric bubble rising in a tube. The length scale for each of these times is not identical.
Appendix B Casson model
In equation 7, the expressions for μ∞ and τy as functions of core hematocrit HC are given in Das et al. (2000) as:
| (38) |
Here, C1, C2 are constants whose values for human blood are given as 2.0 and 0.3315, respectively. The evaluations of the equations require a knowledge of HC, δ, and β. In regard to the hematocrit, the discharge hematocrit HD is usually a known quantity (taken as 0.45 here). For δ > 0, the core hematocrit HC, which is based upon the core volume, is larger than HD. For a given vessel size, the relationships between HD, HC, δ, and β are nonlinear. For vessels of diameter in the range 20μm ≤ d ≤ 300μm, Sharan & Popel (2001) have described methods that are based on non-linear coupled differential equations supplemented by experimental data. These methods establish relationships between HD, HC, δ, and β for known values of d and HD. We have previously solved these equations for d = 40μm (small arteriole) and 100μm (large arteriole) for HD = 0.45, (Mukundakrishnan et al., 2008a) and have documented values for HC, δ, and β. In Mukundakrishnan et al. (2008a), we have also examined a vessel size d = 2000μm (small artery). At such a large radius, δ → 0 and HC ∼ HD.
References
- Ayyaswamy PS. Introduction to Biofluid Mechanics. In: Kundu PK, Cohen Ira M, editors. Fluid Mechanics. Fourth. chap. 17. Massachussets, USA: Academic Press; 2008. pp. 765–840. [Google Scholar]
- Batchelor GK. An Introduction to Fluid Mechanics. Cambridge University Press; 1967. [Google Scholar]
- Berger SA, Goldsmith W, Lewis ER. Introduction to Bioengineering. New York, USA: Oxford University Press; 1996. [Google Scholar]
- Bond WN, Newton DA. Bubbles, drops and stokes' law (paper 2) Phil Mag. 1928;5:794–800. [Google Scholar]
- Branger AB, Eckmann DM. Theoretical and experimental intravascular gas embolism absorption dynamics. Journal of Applied Physiology. 1999;87:1287–1295. doi: 10.1152/jappl.1999.87.4.1287. [DOI] [PubMed] [Google Scholar]
- Branger AB, Eckmann DM. Accelerated arteriolar gas embolism reabsorption by an exogenous surfactant. Anesthesiology. 2002;96(4):971–979. doi: 10.1097/00000542-200204000-00027. [DOI] [PubMed] [Google Scholar]
- Butler PJ, Tsou TC, Li JYS, Usami S, Chien S. Rate sensitivity of shear-induced changes in the lateral diffusion of endothelial cell membrane lipids: a role for membrane perturbation in shear-induced mapk activation. Faseb Journal. 2001;15:216–218. doi: 10.1096/fj.01-0434fje. [DOI] [PubMed] [Google Scholar]
- Cavanagh DP, Eckmann DM. Interfacial dynamics of stationary gas bubbles in flows in inclined tubes. Journal of Fluid Mechanics. 1999;398:225–244. [Google Scholar]
- Chang CH, Franses EI. Adsorption dynamics of surfactants at the air/water interface: a critical review of mathematical models, data, and mechanisms. Colloids Surfaces A: Physicochem Eng Aspects. 1995;100:1–45. [Google Scholar]
- Colella P. A multidimensional second order godunov scheme for conservation laws. Journal of Computational Physics. 1990;87:171. [Google Scholar]
- Das B, Johnson PC, Popel AS. Computational fluid dynamic studies of leukocyte adhesion effects on non-Newtonian blood flow through microvessels. Biorheology. 2000;37(3):239–258. [PubMed] [Google Scholar]
- Eckmann David M, Armstead Stephen CBS. Influence of endothelial glycocalyx degradation and surfactants on air embolism adhesion. Anesthesiology. 2006;105(6):1220–1227. doi: 10.1097/00000542-200612000-00022. [DOI] [PubMed] [Google Scholar]
- Eckmann DM, Kobayashi S, Li M. Microvascular embolization following polidocanol microfoam sclerosant administration. Dermatologic Surgery. 2005;31(5):636–643. doi: 10.1111/j.1524-4725.2005.31605. [DOI] [PubMed] [Google Scholar]
- Eckmann DM, Lomivorotov VN. Microvascular gas embolization clearance following perfluorocarbon administration. Journal of Applied Physiology. 2003;94:860–868. doi: 10.1152/japplphysiol.00719.2002. [DOI] [PubMed] [Google Scholar]
- Eckmann DM, Zhang Jie, Lampe Joshua, Ayyaswamy PS. Gas embolism and surfactant-based intervention. Annals of the New York Academy of Sciences. 2006;1077:256–269. doi: 10.1196/annals.1362.039. [DOI] [PubMed] [Google Scholar]
- Eggleton CD, Pawar YP, Stebe KJ. Insoluble surfactant on a drop in an extension flow: a generalization of the stagnated surface limit to deformable interfaces. Journal of Fluid Mechanics. 1999;385:79–99. [Google Scholar]
- Eggleton CD, Tsai TM, Stebe KJ. Tip streaming from a drop in the presence of surfactants. Physical Review Letters. 2001;87(4) doi: 10.1103/PhysRevLett.87.048302. Art. No. 048302. [DOI] [PubMed] [Google Scholar]
- Fung YC. Biomechanics: Circulation. New York, USA: Springer-Verlag; 1997. [Google Scholar]
- Ghadiali SN, Gaver DP. The influence of non-equilibrium surfactant dynamics on the flow of a semi-infinite bubble in a rigid cylindrical capillary tube. Journal of Fluid Mechanics. 2003;478:165–196. [Google Scholar]
- Griffith BE, Peskin CS. On the order of accuracy of the immersed boundary method: Higher order convergencerates for sufficiently smooth problems. Journal of Computational Physics. 2005;208:75–105. [Google Scholar]
- Happel J, Brenner H. Low Reynolds number hydrodynamics. Martinus Nijhoff; 1983. [Google Scholar]
- Huang HD, Kamm RD, Lee RT. Cell mechanics and mechanotransduction: pathways, probes, and physiology. American Journal of Physiology-Cell Physiology. 2004;287:C1–C11. doi: 10.1152/ajpcell.00559.2003. [DOI] [PubMed] [Google Scholar]
- Jacqmin D. Calculation of two-phase Navier-Stokes flows using phase-field modeling. Journal of Computational Physics. 1999;55:96. [Google Scholar]
- James AJ, Lowengrub J. A surfactant-conserving volume-of-fluid method for interfacial flows withinsoluble surfactant. Journal of Computational Physics. 2004;201:685–722. [Google Scholar]
- Johnson Robert A, Borhan Ali. Pressure-driven motion of surfactant-laden drops through cylindrical capillaries: effect of surfactant solubility. Journal of Colloid and Interface Science. 2003;261:529–541. doi: 10.1016/S0021-9797(03)00031-6. [DOI] [PubMed] [Google Scholar]
- Johnson RE, Sadhal SS. Stokes flow past bubbles and drops partially coated with thin films. part 2. thin films with internal circulation - a perturbation solution. Journal of Fluid Mechanics. 1983;132:295–318. [Google Scholar]
- Lee L, Leveque R. An immmersed interface method for incompressible Navier-Stokes equations. SIAM Journal of Scientific Computing. 2003;25:832. [Google Scholar]
- Levich VG. Physicochemical Hydrodynamics. Prentice Hall; 1962. [Google Scholar]
- Li XF, Pozrikidis C. The effect of surfactant on drop deformation and on the rheology of dilute emulsion in stokes flow. Journal of Fluid Mechanics. 1997;341:165–194. [Google Scholar]
- Liu SQ, Ruan YY, Tang D, Li YC, Goldman J, Zhong L. A possible role of initial cell death due to mechanical stretch in the regulation of subsequent cell proliferation in experimental vein grafts. Biomechanics and Modeling in Mechanobiology. 2002;1(1):17–27. doi: 10.1007/s10237-002-0003-2. [DOI] [PubMed] [Google Scholar]
- McKinney JS, Willoughby KA, Liang S, Ellis EF. Stretch-Induced Injury of Cultured Neuronal, Glial, and Endothelial Cells : Effect of Polyethylene GlycolConjugated Superoxide Dismutase. Stroke. 1996;27(5):934–940. doi: 10.1161/01.str.27.5.934. [DOI] [PubMed] [Google Scholar]
- McNeil PL, Steinhardt RA. Loss, restoration, and maintenance of plasma membrane integrity. Journal of Cell Biology. 1997;137:1–4. doi: 10.1083/jcb.137.1.1. [DOI] [PMC free article] [PubMed] [Google Scholar]
- Mendez JL, Rickman OB, Hubmayr RD. Plasma membrane stress failure in ventilator-injured lungs - a hypothesis about osmoregulation and the pharmacologic protection of the lungs against deformation. Biology of the Neonate. 2004;85:290–292. doi: 10.1159/000078170. [DOI] [PubMed] [Google Scholar]
- Milliken WJ, Leal LG. The influence of surfactant on the deformation and breakup of a viscous drop. Journal of Colloid and Interface Science. 1994;166:275–285. [Google Scholar]
- Mukundakrishnan K, Ayyaswamy PS, Eckmann DM. Finite-sized gas bubble motion in a blood vessel: Non-newtonian effects. Physical Review E. 2008a;78:1–15. doi: 10.1103/PhysRevE.78.036303. 036303. [DOI] [PMC free article] [PubMed] [Google Scholar]
- Mukundakrishnan K, Ayyaswamy PS, Eckmann DM. Bubble motion in a blood vessel: Shear stress induced endothelial cell injury. Journal of Biomechanical Engineering. 2009;131(7):074516. doi: 10.1115/1.3153310. [DOI] [PubMed] [Google Scholar]
- Mukundakrishnan K, Eckmann DM, Ayyaswamy PS. Bubble motion through a generalized power-law fluid flowing in a vertical tube. Annals of the New York Academy of Sciences. 2008b;1161:256–267. doi: 10.1111/j.1749-6632.2009.04089.x. [DOI] [PMC free article] [PubMed] [Google Scholar]
- Mukundakrishnan K, Quan S, Eckmann DM, Ayyaswamy PS. Numerical study of wall effects on buoyant gas-bubble rise in a liquid-filled finite cylinder. Physical Review E. 2007;76:1–15. doi: 10.1103/PhysRevE.76.036308. 036308. [DOI] [PMC free article] [PubMed] [Google Scholar]
- Muradoglu Metin, Tryggvason Gretar. A front-tracking method for computation of interfacial flows with soluble surfactants. Journal of Computational Physics. 2008;227:2238–2262. [Google Scholar]
- Oguz HN, Sadhal SS. Effects of soluble and insoluble surfactants on the motion of drops. Journal of Fluid Mechanics. 1988;194:563–579. [Google Scholar]
- Oike M, Droogmans G, Nilius B. Mechanosensitive Ca2+ transients in endothelial cells from human umbilical vein. Proceedings of the National Academy of Sciences of the United States of America. 1994;91(8):2940–2944. doi: 10.1073/pnas.91.8.2940. [DOI] [PMC free article] [PubMed] [Google Scholar]
- Osher S, Fedkiw R. Level set methods: an overview and some recent results. Journal of Computational Physics. 2001;169:463. [Google Scholar]
- Palaparthi R, Papageorgiou DT, Maldarelli C. Theory and experiments on the stagnant cap regime in the motion of spherical surfactant-laden bubbles. Journal of Fluid Mechanics. 2006;559:1–44. [Google Scholar]
- Papanastasiou TC. Flows of materials with yield. Journal of Rheology. 1987;31(5):385–404. [Google Scholar]
- Park CW. Influence of soluble surfactant on the motion of a finite bubble in a capillary tube. Phys Fluids A. 1992;4(11):2335–2347. [Google Scholar]
- Quan S, Schmidt DP. A moving mesh interface tracking method for 3d incompressible two-phase flows. Journal of Computational Physics. 2007;221:761–780. [Google Scholar]
- Radl S, Tryggvason G, Khinast JG. Flow and mass transfer of fully resolved bubbles in non-Newtonian fluids. AIChE Journal. 2007;53:1861–1878. [Google Scholar]
- Rodrigue D, De Kee D, Chan Man Fong CF. An experimental study of the effect of surfactants on the free rise velocity of gas bubbles. Journal of Non-Newtonian Fluid Mechanics. 1996;66(3):213–232. [Google Scholar]
- Rodrigue D, De Kee D, Chan Man Fong CF, Yao J. The slow motion of a single gas bubble in a non-newtonian fluid containing surfactants. Journal of non-Newtonian Fluid Mechanics. 1999;86:211–227. [Google Scholar]
- Sadhal SS, Ayyaswamy PS, Chung JN. Transport phenomena with drops and bubbles. New York, USA: Springer-Verlag; 1997. [Google Scholar]
- Sadhal SS, Johnson RE. Stokes flow past bubbles and drops partially coated with thin films. part 1. stagnant cap of surfactant film - exact solution. Journal of Fluid Mechanics. 1983;133:65–81. [Google Scholar]
- Scardovelli R, Zaleski S. Direct numerical simulation of free surface and interfacial flow. Annual Review of Fluid Mechanics. 1999;31:576. [Google Scholar]
- Sharan M, Popel AS. A two-phase model for blood flow in narrow tubes with increased viscosity near the wall. Biorheology. 2001;38:415–428. [PubMed] [Google Scholar]
- Shin S, Abdel-Khalik SI, Daru V, Juric D. Accurate representation of surface tension using the level contour reconstructionmethod. Journal of Computational Physics. 2005;203:493–516. [Google Scholar]
- Shin S, Juric D. Modeling three-dimensional multiphase flow using a level contour reconstructionmethod for front tracking without connectivity. Journal of Computational Physics. 2002;180:427–470. [Google Scholar]
- Sigurdson WJ, Sachs F, L Diamond S. Mechanical perturbation of cultured human endothelial cells causes rapid increases of intracellular calcium. Am J Physiol Heart Circ Physiol. 1993;264(6):H1745–H1752. doi: 10.1152/ajpheart.1993.264.6.H1745. [DOI] [PubMed] [Google Scholar]
- Somasundaran P. Encyclopedia of Surface and Colloid Science. CRC Press; 2006. [Google Scholar]
- Stone HA. A simple derivation of the time-dependent convective-diffusive equation for surfactant transport along a deforming interface. Physics of Fluids A. 1990;2:111–112. [Google Scholar]
- Sussman M, Almgren AS, Bell JB, Colella P, Howell L, Welcome M. An adaptive level set approach for incompressible two-phase flows. Journal of Computational Physics. 1999;148:81. [Google Scholar]
- Sussman M, Puckett EG. A coupled level set and volume-of-fluid method for computing 3D and axisymmetric incompressible two-phase flows. Journal of Computational Physics. 2000;162(2):301–337. [Google Scholar]
- Suzuki A, Armstead SC, Eckmann DM. Surfactant reduction in embolism bubble adhesion and endothelial damage. Anesthesiology. 2004;101:97–103. doi: 10.1097/00000542-200407000-00016. [DOI] [PubMed] [Google Scholar]
- Swaminathan TN, Ayyaswamy PS, Eckmann DM. Favorable conditions for exogenous surfactant-based intervention of gas embolism. 2009 manuscript under preparation. [Google Scholar]
- Torres DJ, Brackbill JU. The point-set method: front tracking without connectivity. Journal of Computational Physics. 2000;165:620. [Google Scholar]
- Tryggvason G, Bunner B, Esmaeeli A, Juric D, Al-Rawahi N, Tauber W, Han J, Nas S, Jan YJ. A front-tracking method for the computations of multiphase flow. Journal of Computational Physics. 2001;169:708–759. [Google Scholar]
- Tsai TM, Miksis MJ. Dynamics of a drop in a constricted capillary tube. Journal of Fluid Mechanics. 1994;274:197–217. [Google Scholar]
- Udaykumar HS, Tran L, Belk DM, Vanden KJ. An eulerian method for computation of multimaterial impact with ENO shock-capturingand sharp interfaces. Journal of Computational Physics. 2003;186:136–177. [Google Scholar]
- Unverdi SO, Tryggvason G. A front-tracking method for viscous incompressible, multi-fluid flows. Journal of Computational Physics. 1992;100(1):25–37. [Google Scholar]
- Van Sint Annaland M, Dijkhuizen W, Deen NG, Kuipers JAM. Numerical simulation of gas bubbles behaviour using a 3D front trackingmethod. AIChE Journal. 2006;52:99–110. [Google Scholar]
- Vlahakis NE, Hubmayr RD. Invited review:plasma membrane stress failure in alveolar epithelial cells. Journal of Applied Physiology. 2000;89:2490–2496. doi: 10.1152/jappl.2000.89.6.2490. [DOI] [PubMed] [Google Scholar]
- Wesseling P. An Introduction to Multigrid Methods. New York, USA: John Wiley & Sons; 1992. [Google Scholar]
- Yon S, Pozrikidis C. A finite volume/boundary-element method for flow past interfaces in the presence of surfactants, with application to shear flow past a viscous drop. Computational Fluids. 1998;27:879–902. [Google Scholar]
- Young NO, Goldstein JS, Block MJ. The motion of bubbles in a vertical temperature gradient. Journal of Fluid Mechanics. 1959;6:350. [Google Scholar]
- Zhang J, Eckmann DM, Ayyaswamy PS. A front tracking method for a deformable intravascular bubble in a tube with soluble surfactant transport. Journal of Computational Physics. 2006;214:366–396. [Google Scholar]


