

Abstract
In the present study, we utilize methods from graph theory to analyze epileptogenic network properties during periods of ictal activity. Using these methods, we analyzed the DTF-based causal information flow in nine seizures recorded from two patients undergoing presurgical monitoring for the treatment of medically intractable epilepsy. From the results, we observed a high degree of correlation between the regions with a high amount of information outflow (termed the outdegree) and the cortical areas identified clinically as the generators of the ictal activity. We furthermore observe a frequency-dependent correlation between the co-localization of these “activated regions” and the clinical foci. These findings suggest that application of network analysis tools to ictal activity could provide clinically useful information concerning these epileptogenic networks.
I. Introduction
Each year, approximately 200,000 Americans will be diagnosed with epilepsy. Of these patients, the majority will be able to control their seizures through the use of antiepileptic drugs. An estimated 20,000 individuals, however, will continue to have seizures despite optimal medical therapy. Surgical resection of the presumed ictal focus is typically the only remaining treatment option in patients with these medically-intractable seizures. In the absence of a lesion visible on imaging studies, intracranial recordings are acquired in order to determine the regions responsible for ictal onset. These procedures typically require prolonged hospitalization of the patients during the invasive monitoring. Techniques to improve the localization of the cortical region(s) responsible for the generation of the seizures would therefore have significant clinical impact.
Many techniques have been developed with the aim of discerning the complex network interactions which lead to epileptogenesis [1-5]. Of these techniques, graph theory measures have been developed as a tool by which to simplify the observed network into a number of measurable properties [6-9]. Several studies have used these measures to better understand the properties of the epileptogenic networks [10-14]. These methods could potentially provide greater insight into the underlying generators of the epileptic seizures which are not readily apparent from visual inspection of the EEG recordings.
In this study, we have applied elements of graph theory, namely the outdegree measure, to cortical networks observed during ictal activity. We obtain the cortical networks through application of the Directed Transfer Function to the intracranial electrocorticogram (ECoG) recordings. In many previous studies using graph methods, the network interactions have been identified through application of traditional bivariate measures such as coherence. The DTF method used in the current study provides a more robust and insightful picture of the network interactions through the identification of connected nodes and the causal interactions between them. The outdegree measure that we employ identifies network nodes which act as sources of information flow within the network. Together we use these methods to identify critical nodes of the epileptogenic network and examine their relationship to the seizure onset zone identified clinically.
II. Methods
A. Patient Data
Two patients (ages 25 and 26, 1M/1F) with medically intractable neocortical-onset epilepsy were selected for analysis in the current study. Both patients were admitted to the epilepsy monitoring unit at the Mayo Clinic (Rochester, MN, USA) for presurgical evaluation. Long-term electrocorticogram (ECoG) recordings were obtained from silastic grids (4 mm electrode contacts; 10 mm interelectrode spacing) implanted on the cortical surface. The recordings were referenced to a scalp suture electrode placed at the vertex, passed through a 125 Hz anti-aliasing filter and sampled at 500 Hz (Xltek EMU128; Natus Medical Inc, Oakville, ON, Canada). Following acquisition of the data, off-line pre-processing was performed and included additional band-pass filtering (0.1-55 Hz) and automated artifact rejection. Visual inspection was also performed upon the data and any channels exhibiting the presence of artifact were discarded from the analysis. One patient underwent surgical resection of the clinically-identified seizure onset zone (SOZ) and had a significant reduction in seizure frequency following the procedure. The second patient was not a surgical candidate due to the location of the SOZ. The study was approved by the Institutional Review Boards at the University of Minnesota and the Mayo Clinic.
B. Connectivity Calculations
A multivariate autoregressive (MVAR) model can be used to describe a dataset as follows:
| (1) |
where X (t) is the data vector, Λ(k) is the matrix of model coefficients, E(t) is independent white noise and p is the model order. The model order was chosen by the Bayesian Information Criterion (BIC) [15] which has previously been shown to possess a high degree of accuracy [16]. In the current study, the optimal model order was identified as p = 3.
The Directed Transfer Function (DTF) was first developed by Kaminski and Blinowska as a means by which to determine the direction of the flow of information in multivariate systems [17]. They derived the DTF based upon the framework of the MVAR model as:
| (2) |
where and Λk=0 = I. Here, Λ is the matrix of model coefficients obtained from the MVAR model described above and H (f) is the transfer matrix containing the frequency-specific causal relationships. The normalized DTF is defined by the elements of the transfer matrix in the spectral domain, which describes the directional interaction from the jth to the ith element as:
| (3) |
with the normalization condition . In the current study, the DTF was calculated over the theta (3-7 Hz), alpha (8-12 Hz), beta (13-30 Hz) and gamma (30-50 Hz) frequency bands.
C. Outdegree Measures
The outdegree is a measure of the source activity arising from each node in a network. In the current study, the outdegree corresponded to the frequency-specific causal interactions which originated at each node. For a particular node, v, the outdegree is defined as:
| (4) |
where κkv is the causal interaction from node v to node k averaged over a specified frequency band. In terms of (3), κ is given by:
| (5) |
where f2 and f1 are the upper and lower bounds, respectively, of the frequency band of interest. Thus, nodes with a high outdegree measure act as sources of the information flow within a system. From the causal networks obtained using the DTF methods described above, the outdegree measures were calculated for each electrode in each of the four frequency bands (θ, α, β, γ).
D. Ictal Network Analysis
A total of nine seizures were analyzed in the two selected patients. The time points corresponding to ictal onset and offset were identified using a method developed by Schindler et al. [18]. The time series was divided into 6 second moving windows with an overlap of 5.75 seconds and the z-score of the time series within each window was obtained in order to normalize the variance of the channels. The DTF method was applied to the windowed data and the outdegree was calculated for each node using the strongest 200 connections (out of a possible 992 and 3080 connections in the 2 patients respectively) from each windowed epoch in order to maintain the degree distribution among the analyzed epochs.
K-means clustering was applied to the outdegree measurements to identify activated regions during the course of the ictal activity. For each seizure, the activated regions in the theta, alpha, beta and gamma frequencies were identified and compared to the clinical SOZ. The percentage of overlap between the clinical SOZs and the activated regions was measured and the Wilcoxon rank-sum test was used to identify statistically-significant differences among the four analyzed frequency bands.
III. Results
A representative spatial map of the activated regions during one of the analyzed seizures in the first patient is shown in Figure 1. The SOZ identified by the epileptologists is shown in red in Figure 1(a). Figures 1(b-e) display the spatial extents of the activated regions in the theta, alpha, beta and gamma frequency bands respectively. As can be seen in Figure 1, the locations of the activated regions are fairly consistent among the various frequency bands although variations among the spatial extents of the regions can be observed. Additionally, it can be observed that the activated regions are in fairly good agreement with the clinical SOZ, particularly among the gamma and beta frequencies. Following surgical excision of the clinical SOZ, the patient was initially seizure-free for a period of 1.5 months. Following this, the patient experienced a recurrence of the seizure activity albeit at a significantly reduced frequency.
Fig. 1.
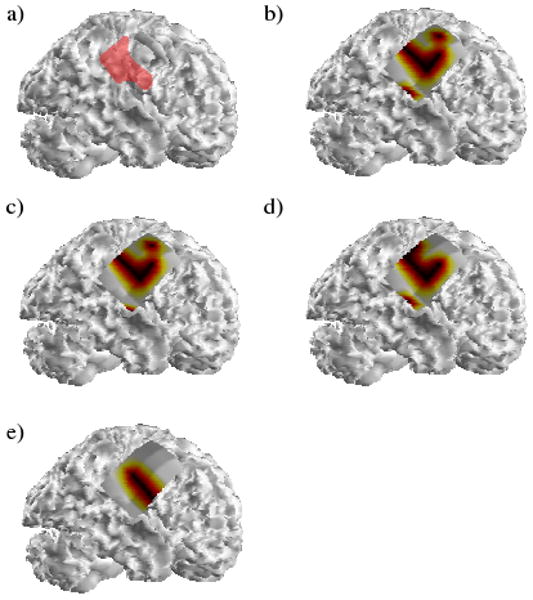
(a) The SOZ identified clinically in the first patient is shown highlighted in red. The activated regions in one of the analyzed seizures corresponding to the theta, alpha, beta and gamma frequency bands are shown in (b-e) respectively.
Similar to Figure 1, a typical spatial map of the activated regions in the second patient is shown in Figure 2. In this patient, two SOZs were identified clinically: a larger focus within the right frontal lobe and a second smaller focus located slightly anterior and posterior to the frontal SOZ. As with the first patient, the locations of the activated regions corresponding to the four frequency bands are fairly similar although a greater degree of variability is seen compared to the maps displayed in Figure 1. Activity corresponding to the locations of both ictal foci was observed in the theta, alpha and gamma frequency bands. In the analyzed seizure, the activated regions in the beta frequency band were only observed in the inferior portion of the frontal SOZ. As with the results shown in Figure 1, the activated regions in the gamma band are highly correlated with the ictal foci identified clinically. Unfortunately, stimulation of portions of the clinically-identified foci resulted in oral motor/sensory dysfunction and this patient was deemed to not be a surgical candidate.
Fig. 2.
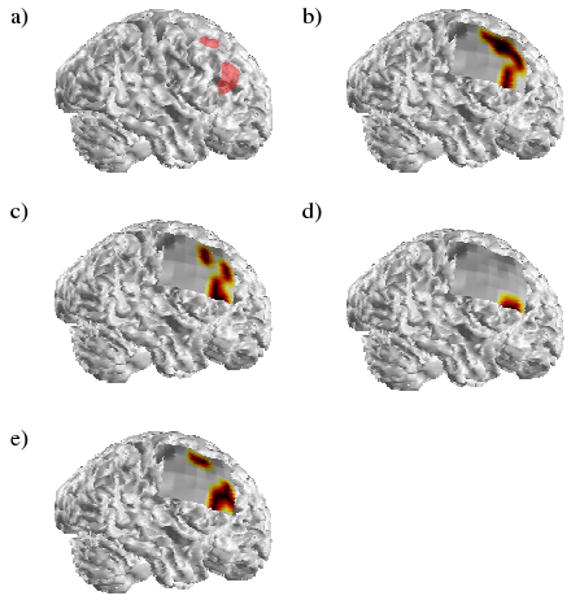
The activated regions obtained from a typical analyzed seizure in the second patient. The labels are the same as in Figure 1.
Following the identification of the activated regions from the outdegree calculations, a ratio of the percentage of the activated regions within the clinical SOZs was obtained. A box plot displaying the ratios calculated for each of the four frequency bands in the nine analyzed seizures is shown in Figure 3. Here, the median value for each frequency band is shown in red, the borders of the boxes correspond to the lower and upper quartiles and the whiskers indicate the total range of the measured data. From here, a frequency-dependent effect on the percentage of overlap between the activated region and the clinical SOZ can be observed, with a greater percentage of the activated regions in the beta and gamma frequencies co-localized with the clinical foci. A Wilcoxon rank-sum test was performed and the overlap with the clinical SOZ was observed to be significantly greater in both the beta and gamma frequencies compared to the activated regions in the theta frequency band (p<0.05).
Fig. 3.
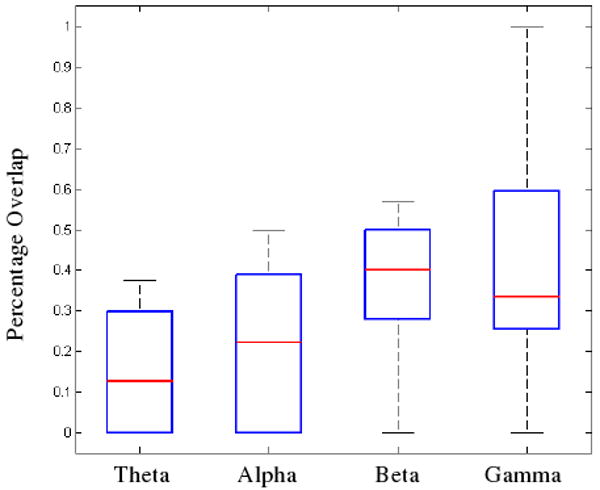
The percentage of overlap between the activated regions and the clinical SOZ. The median value for each frequency band is shown in red while the lower and upper edges of each box represent the lower and upper quartiles respectively. The whiskers display the total range of the observed data. The percentage overlap of both the beta and gamma bands with the SOZ was found to be significantly greater than the overlap between the theta band and the SOZ (Wilcoxon rank-sum test; p<0.05).
IV. Discussion
Graph theory measures are a powerful means by which to reduce complex networks into a series of parameters corresponding to specific properties of the networks. The outdegree measure used in the present study identifies sources of activity within a network from which a large degree of information flows. This method and other graph measures could be potentially useful in the identification and characterization of epileptogenic networks. This, in turn, could lead to more accurate surgical planning and better postsurgical outcomes in patients with intractable epilepsy.
In the present study, we have applied network analysis measures, namely the outdegree measure, to the analysis of epileptogenic networks during ictal activity. Specifically, we have examined the outdegree activity in the theta, alpha, beta and gamma bands in relation to the SOZ identified clinically by the epileptologists. From the analysis of nine selected seizures in the two patients, it was observed that the locations of the activated regions closely corresponded to the cortical regions identified as the SOZs. This finding is not unexpected as the outdegree measure utilized in the current study provides an indication of the source activity arising from each network node. Likewise, the cortical regions identified as the SOZs act as the generators of the ictal activity which rapidly propagates throughout the cortex. Additionally, it was observed that the percentage of overlap among the activated regions and the clinical SOZ was frequency-dependent. From our analysis of the selected seizures in the current study, we have observed a higher degree of overlap between the activated regions and the SOZ in the beta and gamma frequency bands compared to the theta band activity. This finding is in agreement with several other studies which have shown the presence of high frequency oscillatory activity in greater proportions within the SOZ [19-21]
From the results of the current study, we have observed a close relationship between the location of the SOZ determined by conventional clinical means and the functional activity of the network as measured by the outdegree properties obtained from the calculated causal maps. These results are encouraging as they indicate that graph measures can provide functional information regarding the generators of the ictal activity. Such information would be useful in the clinical evaluation of patients with epilepsy, especially in situations in which the SOZ is not readily discernable by conventional clinical methods. However, additional studies involving a larger cohort of patients are needed to further investigate this aspect.
In summary, graph methods are powerful tools by which to characterize complex network interactions and may provide greater insight into the generation and propagation of the ictal activity.
Acknowledgments
We would like to thank Cindy Nelson and Matt Stead for aiding in the acquisition of the clinical data.
This work was supported in part by NIH RO1EB007920-02, and a grant from the Minnesota Partnership for Biotechnology and Medical Genomics. C.W. was supported by NIH T32 EB008389-01.
Contributor Information
Christopher Wilke, Email: wilk0242@umn.edu, Department of Biomedical Engineering at the University of Minnesota, 7-105 NHH, 312 Church Street SE, Minneapolis, MN 55455 USA.
Gregory A. Worrell, Department of Neurology at the Mayo Clinic, 200 First Street SW, Rochester, MN 55905 USA.
Bin He, Department of Biomedical Engineering at the University of Minnesota, 7-105 NHH, 312 Church Street SE, Minneapolis, MN 55455 USA.
References
- 1.Spencer SS. Neural networks in human epilepsy: evidence of and implications for treatment. Epilepsia. 2002 Mar;43:219–227. doi: 10.1046/j.1528-1157.2002.26901.x. [DOI] [PubMed] [Google Scholar]
- 2.Bialonski S, Lehnertz K. Identifying phase synchronization clusters in spatially extended dynamical systems. Phys Rev E Stat Nonlin Soft Matter Phys. 2006 Nov;74:051909. doi: 10.1103/PhysRevE.74.051909. [DOI] [PubMed] [Google Scholar]
- 3.Waites AB, Briellmann RS, Saling MM, Abbott DF, Jackson GD. Functional connectivity networks are disrupted in left temporal lobe epilepsy. Ann Neurol. 2006 Feb;59:335–343. doi: 10.1002/ana.20733. [DOI] [PubMed] [Google Scholar]
- 4.Ortega GJ, Sola RG, Pastor J. Complex network analysis of human ECoG data. Neurosci Lett. 2008 Dec 12;447:129–133. doi: 10.1016/j.neulet.2008.09.080. [DOI] [PubMed] [Google Scholar]
- 5.Valton L, Guye M, McGonigal A, Marquis P, Wendling F, Regis J, Chauvel P, Bartolomei F. Functional interactions in brain networks underlying epileptic seizures in bilateral diffuse periventricular heterotopia. Clin Neurophysiol. 2008 Jan;119:212–223. doi: 10.1016/j.clinph.2007.09.118. [DOI] [PubMed] [Google Scholar]
- 6.Sporns O. Graph theory methods for the analysis of neural connectivity patterns. In: Kotter R, editor. Neuroscience Databases. A Practical Guide. Boston: Kluwer; 2002. pp. 171–187. [Google Scholar]
- 7.Sporns O, Chialvo DR, Kaiser M, Hilgetag CC. Organization, development and function of complex brain networks. Trends Cogn Sci. 2004 Sep;8:418–425. doi: 10.1016/j.tics.2004.07.008. [DOI] [PubMed] [Google Scholar]
- 8.Muller M, Baier G, Galka A, Stephani U, Muhle H. Detection and characterization of changes of the correlation structure in multivariate time series. Phys Rev E Stat Nonlin Soft Matter Phys. 2005 Apr;71:046116. doi: 10.1103/PhysRevE.71.046116. [DOI] [PubMed] [Google Scholar]
- 9.Fallani F De Vico, Astolfi L, Cincotti F, Mattia D, Tocci A, Salinari S, Marciani MG, Witte H, Colosimo A, Babiloni F. Brain network analysis from high-resolution EEG recordings by the application of theoretical graph indexes. IEEE Trans Neural Syst Rehabil Eng. 2008 Oct;16:442–452. doi: 10.1109/TNSRE.2008.2006196. [DOI] [PubMed] [Google Scholar]
- 10.Baccala LA, Alvarenga MY, Sameshima K, Jorge CL, Castro LH. Graph theoretical characterization and tracking of the effective neural connectivity during episodes of mesial temporal epileptic seizure. J Integr Neurosci. 2004 Dec;3:379–395. doi: 10.1142/s0219635204000610. [DOI] [PubMed] [Google Scholar]
- 11.Netoff TI, Clewley R, Arno S, Keck T, White JA. Epilepsy in small-world networks. J Neurosci. 2004 Sep 15;24:8075–8083. doi: 10.1523/JNEUROSCI.1509-04.2004. [DOI] [PMC free article] [PubMed] [Google Scholar]
- 12.Ponten SC, Bartolomei F, Stam CJ. Small-world networks and epilepsy: graph theoretical analysis of intracerebrally recorded mesial temporal lobe seizures. Clin Neurophysiol. 2007 Apr;118:918–927. doi: 10.1016/j.clinph.2006.12.002. [DOI] [PubMed] [Google Scholar]
- 13.Srinivas KV, Jain R, Saurav S, Sikdar SK. Small-world network topology of hippocampal neuronal network is lost, in an in vitro glutamate injury model of epilepsy. Eur J Neurosci. 2007 Jun;25:3276–3286. doi: 10.1111/j.1460-9568.2007.05559.x. [DOI] [PubMed] [Google Scholar]
- 14.Kramer MA, Kolaczyk ED, Kirsch HE. Emergent network topology at seizure onset in humans. Epilepsy Res. 2008 May;79:173–186. doi: 10.1016/j.eplepsyres.2008.02.002. [DOI] [PubMed] [Google Scholar]
- 15.Schwarz G. Estimating the dimension of a model. Ann Stat. 1978;6:461–464. [Google Scholar]
- 16.Lutkepohl H. Comparison of criteria for estimating the order of a vector autoregressive process. J Time Ser Anal. 1985;6:5–52. [Google Scholar]
- 17.Kaminski MJ, Blinowska KJ. A new method of the description of the information flow in the brain structures. Biol Cybern. 1991;65:203–210. doi: 10.1007/BF00198091. [DOI] [PubMed] [Google Scholar]
- 18.Schindler K, Wiest R, Kollar M, Donati F. Using simulated neuronal cell models for detection of epileptic seizures in foramen ovale and scalp EEG. Clin Neurophysiol. 2001 Jun;112:1006–1017. doi: 10.1016/s1388-2457(01)00522-3. [DOI] [PubMed] [Google Scholar]
- 19.Worrell GA, Parish L, Cranstoun SD, Jonas R, Baltuch G, Litt B. High-frequency oscillations and seizure generation in neocortical epilepsy. Brain. 2004 Jul;127:1496–1506. doi: 10.1093/brain/awh149. [DOI] [PubMed] [Google Scholar]
- 20.Jirsch JD, Urrestarazu E, LeVan P, Olivier A, Dubeau F, Gotman J. High-frequency oscillations during human focal seizures. Brain. 2006 Jun;129:1593–1608. doi: 10.1093/brain/awl085. [DOI] [PubMed] [Google Scholar]
- 21.Worrell GA, Gardner AB, Stead SM, Hu S, Goerss S, Cascino GJ, Meyer FB, Marsh R, Litt B. High-frequency oscillations in human temporal lobe: simultaneous microwire and clinical macroelectrode recordings. Brain. 2008 Apr;131:928–937. doi: 10.1093/brain/awn006. [DOI] [PMC free article] [PubMed] [Google Scholar]