

Abstract
To demonstrate the utility of phage display in generating highly specific antibodies, affinity selections were conducted on 20 related Src Homology 2 (SH2) domains (ABL1, ABL2, BTK, BCAR3, CRK, FYN, GRB2, GRAP2, LYN, LCK, NCK1, PTPN11 C, PIK3R1 C, PLCγ1 C, RASA1 C, SHC1, SH2D1A, SYK N, VAV1 and the tandem domains of ZAP70). The domains were expressed in Escherichia coli, purified and used in affinity selection experiments. In total, 1292/3800 of the resultant antibodies were shown to bind the target antigen. Of the 695 further evaluated in specificity ELISAs against all 20 SH2 domains, 379 antibodies were identified with unique specificity (i.e. monospecific). Sequence analysis revealed that there were at least 150 different clones with 1–19 different antibodies/antigen. This includes antibodies that distinguish between ABL1 and ABL2, despite their 89% sequence identity. Specificity was confirmed for many on protein arrays fabricated with 432 different proteins. Thus, even though the SH2 domains share a common three-dimensional structure and 20–89% identity at the primary structure level, we were able to isolate antibodies with exquisite specificity within this family of structurally related domains.
Keywords: ELISA, monospecificity, protein microarray, scFv, time-resolved fluorescence
Introduction
The functions of genes encoded within the genome are realized through their protein products. Antibodies allow direct quantitation and visualization of these protein products and so creating panels of monoclonal antibodies to an entire proteome would be of huge value to the research community. Although antibodies have conventionally been generated through immunization of animals with pure, recombinant proteins or synthetic peptides, the task of generating antibodies to >20 000 targets represents a laborious, expensive and time-consuming process. Screening recombinant libraries of artificial affinity reagents represents an attractive alternative that may be cheaper and faster. In contrast to polyclonal antibodies, recombinant antibodies are renewable resources with potentially greater specificity. Phage display technology represents one such route for high-throughput generation of affinity reagents to every human protein (Schofield et al., 2007). Affinity selection can be performed by screening target proteins, as has been done previously, with phage libraries displaying antibody fragments (Sheets et al., 1998; Rothe et al., 2008), combinatorial peptides (Scholle et al., 2005) and alternative scaffolds based on the Z domain of protein A (Nilsson and Tolmachev, 2007), the fibronectin type III domain (Koide et al., 1998), or designed ankyrin repeat proteins (Huber et al., 2007).
The success of an antibody in a particular application is dependent on a combination of specificity, affinity and the properties of the epitope, which is being recognized. It is especially challenging to generate specific antibodies to protein targets that belong to a family of proteins that possess sequence and structural similarity. While we have previously demonstrated the feasibility of selecting on multiple diverse antigens in parallel (Schofield et al., 2007), here we demonstrate generation of antibodies to a subset of 20 related protein domains, specifically a subset of Src Homology 2 (SH2) domains.
SH2 domains were first identified as conserved protein regions present in protein tyrosine kinases belonging to the Src family (Sadowski et al., 1986). SH2 domains constitute the largest class of phosphotyrosine (pTyr)-binding domains, with 120 SH2 domains encoded by the human genome (Yaffe, 2002; Liu et al., 2006). SH2 domains are structural components of a wide variety of kinases, phosphatases, adaptors and transcription factors, and play important roles in cell signaling (Moran et al., 1990; Pawson et al., 2001). SH2 domains are composed of ∼100 residues that fold into anti-parallel β-sheets, flanked by two α-helices. Like many other protein interaction modules, they fold independently into functional modules, with their N- and C-termini on the opposite side to the pTyr-binding surface. Even though SH2 domains are structurally similar, they bind to different pTyr-containing peptide motifs. The core-binding motif is typically 3–6 residues, positioned C-terminally to the pTyr residue. The optimal binding motifs for various SH2 domains have been identified by screening combinatorial peptide libraries (Songyang et al., 1993) or oriented peptide array libraries (Huang et al., 2008). This information is valuable for the identification of putative binding partners for SH2 domain containing proteins of unknown function.
In this study, we have generated antibody fragments, in the form of single-chain Fvs (scFvs), to 20 different human SH2 domains. A library of 10 billion different scFvs, displayed on the minor capsid protein III of bacteriophage M13 (Schofield et al., 2007), was used to select antibody fragments generating 1292 different antibodies. Enzyme linked immunosorbent assays (ELISAs) demonstrated that 379 of the antibodies display exquisite specificity, as indicated by binding to its cognate SH2 domain, and not to any of the other family members. Specificity was further confirmed for a subset of these by probing protein arrays consisting of 432 different protein fragments representing 245 different genes (Nilsson et al., 2005). Thus, it is possible to isolate recombinant antibodies that are highly selective within this protein family, even though they share an overall common three-dimensional structure and are 20–89% identical at the primary structural level. This work also demonstrates the potential of recombinant antibody generation for systematic antibody generation for proteomic studies.
Materials and methods
Overexpression and purification of SH2 domains
The coding sequences of all human SH2 domains were subcloned into the Asc1/Pac1 sites of a modified pET28 expression vector (pET28 SacB AP) and the set is available from Open Biosystems (OHS4902). The set used here consists of ABL1 (BC059260), FYN (NP_694592), GRAP2/gads(BC025692), LCK (BC013200), GRB2 (BC000631)LYN (BC031547), NCK1 (BC006403), PTPN11_C (BC008692), SH2D1A (BC020732), VAV1 (BC013361), zap70 tandem domains (NP_001070.2 with T157M), SYK_N (BC011399), PIK3R1_C (BC030815), RASA1C (BC033015), CRK (BC008506), SHCA/Shc1 (BC014158), BCAR3 (BC039895), BTK (AY335749), ABL2 (BC065912) and PLCG1_C (BC065091).
Recombinant plasmids were introduced into the Rosetta 2 (DE3) R3 strain of E.coli, and cells. Production cultures were grown in a LEX bioreactor system (Harbinger Biotechnology) at 37°C, until the OD600 reached a value of ∼2. SH2 domain overexpression was induced by addition of 0.5 mM isopropyl-β-d-thiogalactopyranoside (IPTG) in cultures incubated overnight at 18°C. SH2 domains were recovered from bacterial cell lysates through a two-step immobilized metal affinity chromatography (IMAC) and gel filtration purification process (Mersmann et al., 2009). Fractions containing the target proteins were pooled, protein concentrations were determined with a Nanodrop spectrophotometer (Thermo Scientific), and aliquots were snap-frozen in liquid nitrogen and stored at −80°C. Expected sizes (15–17 and 33 kDa for ZAP70) were confirmed on SDS–PAGE gels and the identities of the proteins were confirmed by mass spectrometry.
High-throughput phage selections
A phage library, with a diversity of 1.1 × 10¹⁰ clones, was used and selections were carried out as previously described (Schofield et al., 2007), using the 20 purified proteins encompassing 21 SH2 domains. After two rounds of selection, a polyclonal phage ELISA was performed on the target SH2 domains and ABL1, FYN and GRAP2 negative controls. The immobilized antigens were incubated with the respective polyclonal phage populations (1/10th dilution of phage supernatant in PBSM), in duplicate on 96-well black, flat-bottom MaxiSorp polystyrene plates (Nunc) in order to gauge specificity for the selected target. Binding was detected by anti-M13 antibody (GE Healthcare) followed by a europium-labeled anti-mouse secondary antibody (Perkin Elmer, UK), and detected by time-resolved fluorescence.
Sub-cloning populations of scFvs into an expression vector
Plasmid DNA was isolated from the scraped cells after the second rounds of selection using the Qiagen plasmid miniprep kit. The DNA inserts were excised from the library phagemid vector pSANG-4 by digestion with NcoI and NotI restriction enzymes (New England Biolabs). The digested samples were resolved by 1% agarose gel electrophoresis, and the released fragments purified for each antigen using a QiaQuick gel purification kit (Qiagen). The insert population was sub-cloned into pSANG-TEV-3F, a modified version of pSANG10-3F (Martin et al., 2006), which contains tandem tobacco etch virus (TEV) cleavage sites, encoded between the His and FLAG tags. Ligation was performed at 16°C overnight using T4 DNA ligase (New England Biolabs). The plasmids were transformed into BL21 DE3 cells and were plated on 2xTY KG plates (2xTY agar plates supplemented with 25 µg/ml of kanamycin and 2% glucose) and grown overnight at 30°C.
Primary screening
One hundred and ninety colonies were picked per antigen and grown overnight at 30°C and 600 rpm, in 96-well round bottom polypropylene plates (Corning) containing 2xTY KG media. The 96-well round bottom polypropylene plates were filled with 150 µl of autoinduction media (Studier, 2005) and a 96-well replicator (Genetix, UK) was used to transfer cells from the previously grown 96-well plates into the autoinduction media. Cells were incubated overnight at 30°C at 800 rpm. The next day, cells were pelleted by centrifugation at 3000 rpm for 5 min. The culture supernatants, containing the soluble scFvs, were adjusted to 1×PBS/2% Marvel and incubated with the specific antigens immobilized on 96-well black, flat-bottom MaxiSorp polystyrene plates (Nunc). Binding of scFvs to the immobilized antigens was detected using an anti-FLAG secondary antibody (Sigma) labeled with europium.
Specificity evaluation
For each target antigen, 12–48 binding clones that produced a signal of >1000 fluorescent units in the initial screening were taken for additional evaluation. (For two of the target, BTK and ABL2, the number of clones with a signal of >1000 fluorescent units were limited, and consequently, clones with a lower cut-off were permitted.) For specificity screening, scFvs production and ELISA were as described above. Initially, the culture supernatants containing the soluble scFvs were screened against the specific antigen and control antigens LYN and SHC1. Binding clones that produced a signal of ≥10 times above the signal of two control proteins were permitted into the secondary specificity ELISA. In the case of the CRK and PLCγ1 C, clones with a specific signal of ≥5 times above the background signal were permitted, resulting in 20 and 11 additional clones for CRK and PLCγ1 C, respectively. Antibody expression and the ELISA screening for detailed specificity screening is similar to the primary specificity screening, except that the binding of each clone was monitored against the other 19 SH2 domains.
Protein microarrays
Microarrays were constructed by spotting protein onto epoxy-coated slides (Corning Life Sciences) with 14 identical subarrays on each slide, utilizing a non-contact Nanoplotter 2.0E (GeSim). Each subarray contains 432 protein spots. This includes 301 irrelevant protein epitope signature tags (PrESTs) corresponding to 172 genes encoded on human chromosome 21 and 85 PrESTs spots corresponding to 53 unique SH2-domain containing proteins, expressed as His6/albumin binding protein fusions. Finally, duplicates and triplicates of 20-folded SH2 domains used for selection/screening in this study were included. The latter group was spotted at different concentrations ranging from 0.4 to 4.0 mg/ml and also 1:1 dilutions of each. The PrESTs were diluted to 40 µg/ml in 0.1 M urea and 50 mM sodium carbonate–bicarbonate buffer, pH 9.6, complemented with 100 µg/ml BSA.
Slides were blocked in 3% BSA in PBS–0.1% Tween. The scFvs were incubated at a dilution factor ranging from 1 to 3000 in PBS for 1 h. The secondary antibody (anti-FLAG-biotin) was incubated at 1:1000 dilution in PBSM for 1 h and the tertiary detection reagent (streptavidin-Alexa647) was used at 1:1000 dilution in PBS. The slides were scanned (G2565BA array scanner, Agilent) and images quantified using the image analysis software, GenePix 5.1 (Molecular Devices).
Results
Phage display is a powerful method for generating antibodies to proteins of interest. We have previously described the construction of an antibody phage display library of over 10 billion clones, and have used it to generate antibodies to over 300 different antigens (Schofield et al., 2007). Here, we utilize this library to generate a large and complete panel of antibodies recognizing individual members within a panel of 20 related protein interaction modules. We have focused on the SH2 domain, a modular domain of ∼100 amino acids, which recognizes pTyr-modified peptide sequences within its binding partners. We have expressed 19 individual SH2 domains and one tandem pair of SH2 domains present in the ZAP70 protein. Figure 1A illustrates the sequence similarity within the family of SH2 domains and highlights in red the 21 members used in this study. In some cases, the sequence similarity is only 20–30%. In contrast, GRAP2/GRB2 and ZAP70N/SYK_N have sequence identity of 55–56%, and LCK and LYN share 66% sequence identity. There is a particularly close relationship between ABL1 and ABL2, which share 89% identity. Figure 1B shows the protein structure of the SH2 domain of ABL2, and highlights the amino acid differences between ABL1 and ABL2. Thus, the SH2 domains represent an interesting scientific challenge for generating recombinant antibodies that specifically bind individual members of a group of related protein domains, irrespective of the degree of sequence similarity.
Fig. 1.

The family of SH2 domains. (A) Hypertree representation of all 120 human SH2 domains. A family tree of 120 SH2 domains in the human proteome is shown, with the 21 domains used in this study highlighted in red and underlined. The ZAP70 protein fragment used in this study contains two SH2 domains ZAP70_N and ZAP70_C, which are represented separately in the diagram. (B) The three-dimensional structure of ABL2. The structure of the SH2 domain of ABL2 is shown, with highlighting of residues differing between ABL1 and ABL2. The PyMOL Molecular Graphics System (DeLano Scientific, San Carlos, CA, USA) was used to generate a surface model of ABL2 from the PDB coordinates 2ECD (Kasai et al., doi:10.2210/pdb2ecd/pdb). (C) Sequence comparison of ABL1 and ABL2 SH2 domains. The ABL2 primary structure is shown indicating the 11 residues differing between ABL1 and ABL2.
The 20 different SH2 domain constructs were cloned into a modified form of the expression vector pET28, which incorporates hexahistidine tags and TEV protease sites at the N-termini and a pentapeptide, LINEF, at the C-termini of the expressed SH2 domains. Recombinant protein expression was induced in E.coli with IPTG, and the expressed SH2 domains were purified by IMAC and gel filtration. The purity of the SH2 domains was confirmed by SDS–PAGE electrophoresis (Fig. 2) and mass spectrometry (not shown).
Fig. 2.

SDS–PAGE analysis of the 20 purified human SH2 domains. (A–C) The recombinant proteins were purified by IMAC and gel filtration. The proteins were resolved by SDS–PAGE gel to confirm their purity. Molecular weights of size standards are shown in kiloDaltons.
Selection and primary screening
The purified SH2 domains were immobilized and selections were carried out using our antibody display library, which was constructed in the phagemid vector, pSANG-4 (Schofield et al., 2007). In this work, phagemid-encoded phage particles were rescued using a helper phage which incorporates a trypsin cleavage site in the minor capsid protein encoded by gene 3 (Kristensen and Winter, 1998). Since this protein is involved in the infection process, digestion with trypsin prevents infection from phage particles which only have helper virus encoded, wild-type capsid protein. Thus, only phage particles which incorporate a trypsin-resistant antibody-capsid protein fusion, encoded by the phagemid, will infect. Thus, trypsin cleavage prior to infection reduces background from ‘non-participating’ phage and as a result only two rounds of selection are required.
Following selection, polyclonal ELISAs demonstrated that binding phage had been enriched in all cases (Supplementary Fig. S1 available at PEDS online). Some cross-reactivity was observed, which could be due to binding of related epitopes within the family of SH2 domains or binding tags such as the hexahistidine tag/TEV protease site at the N-terminus or the ‘LINEF’ sequence at the C-terminus in all antigens. To study soluble forms of the scFvs, their coding regions were excised from the phagemid vector by digestion with NcoI and NotI restriction enzymes, and were sub-cloned into a bacterial expression vector optimized for soluble expression (Martin et al., 2006). This second vector incorporates a C-terminal hexahistidine tag (to permit affinity purification) and a trimeric FLAG epitope (facilitating sensitive detection of the resulting antibodies). A total of 190 bacterial colonies were picked from each of the 20 selections. Antibody fragments were expressed in overnight culture supernatants and were screened by ELISA against the selecting antigen, with binding of scFvs to the immobilized SH2 domains detected with a Europium labelled anti-FLAG antibody. This detection system is very sensitive and has a wide dynamic range, as seen in Fig. 3. Using a cut-off score of 1000 fluorescent units, it was found that 1292/3800 of the resultant clones bound their respective target antigen (summarized in Table I).
Fig. 3.

Primary screen of scFvs selected with each of the 20 SH2 domains. Affinity selections were carried out on 20 different human SH2 domain proteins and 190 antibodies, from the second round of selection, were tested for binding to each target. Binding of scFvs to the immobilized targets was quantified using europium-labeled anti-Flag secondary antibody. A graph is shown for each selection plotting the time-resolved fluorescence signal in intensity units (y-axis, logarithmic scale) for all 190 clones in that selection (x-axis). Antibodies are named according to their selection identification number which is shown in parentheses next to the target name (also used in Table I).
Table I.
Summary of selections on 20 SH2 domain proteins
| Primary screeninga |
Specificity screen (SHC1, LYN)b |
Specificity screen on all 20 SH2 domainsc |
|||||
|---|---|---|---|---|---|---|---|
| Selection no. | SH2 domain | No. of positives (>1000 units) | Number screened | No. of positives (specific >10× non-specific) | No. of specific clones isolated | Percentage specific | Unique sequences |
| 43 | ABL1 | 90 | 47 | 45 | 14 | 30 | 14 (9) |
| 44 | FYN | 61 | 48 | 26 | 25 | 52 | 12 (10) |
| 45 | GRAP2/gads | 21 | 12 | 1 | 1 | 8 | 1 (1) |
| 46 | LCK | 99 | 48 | 46 | 33 | 69 | 12 (11) |
| 47 | GRB2 | 82 | 48 | 4 | 4 | 8 | 2 (2) |
| 48 | LYN | 106 | 48 | 44 | 43 | 90 | 14 (7) |
| 49 | NCK1 | 97 | 48 | 42 | 40 | 83 | 6 (6) |
| 50 | PTPN11C | 120 | 48 | 46 | 40 | 83 | 17 (13) |
| 51 | SH2DIA | 85 | 24 | 14 | 14 | 58 | 5 (2) |
| 52 | VAV1 | 77 | 36 | 21 | 20 | 56 | 7 (6) |
| 53 | Zap70 | 41 | 36 | 30 | 29 | 81 | 19 (19) |
| 54 | SYKN | 42 | 24 | 1 | 1 | 4 | 1 (1) |
| 55 | PIK3RIC | 60 | 24 | 1 | 1 | 4 | 1 (1) |
| 56 | RASA1C | 23 | 12 | 11 | 11 | 92 | 6 (5) |
| 57 | CRK | 46 | 36 | 28 | 28 | 78 | 2 (1) |
| 58 | SHC1 | 62 | 48 | 48 | 42 | 88 | 13 (12) |
| 59 | BCAR3 | 55 | 36 | 19 | 18 | 50 | 8 (8) |
| 60 | BTK | 11 | 12 | 12 | 12 | 100 | 6 (6) |
| 61 | ABL2 | 9 | 12 | 3 | 2 | 17 | 1 (1) |
| 62 | PLCG1C | 105 | 48 | 19 | 1 | 2 | 1 (1) |
| Total | 1292 | 695 | 461 | 379 | 55% average | 148 | |
aEach selection is identified by a selection number and the number of antibodies generated for each antigen is shown (from screening 190 clones). A subset from these are passed onto for specificity screening (shown in ‘Specificity screen’).
bThe number of clones undergoing initial specificity screening on SHC and LYN and the resultant positives are shown.
cPositive clones from ‘Specificity screen’ were tested on all 20 SH2 domain proteins and the number of positives shown. The number of unique sequences based on CDR3 analysis is shown with the number of unique heavy chains shown in parentheses.
Specificity screening on all SH2 proteins
The maximum number of clones screened per antigen was limited to 48. A minimum of 12 clones were selected for each antigen and where the number of clones scoring above 1000 fluorescent units was low, a lower cut-off was permitted. Picked clones were named according to their selection number (indicated in Table I) and their position on the picked plate. Antibody was produced from this set of 695 clones and binding confirmed on the specific antigen and compared with binding to the control antigens, SHC1 and LYN. In total, 430 clones (62%) were found to have 10-fold preferential binding on their respective antigen compared with two control antigens, SHC1 and LYN (Table I). For CRK and PLCγ1 C, many clones demonstrated a lower specificity (i.e. 5–10 times higher than background), and these were also included in subsequent analysis.
Positive clones from the primary specificity screen were subjected to cross-reactivity profiling on all 20 SH2 domain proteins. Out of 461 clones undergoing detailed specificity testing, 379 (82%) were found to yield >10-fold higher binding signals to their respective target than the other SH2 domains tested (Table I). Thus, the preliminary screen on just 1–2 antigens was effective at removing cross-reactive clones or clones binding to tag elements leaving a relatively high proportion of the pre-screened antibodies demonstrating a high level of specificity. Whereas, the overall success rate for demonstrating ‘monospecificity’ among the group of SH2 domains was 55%, it ranged between 2% and 100%, between different antigens (Table I).
Sequence analysis of selection outputs
DNA sequencing was carried out on all 695 clones picked for primary and secondary specificity screening. Four primers were used to generate sequences of heavy (VH) and light chain (VL) variable domains and a consensus sequence was created from this. The VH and VL germline genes and the six complementarity determining regions (CDRs) were analyzed for each clone. As the most variable part of VH and VL regions are their CDR3 sequences, scFvs were grouped on the basis of their distinct combination of heavy and light chain CDR3 sequences. Grouping into such ‘clans’ serves the purpose of representing the diversity achieved, although any differences within frameworks and other CDRs are downplayed simply for a matter of convenience. Sequence diversity, according to these criteria, is summarized in Table I, along with indication of the number of unique clones/clans. In some cases, the same VHs are used in combination with different VLs (noted in parentheses in Table I).
The number of diverse clones generated for each target SH2 domain varied widely. In the case of NCK, the selection was dominated by one antibody, which was isolated at least 32 times out of 48 clones analyzed for specificity. In the case of CRK1, one clone, and a minor variation in CDR3 of VL, was isolated 34 times with no other positives found. In the case of LCK, the same VH5 germline V gene was used in 11/12 sequences, albeit with distinct CDR3 and light chain sequences. In contrast, ZAP70 had 19 different antibody sequences, each with a distinct heavy chain.
The results and sequence analysis of scFvs binding to two particular targets, ABL1 (Table II) and VAV1 (Supplementary Table S1 available at PEDS online) are highlighted. In the case of the VAV1 selection, primary screening of 190 antibodies resulted in identification of 77 positives clones. Thirty-six of these were screened against SHC and LYN and 21 were found to be specific (Table I). When the 21 clones were tested against all 20 SH2 domain proteins, 20 clones bound only to the selecting antigen (Fig. 4). One clone (052_E12) bound several of the other SH2 domains and so was rejected as non-specific. Sequencing of the 20 monospecific scFvs revealed that they consisted of six distinct clones, with slightly different binding profiles (Supplementary Table S1 available at PEDS online). Reassuringly, the binding profile shows great consistency in the ELISA signal among these duplicate isolates. For example, the 11 clones represented by Group a in Fig. 4A have an identical sequence (apart from a single point mutation in C02). In addition, the three clones of Group b and two clones of Group c are identical and in all cases, the signal profile within each group is the same. The fact that the identical isolates are named in sequence also arises because clones were ranked by their primary ELISA signal and were picked and named in order according to this signal intensity. This therefore reflects a consistency in signal during the primary screen, extending into the independent preparations used in the secondary screens.
Table II.
Sequence analysis of ABL1 antibodies
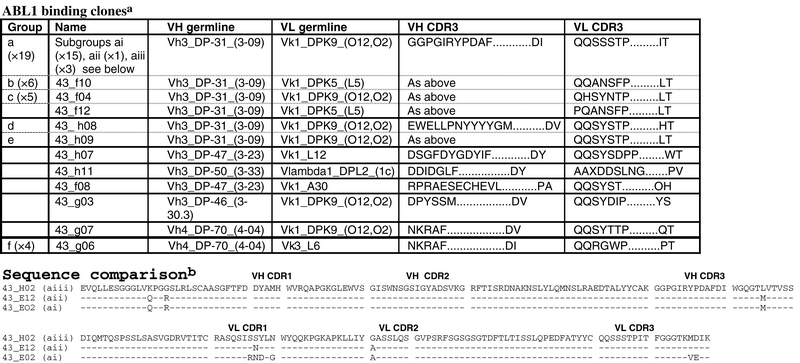 |
aABL1 binding clones are grouped according to VH and VL CDR3 sequences. Where identical clones have been isolated multiple times, the name of a representative clone is given and the group is identified by a letter which is also used to represent the same group in Fig. 4.
bSequence comparison of Groups ai, aii and aiii (represented by clones 43H02, 43_E12 and 43_E02, respectively) shares the same VH and VL chains as defined by CDR3s, but have differences in other positions which affect their binding properties.
Fig. 4.

Binding specificity for the VAV1 binding scFvs against the other 19 SH2 domain proteins. (A) Twenty-one scFvs passing primary specificity screening were incubated with the specific target VAV1 and 19 other control SH2 domain proteins. The ELISA signal is represented as fluorescent intensity units on the y-axis (logarithmic scale) and the antibody name is shown on the x-axis. All the scFv clones were specific for VAV1 (specific signal >10) except clone 52_E12. scFv clones having identical sequences (as described in Table II), and indicated by letters a, b, and c. (B) Specificity plot showing specific ABL1 versus ABL2 clones. ELISA signal on ABL1 versus ABL2 is shown for clones selected on either antigen. In the case of ABL1 selections, 32 clones arose sharing a common heavy chain in combination with at least four different light chains (based on the CDR3 sequences of VH and VL). These are identified as groups a, b, c and clone 43_F12. Groups d, e and f represent other groupings of duplicate clones. Within Group a, three different isolates were identified with sequence differences outside of CDR3. Thus, Group a is further sub-divided into ai, aii and aiii. Group g represents the three clones selected on ABL2.
ABL1 and ABL2 could be considered the most challenging targets in the group for generating specific antibodies, since they share 89% sequence identity. Table I shows that 90 positives were identified from primary screening (‘Primary screening’) with 45/47 passing the initial specificity screen (‘Specificity screen’). The number passing full specificity screening (‘Specificity screen on all 20 SH2 domains’) drops to 14, since there is partial or complete binding to ABL2. Figure 4B compares ELISA signal on ABL1 versus ABL2 for a group of clones selected on ABL1 or ABL2. Of the clones selected on ABL1, a large group of 32 clones share a common heavy chain in combination with at least four different light chains (Table II, ‘ABL1 binding clones’) and show preferential binding to ABL1 compared with ABL2. The dominating group defined by VH and VL CDR3 sequences (Group a in Fig. 4B) has 19 members and gave signal on ABL1, which is 3- to 5-fold higher than on ABL2. Detailed sequence analysis, extending beyond CDR3 and into the whole antibody sequence, revealed that there were three distinct sequences among this group (represented by ai, aii and aiii) with different binding profiles. Groups ai and aii gave higher signal than aiii. Sequence analysis reveals that there are five amino acid differences between Groups aii and aiii (Table II, ‘Sequence comparison’) which are therefore responsible for their differential binding to ABL1/ABL2. These five amino acid differences along with an additional five amino acids are also found in Group aiii. Thus, integrating sequence and binding data provide information on contact residues involved in binding ABL1.
The same heavy chain discussed above is also found in combination with three other light chains, which confer preferential binding on ABL1 with signals over 20-fold higher on ABL1 than on ABL2, represented by Groups b and c and clone 43_F12 in Fig. 4 and Table II. The selection on ABL2 was less successful giving only three positive clones (Group g) following the initial specificity screening. While one clone bound equally well to ABL1 and ABL2, the other two isolated clones showed preferential binding to ABL2 (Fig. 4B).
Specificity screening on protein microarrays
Protein arrays represent a simple method for analyzing specificity of binding to a wide range of antigens. Protein array slides were constructed consisting of 14 identical subarrays of 432 different proteins, allowing 14 different antibodies/conditions to be investigated per slide. Protein spots included 301 different protein fragments (PrESTs) representing 172 genes encoded on chromosome 21 (Nilsson et al., 2005), with 85 different PrESTs representing 53 different SH2 domain sequences, as well as the 20 SH2 domain proteins used in this project. FLAG-tagged scFvs were incubated with the protein arrays, washed and binding detected using biotinylated anti-FLAG antibodies and streptavidin conjugated with the fluorophore Alexa 647. Specific binding (represented by green bars in Fig. 5) is still evident with this wider range of test antigens and this alternative format. In the case of the anti-GRB2 scFv, binding was also seen to GRB2 in the corresponding PrEST sequence. In some instances, and in contrast to the earlier ELISA-based results, binding can be observed with other members of the SH2 domain group used in this study. In several cases, it has been demonstrated that this can be resolved by diluting the scFv and so these differences are at least in part due to differences in sensitivity/dynamic range between the two detection systems used (Fig. 5).
Fig. 5.

Specificity of antibody binding on protein microarrays. Microarrays spotted with 432 different proteins were probed with a range of antibodies. Examples show specific recognition of GRB2 (using 47_B02 at 6 µg/ml) SYK_N (using 054_A04 at 1 µg/ml) and RASA1_C (using 056_A10 at 1 µg/ml). In the case of NCK, the same antibody (067_F09) was used at either 13 or 1.2 µg/ml. Increased background was observed at the higher concentration. A green bar represents recognition of the correct antigen and a black bar shows cross-reactivity.
Discussion
Generating high-affinity antibodies on a proteome-wide scale will provide a wealth of reagents generating consistent, direct information on protein interactions, protein expression levels, modifications and sites of action. A number of initiatives to generate affinity reagents for all human proteins are being discussed or acted upon by research groups in Europe and the USA, including polyclonal, monoclonal and recombinant approaches (Uhlen et al., 2005; Haab et al., 2006; Schofield et al., 2007; Taussig et al., 2007). Recombinant methods for antibody generation have a number of advantages over the more traditional methods: without immunizing animals, specific antibodies can be generated in less time, with less antigen and with more control over binding conditions. Furthermore, in contrast to polyclonal and monoclonal approaches, recombinant antibodies are easily renewable and can be exchanged by researchers as recombinant DNA or even DNA sequence for gene synthesis.
The potential of recombinant antibody from phage display technology is without doubt and has been spectacularly demonstrated in the clinical setting with antibodies such as Humira, which is treating sufferers of rheumatoid arthritis and generating sales of $4 billion/annum in 2008 (http://www.humira.com/). Despite these successes, uptake of recombinant antibodies in the research community has been poor. While the desirability of recombinant antibodies is without question, doubts have been raised as to the maturity of recombinant methods to deliver such reagents at the scale needed for global proteomic analyses (Editorial, 2008). In 2008, an international pilot project was initiated to generate antibodies to 20 different SH2 domain proteins (Michnick and Sidhu, 2008; Uhlen et al., 2008). The work described here contributed to this effort. In particular, it exemplifies the potential to generate binders en masse, efficiently and with relatively limited resources. The core binder generation and specificity characterization activity presented here represents ∼12 person months (excluding antigen generation and downstream assays).
In this report, we describe generation of recombinant antibodies to a panel of 20 human SH2 domains. This class of targets was considered significant for several reasons. First, many of the proteins that carry SH2 domains are of great interest to cell and cancer biologists because of their role in signal transduction pathways and oncogenesis, respectively. Having antibodies to these proteins should complement ongoing research efforts on the cellular location and function of the human proteins carrying these SH2 domains. Recombinant antibodies could be easily provided to research groups for studying and exploring the functions of the human proteome. Second, as SH2 domains share a common three-dimensional structure and 30–89% similarity at the primary structural level, it was unclear that specific antibodies could be generated for each SH2 domain.
Specificity of target recognition is important in determining the success of antibodies in many applications such as ELISA, immunohistochemistry, western blotting, immunofluorescence, and immunoprecipitation. The work presented here exemplifies the exquisite specificity that can be attained from phage display even in a relatively high-throughput operation. Another factor that determines whether an antibody is useful for a given application is the characteristics of the epitope it recognizes. For example, antibodies, which neutralize receptors or ligands in therapeutic applications, are required to bind native conformations of epitopes. In contrast, applications such as immunohistochemistry require antibodies, which recognize epitopes, which survive, or are created by, denaturation of the target antigen. The best way to identify antibodies binding epitopes suitable for a particular application is to devise screens that accurately represent that application. The diversity of antibodies generated by phage display and the ease of their production can facilitate screening for suitable binders in such downstream screens.
The final antibody property determining success in a given application is affinity. Using surface plasmon resonance measurements in Biacore, we have found affinities in the range of 1–100 nM (unpublished), in agreement with earlier studies on libraries of a similar size and diversity (Vaughan et al., 1996). Once an antibody has been identified with suitable specificity and epitope characteristics, a particular advantage of phage display is the ability to conduct affinity maturation. This is done by generating mutant libraries and selecting these under stringent conditions. Work is underway to affinity mature a number of candidates described here, and utilize them in immunoprecipitation experiments (unpublished).
Figure 1 illustrates the family relationship of the 120 SH2 domains present in the human genome. We have chosen a panel of SH2 domain proteins spanning the complete family with sequence identity ranging from 20% to 89%. We were able to generate antibodies in all cases that uniquely bound to one member of the group of 21 SH2 domains studied. This included a range of antibodies, which distinguished ABL1 from ABL2 and vice versa, despite their 89% identity. Among the clones, which showed preferential binding to ABL1, we identified the same heavy chain in combination with four different light chain partners. These different partner light chains have differential effects on the relative ratio of ABL1/ABL2 binding. Furthermore, in one of these groups, sharing the same VH and VL CDR3 sequences, we were able to identify five amino acids differences which reduced ABL1/2 binding. In this way, detailed information on the interaction of these antibodies with their targets emerged within this high-throughput effort. This example also illustrates that although grouping according to CDR3 sequences can present a useful ‘thumbnail’ to represent diversity, information can be lost by this narrow definition. This is even more of an issue with the practice of defining diversity by using digestion with commonly cutting restriction enzymes (Mersmann et al., 2009).
In a related effort, antibodies were generated to the same group of SH2 domains (Mersmann et al., 2009). Comparison of the success rate for different proteins reveals that 13% were positive in their primary screens, whereas our screening isolated 34% positives. This may relate to differences in the selection protocols (such as our use of trypsin-resistant phage), detection sensitivities or to differences in diversity within the starting libraries. Certain antigens gave relatively low numbers of hits in both systems (e.g. BTK), which may be due to solubility issues in this antigen. On the other hand, there were selections that worked well in one system compared with the other. For example, ABL2 gave a poor response in this study but was relatively successful for Mersmann et al. (2009). In contrast, Fyn failed initially in their work but gave 61/190 binders here of which 52% were specific (>10×) when tested for cross-reactivity against 19 other SH2 domains. The reasons for these differences are unclear but may relate to different diversity profiles within the two libraries.
In conclusion, this study demonstrates that phage display is a high-throughput alternate technique to conventional methods to generate a renewable source of monospecific antibodies. We were able to generate specific antibodies to all the 20 human SH2 domains, in spite of some being 89% similar in primary sequence and the same overall three-dimensional structure. Phage display is the method of choice for generating arrays of antibodies to all the human proteins for exploring cellular processes within the cell.
Supplementary data
Funding
This work was supported by funding from The Wellcome Trust [to J.M.], the National Institutes of Health [GM082288-09A1, EY016094-01A1 to B.K.K.] and Genome Canada through the Ontario Genomics Institute [to T.P.]. The Structural Genomics Consortium is a registered charity (number 1097737) that receives funds from the Canadian Institutes for Health Research, the Canadian Foundation for Innovation, Genome Canada through the Ontario Genomics Institute, GlaxoSmithKline, Karolinska Institutet, the Knut and Alice Wallenberg Foundation, the Ontario Innovation Trust, the Ontario Ministry for Research and Innovation, Merck & Co., Inc., the Novartis Research Foundation, the Swedish Agency for Innovation Systems, the Swedish Foundation for Strategic Research and The Wellcome Trust.
Supplementary Material
Acknowledgements
We are grateful for the contribution of Mårten Sundberg and Ronald Sjöberg, from School of Biotechnology, KTH-Royal Institute of Technology, for their contribution to the protein array study. We would like to thank Bernard Liu (Samuel Lunenfeld Research Institute) who prepared Fig. 1A. We acknowledge the contributions made by the following scientists, Lisette Crombet, Lars-Göran Dahlgren, Alex Flores, Ida Johansson, Ivona Kozieradzki and Peter Loppnau, from the Structural Genomics Consortium, who contributed to the production of the SH2 domain proteins used in this study.
Footnotes
Edited by Andrew Bradbury
References
- Editorial. Nat. Methods. 2008;5:851. [Google Scholar]
- Haab B.B., Paulovich A.G., Anderson N.L., Clark A.M., Downing G.J., Hermjakob H., Labaer J., Uhlen M. Mol. Cell. Proteomics. 2006;5:1996–2007. doi: 10.1074/mcp.T600020-MCP200. [DOI] [PubMed] [Google Scholar]
- Huang H., et al. Mol. Cell. Proteomics. 2008;7:768–784. doi: 10.1074/mcp.M700312-MCP200. [DOI] [PubMed] [Google Scholar]
- Huber T., Steiner D., Rothlisberger D., Pluckthun A. J. Struct. Biol. 2007;159:206–221. doi: 10.1016/j.jsb.2007.01.013. [DOI] [PubMed] [Google Scholar]
- Kasai T., Koshiba S., Inoue M., Kigawa T., Yokoyama S. doi:10.2210/pdb2ecd/pdb. [Google Scholar]
- Koide A., Bailey C.W., Huang X., Koide S. J. Mol. Biol. 1998;284:1141–1151. doi: 10.1006/jmbi.1998.2238. [DOI] [PubMed] [Google Scholar]
- Kristensen P., Winter G. Fold Des. 1998;3:321–328. doi: 10.1016/S1359-0278(98)00044-3. [DOI] [PubMed] [Google Scholar]
- Liu B.A., Jablonowski K., Raina M., Arce M., Pawson T., Nash P.D. Mol. Cell. 2006;22:851–868. doi: 10.1016/j.molcel.2006.06.001. [DOI] [PubMed] [Google Scholar]
- Martin C.D., Rojas G., Mitchell J.N., Vincent K.J., Wu J., McCafferty J., Schofield D.J. BMC Biotechnol. 2006;6:46. doi: 10.1186/1472-6750-6-46. [DOI] [PMC free article] [PubMed] [Google Scholar]
- Mersmann M., Meier D., Mersmann J., Graslund S., Helmsing S., Nilsson P., Hust M., Dubel S. New Biotechnol. 2009 doi: 10.1016/j.nbt.2009.10.007. in press doi:10.1016/j.nbt.2009.10.007. [DOI] [PubMed] [Google Scholar]
- Michnick S.W., Sidhu S.S. Nat. Chem. Biol. 2008;4:326–329. doi: 10.1038/nchembio0608-326. [DOI] [PubMed] [Google Scholar]
- Moran M.F., Koch C.A., Anderson D., Ellis C., England L., Martin G.S., Pawson T. Proc. Natl Acad. Sci. USA. 1990;87:8622–8626. doi: 10.1073/pnas.87.21.8622. [DOI] [PMC free article] [PubMed] [Google Scholar]
- Nilsson F.Y., Tolmachev V. Curr. Opin. Drug Discov. Devel. 2007;10:167–175. [PubMed] [Google Scholar]
- Nilsson P., et al. Proteomics. 2005;5:4327–4337. doi: 10.1002/pmic.200500072. [DOI] [PubMed] [Google Scholar]
- Pawson T., Gish G.D., Nash P. Trends Cell Biol. 2001;11:504–511. doi: 10.1016/s0962-8924(01)02154-7. [DOI] [PubMed] [Google Scholar]
- Rothe C., et al. J. Mol. Biol. 2008;376:1182–1200. doi: 10.1016/j.jmb.2007.12.018. [DOI] [PubMed] [Google Scholar]
- Sadowski I., Stone J.C., Pawson T. Mol. Cell. Biol. 1986;6:4396–4408. doi: 10.1128/mcb.6.12.4396. [DOI] [PMC free article] [PubMed] [Google Scholar]
- Schofield D.J., et al. Genome Biol. 2007;8:R254. doi: 10.1186/gb-2007-8-11-r254. [DOI] [PMC free article] [PubMed] [Google Scholar]
- Scholle M.D., Kehoe J.W., Kay B.K. Comb. Chem. High Throughput Screen. 2005;8:545–551. doi: 10.2174/1386207054867337. [DOI] [PubMed] [Google Scholar]
- Sheets M.D., Amersdorfer P., Finnern R., Sargent P., Lindquist E., Schier R., Hemingsen G., Wong C., Gerhart J.C., Marks J.D. Proc. Natl Acad. Sci. USA. 1998;95:6157–6162. doi: 10.1073/pnas.95.11.6157. [DOI] [PMC free article] [PubMed] [Google Scholar]
- Songyang Z., et al. Cell. 1993;72:767–778. doi: 10.1016/0092-8674(93)90404-e. [DOI] [PubMed] [Google Scholar]
- Studier F.W. Protein Expr. Purif. 2005;41:207–234. doi: 10.1016/j.pep.2005.01.016. [DOI] [PubMed] [Google Scholar]
- Taussig M.J., et al. Nat. Methods. 2007;4:13–17. doi: 10.1038/nmeth1001. [DOI] [PubMed] [Google Scholar]
- Uhlen M., et al. Mol. Cell. Proteomics. 2005;4:1920–1932. doi: 10.1074/mcp.M500279-MCP200. [DOI] [PubMed] [Google Scholar]
- Uhlen M., Graslund S., Sundstrom M. Nat. Methods. 2008;5:854–855. doi: 10.1038/nmeth1008-854. [DOI] [PubMed] [Google Scholar]
- Vaughan T.J., Williams A.J., Pritchard K., Osbourn J.K., Pope A.R., Earnshaw J.C., McCafferty J., Hodits R.A., Wilton J., Johnson K.S. Nat. Biotechnol. 1996;14:309–314. doi: 10.1038/nbt0396-309. [DOI] [PubMed] [Google Scholar]
- Yaffe M.B. Nat. Rev. Mol. Cell. Biol. 2002;3:177–186. doi: 10.1038/nrm759. [DOI] [PubMed] [Google Scholar]
Associated Data
This section collects any data citations, data availability statements, or supplementary materials included in this article.