
Fig. 4.
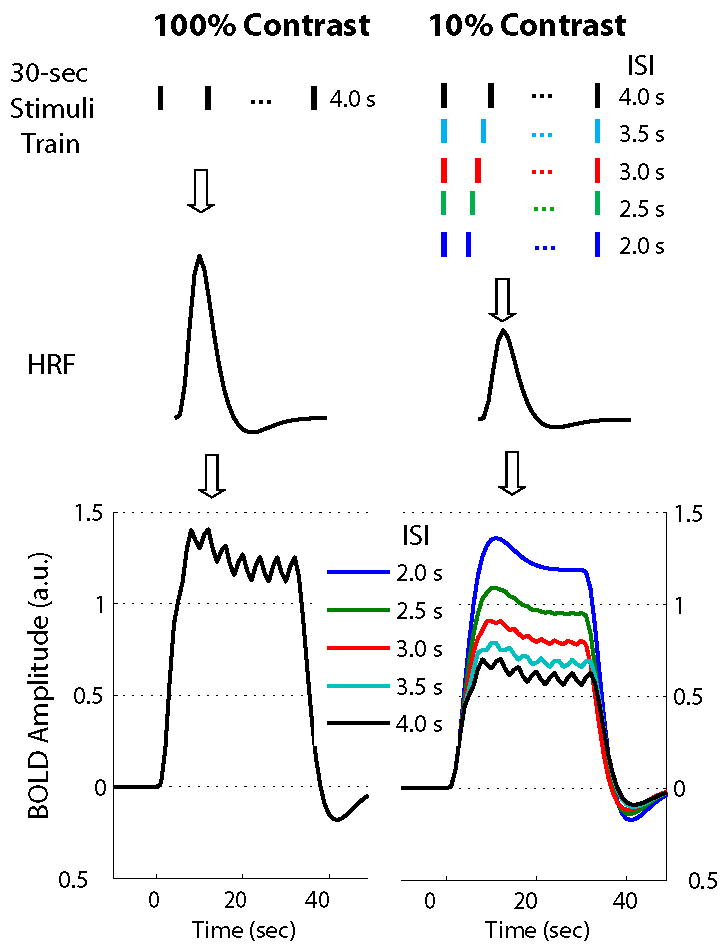
Theoretical comparison between the BOLD-fMRI responses to a 30-s block of 100% (left) and 10% (right) stimuli with various contrasts and ISI, when assuming the BOLD response linearity. These plots are based on the results from computer simulations by assuming the single-stimulus evoked BOLD response amplitude (i.e. the HRF amplitude) for 10% contrast is half as large as that for 100% contrast (as shown in middle). The block BOLD responses (shown in bottom) derived by convolving the stimulus train with variable ISIs (as shown in top) with the respective HRF for both 100% and 10% contrast.