
Fig. 6.
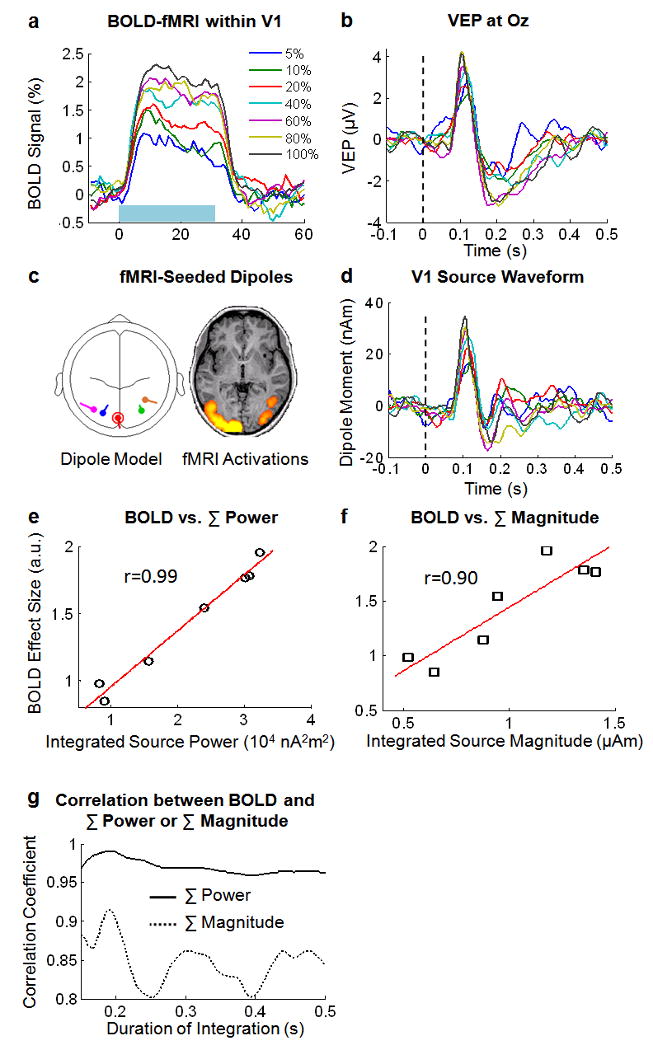
fMRI-EEG coupling. a. BOLD-fMRI signals within V1, induced by a sustained period (30-s, marked by a light blue rectangle) of 2-Hz visual stimuli with seven different contrasts. b. VEP signals at Oz evoked by a single stimulus with variable contrasts. Vertical dashed line represents the stimulus onset. c. fMRI-seeded dipole model. Locations of five dipoles (left) were initiated to the centers of the corresponding ROIs selected from the fMRI activation map (right, p<0.01 corrected). Red-circled dipole represents the dipole in V1. d. Estimated V1 dipole source activity for different contrasts. e & f. Scatter-plot of the BOLD effect sizes within V1 and the integrated power (e) or magnitude (f) of the V1 dipole source, for different visual contrasts. Red lines illustrate linear functions that fit the corresponding scatter points. Data shown in this figure are the average across subjects (n=10). g. Correlations between the BOLD effect size and the integrated source power or magnitude within various post-stimulus periods (0∼150 ms to 0∼500 ms). In a, b and d, visual contrasts are color-coded in a way specified in a.