
Fig. 7.
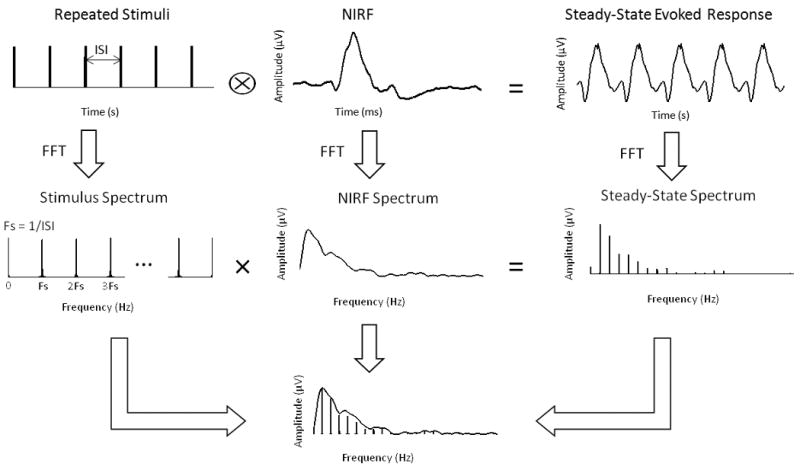
Illustration of the SSVEP spectral analysis. When the steady-state evoked response can be expressed as the result of convolving the stimuli with an equivalent neural impulse response function, the frequency spectrum of the steady-state evoked response equals the spectrum of the stimuli multiplied by the spectrum of the impulse response. By dividing the spectrum of the steady-state evoked response by the stimulus spectrum at the multiples of the stimulus frequency, discrete samples of the impulse response function represented in the frequency domain were obtained. The summation of these discrete samples represents the discrete integral of this spectral profile.