Abstract
Here, we present a detailed analysis of the wing kinematics and wing deformations of desert locusts (Schistocerca gregaria, Forskål) flying tethered in a wind tunnel. We filmed them using four high-speed digital video cameras, and used photogrammetry to reconstruct the motion of more than 100 identified points. Whereas the hindwing motions were highly stereotyped, the forewing motions showed considerable variation, consistent with a role in flight control. Both wings were positively cambered on the downstroke. The hindwing was cambered through an ‘umbrella effect’ whereby the trailing edge tension compressed the radial veins during the downstroke. Hindwing camber was reversed on the upstroke as the wing fan corrugated, reducing the projected area by 30 per cent, and releasing the tension in the trailing edge. Both the wings were strongly twisted from the root to the tip. The linear decrease in incidence along the hindwing on the downstroke precisely counteracts the linear increase in the angle of attack that would otherwise occur in root flapping for an untwisted wing. The consequent near-constant angle of attack is reminiscent of the optimum for a propeller of constant aerofoil section, wherein a linear twist distribution allows each section to operate at the unique angle of attack maximizing the lift to drag ratio. This implies tuning of the structural, morphological and kinematic parameters of the hindwing for efficient aerodynamic force production.
Keywords: kinematics, photogrammetry, angle of attack, camber, locust, morphing
1. Introduction
Insect wings change shape substantially during flapping flight (Wootton 1979). The shape of rigid model wings is known to be important in determining the aerodynamic forces under steady conditions (Vogel 1967; Rees 1975; Nachtigall 1981; Buckholz 1986; Okamoto et al. 1996; Kesel 2000), but attempts to model the effects of static camber and twist under unsteady flow conditions have proven inconclusive (Dickinson & Götz 1993; Sunada et al. 1993; Usherwood & Ellington 2002; Wang et al. 2003). A recent parametric study simulating the effects of wing deformation has shown that camber, and to a lesser degree twist, is indeed important in determining the gross flight performance (Du & Sun 2008). This suggests that detailed quantitative measurements of the wing deformations of real insects will be essential in determining the effects of wing shape upon the aerodynamics of insect flight. Wing deformations have been described qualitatively in many insects (e.g. locusts: Jensen 1956, Baker & Cooter 1979a, Wortmann & Zarnack 1993; hawkmoths: Willmott & Ellington 1997; butterflies: Wootton 1993; craneflies, hoverflies and bees: Ellington 1984), and quantitative measurements of these deformations have been made for several species (dragonflies: Zeng et al. 1996, Song et al. 2001, Wang et al. 2003; moths: Sunada et al. 2002; bumblebees: Zeng et al. 2000). However, the quantitative measurements made to date are limited in spatial resolution, typically giving camber and the angle of incidence at only five spanwise stations along the wing (Walker et al. in press).
Locusts (Orthoptera) have been extensively studied with attention paid to almost all aspects of their flight, from musculature and neurophysiology (e.g. Wilson & Weis-Fogh 1962; Gettrup 1966; Baker & Cooter 1979a) to flight kinematics and forces (e.g. Jensen 1956; Weis-Fogh 1956; Baker & Cooter 1979a,b; Cloupeau et al. 1979; Baker et al. 1981; Nachtigall 1981; Pfau & Nachtigall 1981; Wilkin 1990; Bomphrey et al. 2005). In spite of this, we still lack good quantitative measurements of the camber and the angle of attack distributions across the wing, and of how these change through the wingbeat. Walker et al. (in press) have described a photogrammetric method using high-speed digital video cameras to reconstruct instantaneous topographic maps of the wing surfaces of insects. In this paper, we describe and interpret the detailed kinematics of wingbeats from four desert locusts (Schistocerca gregaria, Forskål). The wing surfaces are reconstructed as a topographical mesh to allow accurate measurements of the deformations that occur during flight. We examine in detail how the camber, the angle of attack and the surface area of the wing vary through the stroke. We then discuss how these deformations are produced, and consider their likely significance for aerodynamics, stability and control.
2. Materials and methods
2.1. Wing kinematics measurements
The methods used are those described in Walker et al. (in press), so we provide only a brief summary here. Desert locusts were tethered by the ventral thorax in a wind tunnel designed specifically for insect flight experiments. The wind speed was set to 3.3 m s−1 and the locust was set at a body angle of 9° (measured from the underside of the thorax relative to the free stream). These conditions are close to the equilibrium flight speed and body angle for this species (Taylor & Żbikowski 2005). Two NAC Hi-DCam II cameras (NAC Image Technology, CA, USA) with Nikkor 50 mm lenses and two Photron Ultima APX cameras (Photron Ltd, Bucks, UK) with Nikkor 60 mm macro lenses were used for filming. Two cameras were positioned above and behind the tethered locust and the other two cameras were positioned beneath and to the right of the locust. This gave good views of the right side of the locust with minimal overlap of the forewings and the hindwings. Two ARRI 125W pocket lights (Arnold & Richter Cine Technik GmbH & Co. Betriebs KG, Munich, Germany) were pointed onto white cards on the other side of the locust to provide backlighting. The lights were aligned with the centre line of the wind tunnel to reduce steering by the locust. The cameras were triggered manually when the locust was flying in the complete flight posture (Weis-Fogh 1956) and were set to record for 1000 frames at 974 frames per second. A shutter speed of less than 100 μs was used in each camera, which was sufficient to eliminate motion blur. In total, we used two male and two female locusts (hereafter called L1, L2, L3 and L4), analysing the first five complete wingbeats from 10 separate recordings, giving a total of 50 wingbeats.
Custom-written software in Matlab (Matlab v. 7.4, The Mathworks Inc., Natick, MA) was used to calibrate the cameras. Full details of the calibration can be found in Walker et al. (in press), but briefly the method involves a bundle adjustment, which uses a nonlinear least-squares solver to produce jointly optimal estimates of the camera parameters and the spatial coordinates of points on a two-dimensional calibration grid in a range of positions and orientations. A combination of manual and semi-automatic tracking was used to identify the image coordinates of approximately 100 marked points on the hindwings and of approximately 15 natural features on the forewings. The estimated spatial coordinates of these points had a mean absolute error of approximately 0.11 mm (Walker et al. in press). The coordinates of the identified points were then forwards–backwards filtered using a third-order low-pass Butterworth filter with a −3 dB cut-off frequency of 150 Hz. This was chosen by autocorrelation analysis as the lowest filter frequency that did not remove any underlying signal from the data. Finally, cubic splines were fitted to points lying along the wing veins or outline, and an interpolated 100×100 point mesh was fitted to these splines to provide the wing surface map.
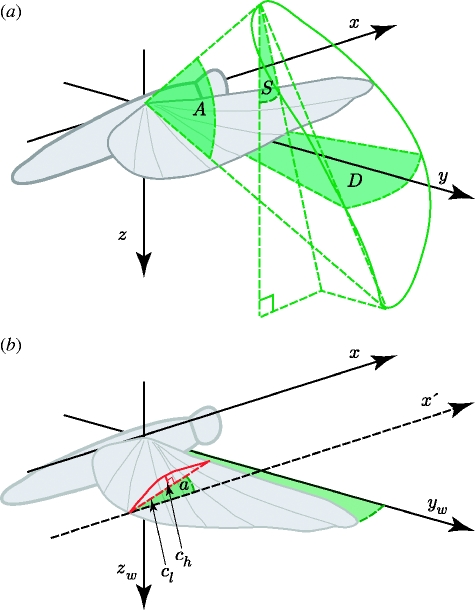
All of the spatial measurements we present for each wing are given in a right-handed laboratory-fixed frame of reference (x,y,z), centred on the wing root, in which the x-axis points opposite to the free-stream velocity vector and the z-axis points vertically down (figure 1a). The local angle of incidence and the camber of each wing were measured with respect to a rotating frame of reference (x,yw,zw) sharing the same x-axis as the laboratory-fixed frame, but rotating about this axis such that the line joining the wing root and tip always lies in the xyw-plane (figure 1b). Defining camber and the angle of incidence with respect to this rotating frame of reference allows us to control for the effects of changing wing-tip elevation on the angle of attack and camber. The local angle of incidence was defined as the angle between the xyw-plane and the line joining the leading and trailing edge parallel to the xzw-plane. The standard deviation of the error in the angle of incidence measurements was an inverse function of the local chord length, but was at worst 0.51° (Walker et al. in press). The local angle of attack was defined as the angle between the line joining the leading and trailing edge, and the local relative air velocity at the mid-chord point, both drawn parallel to the xzw-plane of the rotating frame of reference. This takes account of both the local wing velocity and the free-stream velocity, and provides our best estimate of the true aerodynamic angle of attack, although it does not take into account the effects of the induced flow.
Figure 1.
(a) Definition sketch of wing-tip kinematic parameters with respect to the laboratory-fixed frame of reference (x,y,z). This forms a right-handed coordinate system with the x-axis aligned opposite to the free-stream velocity vector and the z-axis pointing vertically downward. The solid green line marks the wing-tip path. The stroke plane angle (S) is defined as the angle between the z-axis and the projection onto the xz-plane of the line joining the wing-tip positions at the top and bottom of the stroke. The stroke amplitude (A) is defined as the angle between the lines joining the wing root to the wing tip at the top and bottom of the stroke. The deviation angle (D) is defined as the angle between the lines joining the wing root to the wing tip as the wing passes through the horizontal on the downstroke and the upstroke, respectively. (b) Definition sketch of the wing camber and the angle of incidence with respect to a frame of reference rotating with the wings (x,yw,zw). This axis system has the same x-axis as the laboratory-fixed frame, but rotates about this axis such that the line joining the wing root and tip always lies in the xyw-plane. The local angle of incidence (angle a) was defined as the angle between the xyw-plane and the line joining the leading and trailing edge parallel to the xzw-plane. The local camber was defined as the ratio of the mid-chord height (ch), measured parallel to the zw-axis, to the chord length (cl) parallel to the x-axis. Defining the camber and the angle of incidence with respect to this rotating frame of reference removes the effects of changing wing-tip elevation on these variables.
The local camber was defined as the ratio of the mid-chord height, measured parallel to the zw-axis of the rotating frame of reference, to the chord length parallel to the x-axis (figure 1b). We used the mid-chord height rather than the maximum chord height in defining the camber, because the complicated corrugated shape of the wings means that the maximum chord height changes discontinuously at times, and so does not reflect the continuous changes in the camber of the aerofoil as a whole.
2.2. Smoke wire flow visualization
In a separate experiment, a single locust was flown tethered under the same flight conditions, and used for a smoke visualization analysis of the induced flow. One Photron APX camera with a 50 mm Nikkor lens was positioned to give a lateral view of the tethered locust. Smoke lines were generated using Johnson's baby oil on an electrically heated 0.1 mm nichrome wire. Two ARRI pocket lights were used to backlight the smoke. Recordings were made at 1000 fps of smoke incident at each of four spanwise stations along the wing. Custom-written software in Matlab was used to measure the angle of the smoke lines just ahead of the forewing leading edge, and the change in this angle through the wingbeat was used to provide a measure of the changes in the induced flow. In total, we analysed 36 wingbeats. For each frame, a Canny edge detector (Canny 1986) was used to determine the image coordinates of the edges surrounding the smoke lines. The local angle of the smoke line at each image coordinate was then determined from the vector formed by the horizontal and vertical intensity gradients, calculated using a Sobel operator (Parker 1997), from which the mean angle of the smoke lines was calculated.
3. Results
3.1. Wing-tip kinematics
Figure 2 plots lateral views of the wing-tip paths for the four locusts to provide a qualitative indication of the variation between and within individuals. It is clear that whereas the hindwing path is relatively consistent between and within individuals, the forewing tip path shows considerably more variation between individuals. This variation is quantified in table 1, which gives the mean and standard deviation of various wing-tip kinematic parameters measured in the laboratory-fixed frame of reference (figure 1).
Figure 2.
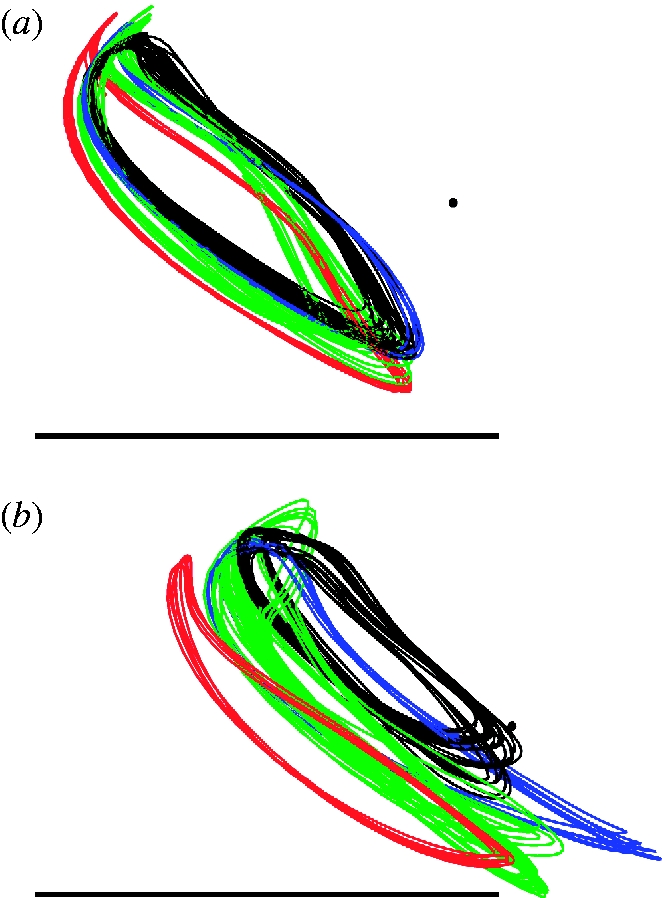
Lateral projection onto the xz-plane of the right wing-tip paths of the (a) hindwing and (b) forewing for the four locusts (red, L1; green, L2; blue, L3; black, L4). The black dot denotes the position of the wing root. All distances are normalized by the wing length to enable comparison among individuals. The scale bars denote wing length. The anterior of the insect points to the right. The wing tips move in the clockwise direction along the path through the stroke. Note that the wing-tip paths are highly stereotyped between and within individuals for the hindwing, but show considerable variation for the forewing.
Table 1.
Mean±standard deviation for summary wing-tip kinematic parameters for each locust, and for all of the locusts combined. (The forewing shows significantly more variation than the hindwing with respect to most of the wing-tip kinematic parameters (see the text for statistical analysis). The downstroke duration is defined as the proportion of the wingbeat period during which the wing moves in a downward direction. The stroke plane angle is defined as the angle between the z-axis and the projection onto the xz-plane of the line joining the wing-tip positions at the top and bottom of the stroke. The stroke amplitude is defined as the angle between the lines joining the wing root to the wing tip at the top and bottom of the stroke. The deviation angle is defined as the angle between the lines joining the wing root to the wing tip as the wing passes through the horizontal on the downstroke and upstroke, respectively (figure 1).)
| downstroke duration (%) |
stroke plane angle (°) |
stroke amplitude (°) |
deviation angle (°) |
|||||
|---|---|---|---|---|---|---|---|---|
| locust (wingbeats) | fore | hind | fore | hind | fore | hind | fore | hind |
| L1 (5) | 56.1±0.9 | 56.6±0.7 | 34.1±0.7 | 26.0±0.2 | 80.0±1.3 | 80.9±1.3 | 9.2±0.4 | 20.3±1.4 |
| L2 (20) | 61.6±1.0 | 58.5±1.6 | 28.4±2.0 | 22.9±1.1 | 80.5±3.8 | 79.2±5.9 | 9.8±2.5 | 17.7±1.0 |
| L3 (5) | 55.9±1.7 | 57.2±0.2 | 39.0±0.8 | 27.7±0.3 | 85.0±2.6 | 86.3±1.9 | 12.3±1.2 | 18.3±0.6 |
| L4 (20) | 61.3±1.6 | 55.6±1.5 | 33.2±2.0 | 28.2±1.0 | 57.8±3.3 | 75.6±2.8 | 11.9±0.8 | 21.0±1.4 |
| overall mean | 58.4±2.6 | 57.0±1.9 | 31.9±3.8 | 25.8±2.7 | 71.8±12.1 | 78.8±5.3 | 10.8±2.0 | 19.4±1.9 |
The downstroke duration is defined as the proportion of the wingbeat period during which the wing moves in a downward direction. The stroke plane angle is defined as the angle between the z-axis and the projection onto the xz-plane of the line joining the wing-tip positions at the top and bottom of the stroke (figure 1). The stroke amplitude is defined as the angle between the lines joining the wing root to the wing tip at the top and bottom of the stroke (figure 1). The deviation angle is defined as the angle between the lines joining the wing root to the wing tip as the wing passes through the horizontal on the downstroke and upstroke, respectively (figure 1). The stroke plane angles we measured for the forewing and the wing-tip path for both wings are similar to those measured for free-flying locusts (Baker & Cooter 1979a).
All of these summary parameters show greater variation for the forewing than for the hindwing across individuals, and the same is true in most cases within individuals. We tested these differences in variance statistically using the Brown–Forsythe version of the classical Levene's test for equality of variance (Brown & Forsythe 1974), which is robust to deviations from normality in the underlying distributions. Lumping all of the data together, the variance is significantly higher for the forewing than the hindwing with respect to the stroke plane angle, the stroke amplitude and the downstroke duration (one-tailed, p=0.007, p<0.001, p=0.038, respectively). Among the four wing-tip kinematic parameters we tested, only the deviation angle had a variance that was not significantly greater for the forewing than the hindwing (one-tailed, p=0.412).
3.2 Projected area of the hindwing
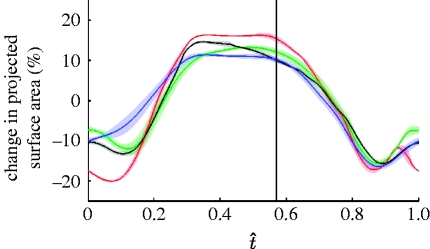
The hindwing is a corrugated, fan-like structure that folds into the body when the locust is at rest, and changes area continuously through the course of the wingbeat. During the upstroke, as the backward sweep of the wing increases, its proximal sections fold into the body and the more distal sections corrugate, resulting in a substantial decrease in the projected area. This is quantified in figure 3, which plots the change in the projected area of the hindwing through the course of the wingbeat (measured relative to the xy-plane of the rotating frame of reference). The projected area is of the order of 30 per cent smaller during the upstroke (when the wing has a negative angle of attack and takes negative loads) than during the downstroke (when the wing has a positive angle of attack and generates useful lift).
Figure 3.
Percentage change in projected area of the hindwing through the wingbeat for the four locusts. The solid lines show the instantaneous mean for each locust (red, L1; green, L2; blue, L3; black, L4) and the shaded region around those lines displays the instantaneous standard deviation. The hindwing downstroke begins at t̂=0 and ends at approximately the point denoted by the vertical line, which marks the mean start time of the hindwing upstroke. The wing is swept forwards during the downstroke, increasing the wing area to reach its maximum mid-downstroke. During the upstroke, the wing is swept back, causing the basal regions to fold into the body and causing the rest of the wing to corrugate, thereby reducing the area to its minimum by the late-upstroke.
3.3. Wing camber
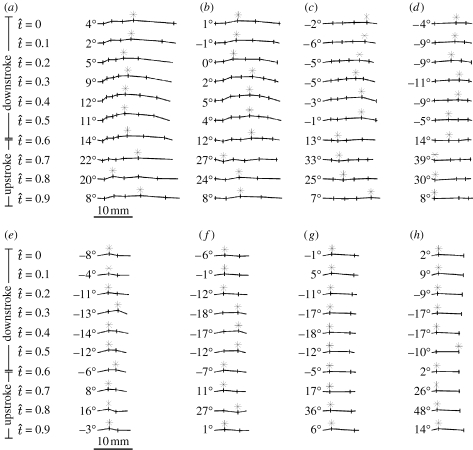
Figure 4 shows how the instantaneous wing profile varies through the wingbeat at 20, 40, 60 and 80 per cent wing length for locust L4. The stage of the stroke is denoted by the normalized time t̂, which is defined as the time after the start of the downstroke divided by the wingbeat period. There are substantial changes in wing profile, both through the course of the wingbeat and along the wing. In general, the wings are flatter at the tip, and the camber on the hindwing is further aft on the more distal portions of the wing, as shown by the position of the asterisk marking the point of maximum camber in figure 4. The hindwing has strong positive camber throughout the downstroke (t̂=0.0–0.6), although the leading edge is reflexed upward throughout the downstroke on the inner portions of the wing. These inner portions of the wing become notably corrugated during the upstroke (t̂=0.7–0.9). The forewing is positively cambered throughout the stroke, but shows the classic ‘z-profile’ described by Jensen (1956) during the later stages of the upstroke and the early downstroke (t̂=0.8–1.0). These features are most prominent in the proximal portion of the forewing, and are clearly visible at 20 per cent wing length, but as with the hindwing, the forewing relief becomes less pronounced moving towards the tip.
Figure 4.
Wing profile sections through the wingbeat and across the wing for the (a–d) hindwing and (e–h) forewing of locust L4. ((a,e) 20% wing length, (b,f) 40% wing length, (c,g) 60% wing length and (d,h) 80% wing length.) These profile sections are typical of all the locusts that we made measurements for. The leading edge of the wing is at the left of each profile. The vertical bars through the sections indicate the positions of major wing veins. The asterisks denote the location of the maximum absolute chord height, the position of which varies discontinuously through the stroke. Note the decrease in the camber along the wing, and the marked changes in the camber through the stroke. See the text for discussion. The angle to the left of each profile section is the instantaneous local angle of incidence.
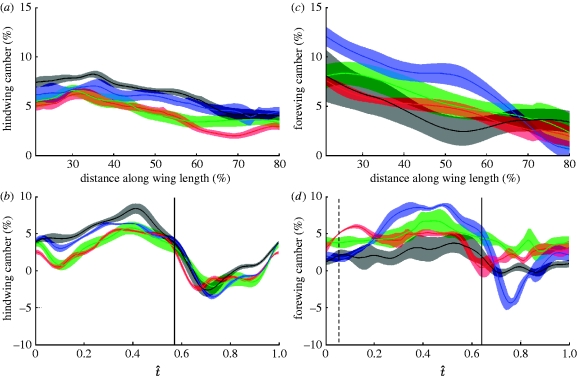
These changes in wing profile are quantified in our measurements of local instantaneous camber. Figure 5a,c plots camber against distance along the wing for each locust at the mid-downstroke (t̂=0.3), averaged across wingbeats. The shaded region around each line represents the standard deviation and provides a measure of the variation between wingbeats within an individual. Both the forewing and the hindwing mesh models show a decrease in camber from root to tip at this point mid-downstroke, with a comparably strong negative correlation in both cases (product moment correlation coefficients: −0.72 for the hindwing and −0.68 for the forewing). Figure 5b,d plots the instantaneous camber at 50 per cent wing length against normalized time. The hindwing camber is positive throughout the downstroke, reaching a maximum of 8 per cent late in the downstroke (t̂=0.4). During the upstroke the camber becomes negative, reaching a minimum of −4 per cent at t̂=0.75. The forewing is positively cambered for the entire wingbeat except for in locust L3, which is negatively cambered during the upstroke, reaching a minimum of −4 per cent The forewing camber increases until late in the downstroke at t̂=0.4, when it reaches a maximum of 8 per cent.
Figure 5.
The average camber (a,c) across the wing and (b,d) through the wingbeat for the (a,b) hindwing and (c,d) forewing of the four locusts. The solid lines show the mean instantaneous camber for each locust (red, L1; green, L2; blue, L3; black, L4) and the shaded region around those lines displays the instantaneous standard deviation. (a,c) The camber at the mid-downstroke against percentage distance along the wing. Both wings show a negative correlation between the camber and the percentage distance along the wing. (b,d) The camber at 50% wing length against normalized time. The solid vertical line indicates the mean timing of the end of the hindwing downstroke in (b) and the mean timing of the end of the forewing downstroke in (d). The dashed vertical line indicates the average start time of the forewing downstroke in (d). Camber increases during the downstroke until t̂=0.4, when it reaches a maximum of approximately 8% for both wings. Camber is negative during the upstroke for the hindwing, but is only negative for one locust (L3) for the forewing.
In order to test for the consistency of our camber measurements within and between individuals, we calculated the product moment correlation coefficients between wingbeats of the local instantaneous camber through the wingbeat for each of 60 spanwise stations between 20 and 80 per cent wing length. We excluded spanwise stations near the wing root and tip from this correlation analysis because the measurement error is inversely related to the chord length, and because folding of the hindwing near the base can generate spurious results. The mean of all pairwise correlation coefficients between wingbeats within the same individual was 0.95 for the hindwing and 0.57 for the forewing, while the mean of all pairwise correlation coefficients between wingbeats from different individuals was 0.88 for the hindwing and 0.29 for the forewing (table 2). These results indicate that the changes in hindwing camber through the stroke are highly correlated between wingbeats, both within and between individuals. By contrast, the changes in the forewing camber through the stroke are much less highly correlated within individuals, and even less correlated between individuals. Hence, the changes in camber through a wingbeat are highly consistent for the hindwing, but much less consistent for the forewing. This demonstrates that as well as changing its tip trajectory to a greater extent than the hindwing (see §3.2), the forewing also changes the detailed properties of its relief to a greater extent than the hindwing from one wingbeat to the next.
Table 2.
Correlation analysis to test for the consistency of the instantaneous local camber, the angle of incidence and the angle of attack of the forewing and the hindwing within and between individuals. (The camber, the angle of incidence and the angle of attack are all highly consistent for the hindwing both between and within individuals. The forewing shows relatively little variation in the angle of incidence and the angle of attack within individuals, but is highly variable between individuals. The forewing camber shows relatively little consistency either between or within individuals. See the text for further explanation.)
| mean correlation coefficient |
||
|---|---|---|
| within individuals | between individuals | |
| hindwing camber | 0.95 | 0.88 |
| forewing camber | 0.57 | 0.29 |
| hindwing angle of incidence | 0.98 | 0.95 |
| forewing angle of incidence | 0.96 | 0.84 |
| hindwing angle of attack | 0.98 | 0.93 |
| forewing angle of attack | 0.86 | 0.66 |
3.4. Angle of incidence
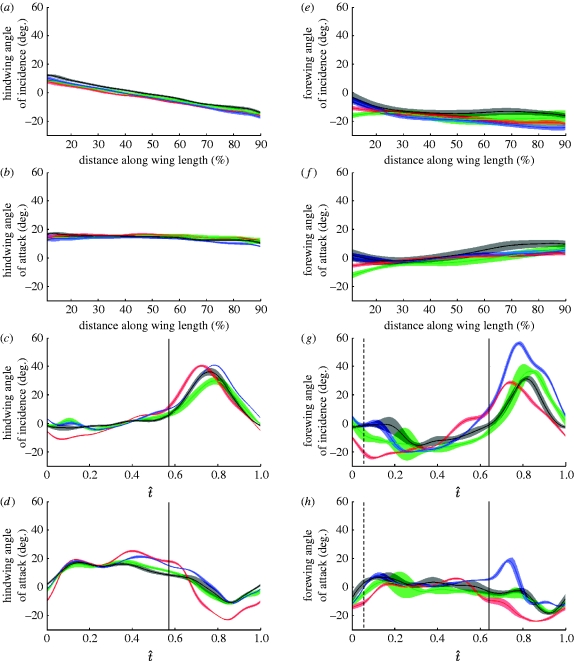
Figure 6a,e plots the angle of incidence (i.e. geometric angle of the chord relative to the xy-plane of the rotating frame of reference) against the distance along the wing for each locust at the mid-downstroke (t̂=0.3), averaged across all of the measured wingbeats. The shaded region around each line represents the standard deviation and provides a measure of the variation between wingbeats. Both the forewing and the hindwing display washout: the hindwing shows an approximately linear decrease in the angle of incidence with distance along the wing (figure 6a: linear regression slope of −0.30, R2=95%), while the forewing angle of incidence shows a much weaker and more curvilinear negative correlation (figure 6e: linear regression slope of −0.09, R2=22%). Note that we use linear regression only as a tool for parameter fitting, and not as a statistical test of significance: statistical analysis of these data is confounded by the non-independence of the points in the fitted mesh (both regressions are highly significant when adjacent fitted points in the mesh are treated as if they were statistically independent).
Figure 6.
The angle of incidence and the angle of attack (c,d,g,h) through the wingbeat and (a,b,e,f) across the wing for the (a–d) hindwing and (e–h) forewing of the four locusts. The solid lines show the mean instantaneous angle for each locust (red, L1; green, L2; blue, L3; black, L4) and the shaded region around the lines displays the instantaneous standard deviation. (a,e) The angle of incidence against distance along the wing length at mid-downstroke. (b,f) The angle of attack against distance along the wing length at mid-downstroke. (c,g) The angle of incidence at 50% wing length against normalized time. (d,h) The angle of attack at 50% wing length against normalized time. The vertical dashed line in (g,h) indicates the average start time of the forewing downstroke. The vertical solid line indicates the mean timing of the end of the hindwing downstroke in (c,d) and the mean timing of the end of the forewing downstroke in (g,h). The hindwing shows a linearly decreasing angle of incidence along its length (a), which results in an approximately constant angle of attack across the wing (b). See the text for further discussion.
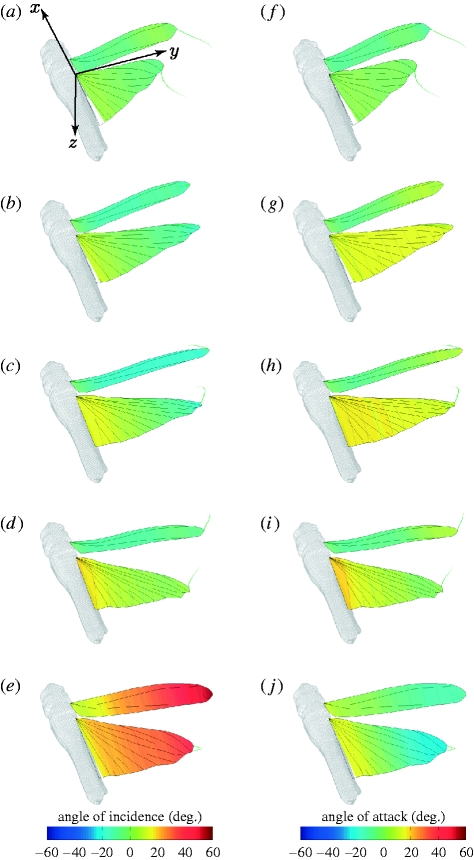
Figure 6c,g plots how the hindwing and forewing angles of incidence change through the wingbeat at 50 per cent wing length for each locust. The hindwing shows relatively little change in the angle of incidence during the downstroke, with the angle of incidence close to 0° at the midpoint of the wing. During the upstroke, the angle of incidence increases, reaching up to 40° at the mid-upstroke (t̂=0.8) at the midpoint of the wing. The forewing angle of incidence is much more varied during the downstroke than that of the hindwing, and is typically negative, reaching as low as −25°. During the upstroke, the forewing increases its angle of incidence, reaching angles greater than 40° at the mid-upstroke (t̂=0.8). Hence, the forewing rotates about its spanwise axis to a far greater extent than the hindwing does. All of these features are visible in the three-dimensional visualization of locust L4 in figure 7, which illustrates how the local angle of incidence varies across the wing at five different stages of the wingbeat.
Figure 7.
Three-dimensional projection of locust L4 to show how (a–e) the angle of incidence and (f–j) the angle of attack of the wings vary across the wings at five different stages of a single wingbeat ((a,f) t̂=0.0, (b,g) t̂=0.2, (c,h) t̂=0.36, (d,i) t̂=0.56, (e,j) t̂=0.76). In (a–e), the wings are coloured by the angle of incidence. In (f–j), the wings are coloured by the angle of attack. A scaled model of the locust body is also shown for reference. The green wisps at the wing tips show the immediate time history of the wing-tip position to convey a sense of the wing's motion. At the upper and lower stroke reversals ((a,d) and (f,i), respectively), the angle of incidence is similar to the angle of attack, due to the limited movement of the wing. During the downstroke (b,c,g,h), the strong spanwise twist of the hindwing results in a constant angle of attack, whereas the limited twist of the forewing results in negative angle of attack near the wing root. During the upstroke (e,j), the sign of the angle of attack is opposite in sense and magnitude to the angle of incidence.
In order to test for the consistency of our angle of incidence measurements within and between individuals, we calculated the product moment correlation coefficients between wingbeats of the local instantaneous angle of incidence through the wingbeat for each of 80 spanwise stations between 10 and 90 per cent wing length. The mean of all pairwise correlation coefficients between wingbeats within the same individual was 0.98 for the hindwing and 0.96 for the forewing, while the mean of all pairwise correlation coefficients between wingbeats from different individuals was 0.95 for the hindwing and 0.84 for the forewing (table 2). These results indicate that the changes in the angle of incidence through the stroke are highly correlated between wingbeats for both the hindwing and the forewing, both within and between individuals. Hence, the changes in the angle of incidence through the wingbeat are highly consistent for both wings (cf. changes in camber).
3.5. Angle of attack
Figure 6b,f plots the angle of attack against distance along the wing for each locust at the mid-downstroke (t̂=0.3), averaged across all measured wingbeats. The shaded region around each line represents the standard deviation and provides a measure of the variation between wingbeats. The hindwing has an approximately constant angle of attack of 15° along its entire length (figure 6b): the linear regression of the angle of attack against distance along the wing has a slope of just −0.04 (R2=29%), which is an order of magnitude smaller than the slope of −0.30 for the angle of incidence (R2=95%). Hence, the linear increase in the angle of attack from the root to the tip, which would occur for an untwisted wing in a root-flapping motion, is almost exactly counteracted by the washout distribution of spanwise twist from the root to the tip. This is visible in figure 7, which clearly reveals the constancy of the angle of attack across the hindwing, and through the downstroke, for locust L4. By contrast, the forewing displays an increase in the angle of attack from the root to the tip: the linear regression of the angle of attack against distance along the wing has a slope of 0.17 (R2=52%), which is similar in magnitude, but of opposite sign, to the slope of −0.09 for the angle of incidence (R2=22%) of the forewing. This results in a negative angle of attack as low as −10° in proximal parts of the wing, and a positive angle of attack as high as 10° in distal portions.
Figure 6d,h plots how the hindwing and forewing angle of attack change through the wingbeat at 50 per cent wing length for each locust. The angle of attack at this point on the hindwing increases rapidly from approximately 0° at the start of the downstroke (t̂=0.0), after which it fluctuates within the range 15–20° until the mid-downstroke (from t̂=0.1 to 0.3), with a local minimum reliably observed at approximately t̂=0.25. The hindwing displays much greater variability in the angle of attack during the latter half of the downstroke. The hindwing angle of attack drops sharply just after the beginning of the upstroke, becoming negative for the majority of the upstroke at the midpoint of the wing. The forewing angle of attack also increases rapidly at the start of the downstroke and fluctuates within a broad envelope of values through the downstroke (approx. −10° to 10° at the midpoint of the wing), showing considerable variation both within and between individuals. In three of the individuals, the forewing angle of attack dropped sharply at the beginning of the upstroke and remained negative for the majority of the upstroke. However, one individual used different forewing kinematics on the upstroke, displaying a sharp increase in the angle of attack at the start of the upstroke.
In order to test for the consistency of our angle of attack measurements within and between individuals, we calculated the product moment correlation coefficients between wingbeats of the local instantaneous angle of attack through the wingbeat for each of 80 spanwise stations between 10 and 90 per cent wing length. The mean of all pairwise correlation coefficients between wingbeats within the same individual was 0.98 for the hindwing and 0.86 for the forewing, while the mean of all pairwise correlation coefficients between wingbeats from different individuals was 0.93 for the hindwing and 0.66 for the forewing (table 2). These results indicate that the changes in the angle of attack through the stroke are highly correlated between wingbeats for the hindwing. In the case of the forewing, the angle of attack is highly correlated within individuals, but is rather more variable between individuals. Hence, the changes in the angle of attack through the wingbeat are highly consistent for the hindwing, but less consistent for the forewing. This reflects inter-individual differences in wing-tip kinematics—particularly, the stroke amplitude (table 1), which linearly affects the increase in velocity, and hence the angle of attack, along the wing.
3.6. Smoke visualization
The aerodynamic angle of attack is calculated directly from our measurements of the wing kinematics, and takes no account of the induced flow. Although it is possible to estimate the induced flow for an isolated wing in steady conditions, e.g. using lifting-line theory, the unsteady aerodynamics and presence of tandem wing interactions in the locust make it difficult to estimate the induced flow theoretically. We, therefore, used our smoke visualization experiments to estimate the order of magnitude of changes in the induced flow.
In a steady flow, neglecting buoyancy effects, the direction of a smokeline is the same as the direction of the local flow, and can be used to infer the local streamline direction. In an unsteady flow, the local direction of a smokeline reflects the integrated time history of the flow, and cannot therefore be used to infer the local instantaneous streamline direction. Nevertheless, local changes in the direction of the smokeline should directly correspond to local changes in the flow, and can therefore be used to infer the associated change in the local instantaneous streamline direction. We made use of this to estimate the periodic changes in the flow induced immediately ahead of the insect. At the start of the downstroke, the region of interest in which we measured the angle of the smokelines was centred approximately three quarters of a chord ahead of the quarter chord point of the forewing and hindwing combined. Using the concept of a bound vortex centred on the mean quarter chord point, the upwash in the region of interest is expected, by axisymmetry, to be of comparable magnitude to the downwash at the trailing edge of the wing (Crawford et al. 1996). The latter is the value of the downwash used in calculations of induced incidence, so in very approximate terms, the change in the angle of the flow in the region of interest ahead of the wing is expected to be of similar magnitude, but opposite sign, to the change in the induced angle of incidence.
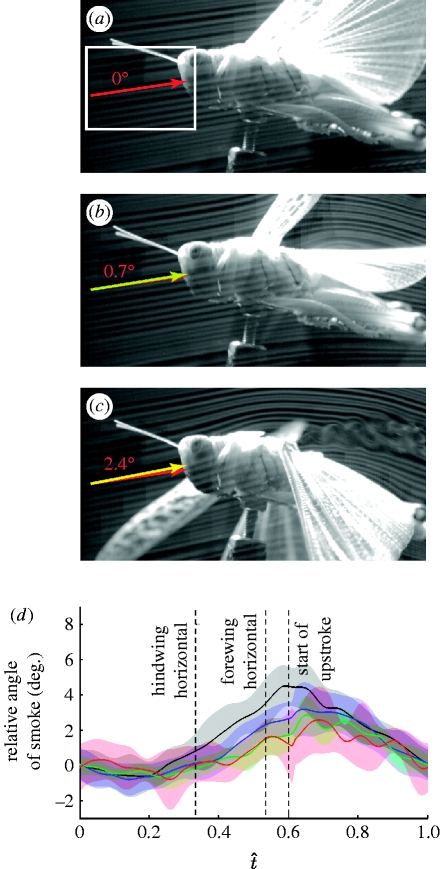
Figure 8a–c shows a tethered locust at three stages during the downstroke. The insect is positioned so that the smokelines are incident at 50 per cent of the hindwing length at the middle of the downstroke. The local direction of the smokelines in the region of interest at the start of the downstroke (figure 8a, t̂=0.0) is shown by the red arrow, while the local direction at other stages of the wingbeat is indicated by the yellow arrow. By the point at which the hindwing is horizontal (figure 8b, t̂=0.33), the local inclination of the smokelines has increased by approximately 0.7° from their inclination at the start of the downstroke, corresponding to an equivalent increase in the induced flow angle. The equivalent value when the forewing is horizontal (figure 8c, t̂=0.55) is 2.4°. Figure 8d plots the mean change in smokeline direction relative to the start of the downstroke against normalized time for four positions along the hindwing.
Figure 8.
(a–c) Smoke visualization of a tethered locust at three stages of the downstroke. (a) t̂=0.0: beginning of the downstroke; (b) t̂=0.33: mid-downstroke, when the hindwing is horizontal; and (c) t̂=0.55: late downstroke, when the forewing is horizontal. The smoke lines are positioned to meet the hindwing at 50% of its length when the wing is horizontal. The red arrows indicate the angle of the smoke at the start of the downstroke. The yellow arrows show the instantaneous angle of the smoke. The angle between the red and the yellow arrows indicates the change in the induced flow since the start of the downstroke. The graph in (d) plots the change in smoke angle against the normalized time based on automated measurement of the change in the angle of the smoke relative to the start of the downstroke. The white rectangle in (a) indicates the region of interest for the automated angle analysis. The solid lines denote the mean instantaneous change in smoke angle at four distances along the wing length(black, 20%; blue, 40%; green, 60%; red, 80%), and the shaded region around those lines displays the instantaneous standard deviation at that point on the wing. The amplitude of the periodic change in the induced flow is greatest near the wing root (d), where the amplitude is still less than 2.5°. This is an order of magnitude smaller than the periodic changes in the wing angle of attack (figure 6c,f). It is therefore reasonable to base aerodynamic inferences about the effects of periodic wing deformations upon our kinematic measurements of periodic changes in the wing angle of attack, albeit that these do not exactly measure the true effective aerodynamic angle of attack.
Although these changes in smokeline direction do not allow us to infer the instantaneous induced angle of the flow, they do provide an estimate of how the induced flow angle changes periodically through the wingbeat, and also of how these periodic changes vary along the wing. The amplitude of the periodic change in the induced flow is greatest near the wing root (figure 8d), where the amplitude is less than 2.5°. Hence, the periodic changes in the induced angle of incidence are an order of magnitude smaller than the periodic changes in the wing angle of attack (figure 6c,f). It is therefore reasonable to base aerodynamic inferences about the effects of periodic wing deformations upon our kinematic measurements of periodic changes in the wing angle of attack, albeit that these do not exactly measure the true effective aerodynamic angle of attack.
4. Discussion
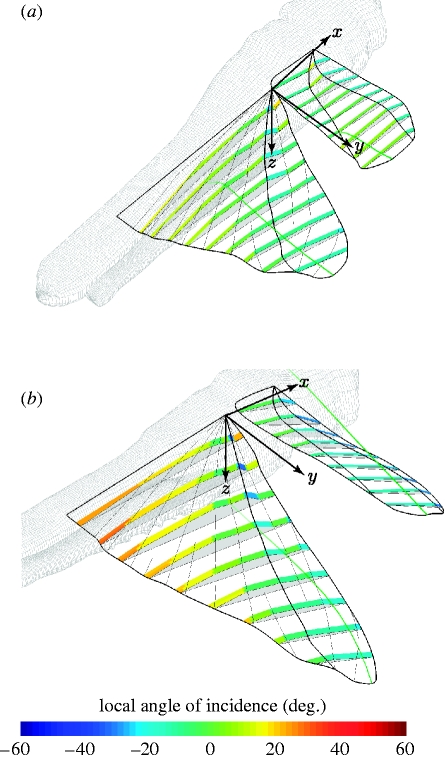
Figure 9 shows the wings of locust L4 at the early (figure 9a: t̂=0.2) and the late (figure 9b: t̂=0.4) downstroke, to illustrate the morphological basis of twist and camber generation in both wings. Nine chordwise rows of mesh elements are illustrated, and are coloured according to the angle that each individual mesh element makes with the xyw-plane of the rotating frame of reference. This allows us to visualize the contribution that each element makes to the local twist and the camber distribution. Since the mechanisms of twist and camber generation are quite different, we discuss the hindwing and the forewing separately. Our anatomical nomenclature follows that of Wootton (1979). Functionally, we treat the hindwing as comprising two parts: a relatively stiff anterior panel called the remigium, posterior to which lies the vannal fan, or vannus, separated from the remigium by the claval furrow (figure 10). We treat the forewing as comprising three functional parts: the anterior and posterior panels of the remigium, separated by the median flexion line, and the clavus, which lies posterior to the claval furrow (figure 10).
Figure 9.
Morphological basis of twist and camber generation. The figure shows the forewing and hindwing of locust L4 at the (a) early and (b) late downstroke (t̂=0.2 and 0.4, respectively). The green wisps at the wing tips show the immediate time history of the wing-tip position to convey a sense of the wing's motion. Nine local aerofoil sections are shown to illustrate the camber distribution. The chordwise mesh elements for each section are coloured according to their own local angle of incidence to illustrate the twist distribution. Early in the downstroke (a), the positive camber of the hindwing results from the negative incidence of its remigium (figure 10) relative to the rest of the hindwing. Similarly, the positive camber of the forewing early in the downstroke results from the negative incidence of the anterior panel of its remigium relative to the rest of the forewing. Late in the downstroke (b), the positive camber of the hindwing is increased by the umbrella effect operating in the vannus (figure 10; see the text for discussion). The positive camber of the forewing is sharply increased at this stage of the stroke by the rotation of the clavus (figure 10).
Figure 10.
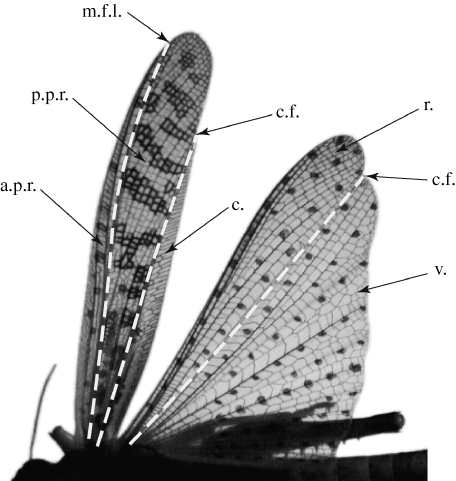
Primary flexion lines of the locust forewing and hindwing, shown mid-downstroke. The black spots on the hindwing are artificially marked points, whose position we reconstruct using photogrammetry. The hindwing is treated as having two distinct functional parts: the stiff anterior remigium, which lies anterior to the claval furrow (dashed line), and the posterior region, called the vannal fan, or vannus. The forewing is treated as comprising three functional parts: the anterior and posterior panels of the remigium, separated by the median flexion line, and the clavus which lies posterior to the claval furrow. c., clavus; c.f., claval furrow; a.p.r., anterior panel of the remigium; p.p.r., posterior panel of the remigium; r., remigium; m.f.l., median flexion line; v., vannus. Anatomical nomenclature after Wootton (1979).
4.1. Hindwing kinematics
Throughout the downstroke (figure 9a,b), the remigium operates at a lower angle of incidence than the vannal fan, and undergoes relatively little deformation. By contrast, the vannal fan exhibits a substantial increase in camber through the downstroke (compare figure 9b at t̂=0.2 with figure 9a at t̂=0.4), as the trailing edge is pulled taut by promotion of the wing (see figure 3, which indicates that the trailing edge will become taut at approximately t̂=0.3, as the wing reaches its maximum area). This is evidence for the operation of the so-called ‘umbrella effect’ (Wootton 1995; Wootton et al. 2000, 2003), which arises because the curvature of the trailing edge induces compressive forces in the radial veins of the vannus when the trailing edge is put under tension by promotion of the hindwing. This compression leads to Euler buckling of the radial veins (Wootton 1995), and is presumably the principal source of the positive camber that we have measured on the latter part of the hindwing downstroke (figures 4a–d, 5 and 9b). The vannal fan is nevertheless also slightly cambered during the early downstroke, prior to the action of the umbrella effect. This is especially evident in the proximal portions of the wing (figures 4a,b and 9a), and presumably reflects precambering of the vannal veins, which is known to be particularly pronounced along the shorter inner veins (Wootton et al. 2000). The overall positive camber of the hindwing is further increased by the lower incidence of the remigium relative to the hindwing fan.
The remigium also appears to play a critical role in determining the spanwise twist distribution that we have measured along the hindwing during the downstroke (figures 6 and 7). The approximately linearly decreasing angle of incidence arises from the combined increase in the chord of the remigium and decrease in the chord of the vannus moving distally along the wing (figures 7 and 10): since the remigium has a lower incidence than the vannal fan, this results in a decrease in the overall angle of incidence moving outboard along the wing. The measured twist distribution is exactly appropriate to counteract the linearly increasing angle of attack that would occur for an untwisted wing in root-flapping motion (figure 7). Because any change to the stiffness of the vannal veins, the chord of the remigium or the kinematics of the wing would cause a change in the angle of attack along the wing, the near-constant angle of attack that we have found implies tuning of the structural, morphological and kinematic parameters of the hindwing. This is reminiscent of the optimum for a propeller of constant aerofoil section, wherein a linear twist distribution allows each aerofoil section to operate at the unique angle of attack maximizing lift to drag ratio.
4.2. Forewing kinematics
The anterior panel of the remigium is at a lower angle of incidence than the rest of the forewing through the entire wingbeat (figures 4e,f and 9), which accounts for the wing being positively cambered throughout the stroke. The angle of incidence of the clavus sharply increases mid-downstroke at approximately t̂=0.3, and sharply decreases mid-upstroke at t̂=0.8 (figures 4e,f and 9). This accounts for the sharp increase in the forewing camber mid-downstroke (figure 5d), and for the creation of the classical z-profile (Jensen 1956) mid-upstroke. The chord of the clavus decreases with the chord of the anterior panel of the remigium moving distally along the wing, so neither makes any obvious contribution to spanwise twist on the downstroke in the manner observed for the hindwing. In fact, the forewing is much less strongly twisted than the hindwing on the downstroke (figure 6a,e), and this means that the forewing has an increasing angle of attack from the root to the tip during flapping (figure 6f). We, therefore, find no evidence for fine-tuning of the forewing for efficiency such as we have found for the hindwing, although interpretation of the results is complicated by the fact that the forewing also has more strongly decreasing camber along its length than the hindwing (figure 6a,c), which will make the zero-lift angle of attack closer to zero moving towards the tip and might counteract the increasing angle of attack.
The forewing displays much greater kinematic variation than the hindwing, both between and within individuals (table 1). This is consistent with the classical interpretation (Jensen 1956; Baker & Cooter 1979a) that whereas the hindwing is optimized for efficient lift and thrust production, the forewing is primarily concerned with control. This is corroborated by our measurements of the angle of attack, which show that whereas the angle of attack of the hindwing is large and relatively constant during the downstroke, the angle of attack of the forewing fluctuates around zero (figure 6). Variations in the angle of attack and camber of the magnitude we have described for the forewing could have a pronounced effect upon the aerodynamics: under steady, attached flow conditions a 1 per cent increase in camber increases the zero-lift angle of attack of an aerofoil by approximately 1° (Hoerner 1985). A more detailed analysis of the roles of the hindwing and forewing, and of the effects of varying twist and the camber under unsteady conditions, requires the sort of detailed analysis that can only be provided by computational fluid dynamics using the detailed kinematic data of the sort we have provided here.
Acknowledgments
This research was funded principally by the EPSRC and MoD under grant no. GR/S23049/01 to A.L.R.T. and G.K.T. Part of the research leading to these results has received funding from the European Research Council under the European Community's Seventh Framework Programme (FP7/2007–2013)/ERC grant agreement no. 204513 to G.K.T. G.K.T. is a Royal Society University Research Fellow and RCUK Academic Fellow. We thank Rafal Żbikowski, Andrew Moore, Kevin Knowles, Nicholas Lawson, Brian White, Iain Wallace and Salman Ansari for their contributions to collaborative aspects of this research project. We especially thank Iain Wallace for his assistance with the technical aspects of the experimental work. We are also grateful to Charles Bibby for his advice on photogrammetry. We thank the EPSRC equipment loan pool and Nicholas Lawson for lending cameras and lighting.
References
- Baker P. S., Cooter R. J. 1979a. The natural flight of the migratory locust, Locusta migratoria L. I. Wing movements. J. Comp. Physiol. A. 131, 79–89. ( 10.1007/BF00613086) [DOI] [Google Scholar]
- Baker P. S., Cooter R. J. 1979b. The natural flight of the migratory locust, Locusta migratoria L. II. Gliding. J. Comp. Physiol. A. 131, 89–94. ( 10.1007/BF00613087) [DOI] [Google Scholar]
- Baker P. S., Geweke M., Cooter R. J. 1981. The natural flight of the migratory locust, Locusta migratoria L. III. Wing-beat frequency, flight speed and attitude. J. Comp. Physiol. A. 141, 233–237. ( 10.1007/BF01342669) [DOI] [Google Scholar]
- Bomphrey R. J., Lawson N. J., Taylor G. K., Thomas A. L. R. 2005. Application of digital particle image velocimetry to insect aerodynamics: measurement of the leading-edge vortex and near wake of a hawkmoth. Exp. Fluids. 40, 546–554. ( 10.1007/s00348-005-0094-5) [DOI] [Google Scholar]
- Brown M. B., Forsythe A. B. 1974. Robust tests for equality of variances. J. Am. Stat. Assoc. 69, 364–367. ( 10.2307/2285659) [DOI] [Google Scholar]
- Buckholz R. H. 1986. The functional role of wing corrugation in living systems. J. Fluids. Eng. 108, 93–97. [Google Scholar]
- Canny J. 1986. A computational approach to edge detection. IEEE Trans. Pattern Anal. Machine Intell. 8, 679–714. [PubMed] [Google Scholar]
- Cloupeau M., Devillers J.-F., Devezeaux D. 1979. Direct measurements of instantaneous lift in desert locust; comparison with Jensen's experiments on detached wings. J. Exp. Biol. 80, 1–16. [Google Scholar]
- Crawford T. L., Dobosy R. J., Dumas E. J. 1996. Aircraft wind measurement considering lift-induced upwash. Boundary-Layer Meteorol. 80, 79–94. ( 10.1007/BF00119012) [DOI] [Google Scholar]
- Dickinson M. H., Götz K. 1993. Unsteady aerodynamic performance of model wings at low Reynolds numbers. J. Exp. Biol. 174, 45–64. [DOI] [PubMed] [Google Scholar]
- Du G., Sun M. 2008. Effects of unsteady deformation of flapping wings on its aerodynamic forces. Appl. Math. Mech. Engl. Edin. 29, 731–741. ( 10.1007/s10483-008-0605-9) [DOI] [Google Scholar]
- Ellington C. P. 1984. The aerodynamics of hovering insect flight. III. Kinematics. Phil. Trans. R. Soc. Lond. B. 305, 41–78. ( 10.1098/rstb.1984.0051) [DOI] [Google Scholar]
- Gettrup E. 1966. Sensory regulation of wing twisting in locusts. J. Exp. Biol. 44, 6–17. [DOI] [PubMed] [Google Scholar]
- Hoerner S. F. 1985. Fluid-dynamic lift. California, CA: Hoerner Fluid Dynamics [Google Scholar]
- Jensen M. 1956. Biology and physics of locust flight. III. The aerodynamics of locust flight. Phil. Trans. R. Soc. B. 239, 527–555. ( 10.1098/rstb.1956.0009) [DOI] [Google Scholar]
- Kesel A. B. 2000. Aerodynamic characteristics of dragonfly wing sections compared with technical aerofoils. J. Exp. Biol. 203, 3125–3135. [DOI] [PubMed] [Google Scholar]
- Nachtigall W. 1981. Der vorderflügel großer Heuschrecken als Luftkrafterzeuger I. Modellmessungen zur aerodynamischen Wirkung unterschiedlicher Flügelprofile. J. Comp. Physiol. 142, 127–134. ( 10.1007/BF00605484) [DOI] [Google Scholar]
- Okamoto M., Yasuda K., Azuma A. 1996. Aerodynamic characteristics of the wings and body of a dragonfly. J. Exp. Biol. 199, 281–294. [DOI] [PubMed] [Google Scholar]
- Parker J. R. 1997. Algorithms for image processing and computer vision. New York, NY: Wiley [Google Scholar]
- Pfau H. K., Nachtigall W. 1981. Der vorderflügel großer Heuschrecken als Luftkrafterzeuger II. Zusammenspiel von Muskeln und Gelenkmechanik bei der Einstellung der Flügelgeometrie. J. Comp. Physiol. 142, 135–140. ( 10.1007/BF00605485) [DOI] [Google Scholar]
- Rees C. J. C. 1975. Form and function in corrugated insect wings. Nature. 256, 200–203. ( 10.1038/256200a0) [DOI] [Google Scholar]
- Song D., Wang H., Zeng L., Yin C. 2001. Measuring the camber deformation of a dragonfly wing using projected comb fringe. Rev. Sci. Instrum. 72, 2450 ( 10.1063/1.1364664) [DOI] [Google Scholar]
- Sunada S., Kawachi K., Watanabe I., Azuma A. 1993. Performance of a butterfly in take-off flight. J. Exp. Biol. 183, 263–280. [Google Scholar]
- Sunada S., Song D., Meng X., Wang H., Zeng L., Kawachi K. 2002. Optical measurement of the deformation, motion, and generated forces of the wings of a moth, Mythimna separata (Walker). JSME Int. J. 45, 836–842. ( 10.1299/jsmeb.45.836) [DOI] [Google Scholar]
- Taylor G. K., Żbikowski R. 2005. Nonlinear time-periodic models of the longitudinal flight dynamics of the desert locust Schistocerca gregaria. J. R. Soc. Interface. 2, 197–221. ( 10.1098/rsif.2005.0036) [DOI] [PMC free article] [PubMed] [Google Scholar]
- Usherwood J. R., Ellington C. P. 2002. The aerodynamics of revolving wings I. Model hawkmoth wings. J. Exp. Biol. 205, 1547–1564. [DOI] [PubMed] [Google Scholar]
- Vogel S. 1967. Flight in Drosophila III. Aerodynamic characteristics of fly wings and wing models. J. Exp. Biol. 46, 431–443. [DOI] [PubMed] [Google Scholar]
- Walker S. M., Thomas A. L. R., Taylor G. K. In press Photogrammetric reconstruction of high-resolution surface topographies and deformable wing kinematics of tethered locusts and free-flying hoverflies. J. R. Soc. Interface. ( 10.1098/rsif.2008.0245) [DOI] [PMC free article] [PubMed] [Google Scholar]
- Wang H., Zeng L., Liu H., Yin C. 2003. Measuring wing kinematics, flight trajectory and body attitude during forward flight and turning maneuvers in dragonflies. J. Exp. Biol. 206, 745–757. ( 10.1242/jeb.00183) [DOI] [PubMed] [Google Scholar]
- Weis-Fogh T. 1956. Biology and physics of locust flight. II. Flight performance of the desert locust (Schistocerca gregaria). Phil. Trans. R. Soc. B. 239, 459–510. ( 10.1098/rstb.1956.0008) [DOI] [Google Scholar]
- Wilkin P. J. 1990. The instantaneous force on a desert locust, Schistocerca gregaria (Orthoptera: Acrididae), flying in a wind tunnel. J. Kans. Entomol. Soc. 63, 321–329. [Google Scholar]
- Willmott A. P., Ellington C. P. 1997. The mechanics of flight in the hawkmoth Manduca sexta. I. Kinematics of hovering and forward flight. J. Exp. Biol. 200, 2727–2738. [DOI] [PubMed] [Google Scholar]
- Wilson D. M., Weis-Fogh T. 1962. Patterned activity of co-ordinated motor units, studied in flying locusts. J. Exp. Biol. 39, 643–667. [Google Scholar]
- Wootton R. J. 1979. Function, homology and terminology in insect wings. Syst. Entomol. 4, 81–93. ( 10.1111/j.1365-3113.1979.tb00614.x) [DOI] [Google Scholar]
- Wootton R. J. 1993. Leading edge section and asymmetric twisting in the wings of flying butterflies (Insecta, Papilionoidea). J. Exp. Biol. 180, 117–119. [Google Scholar]
- Wootton R. J. 1995. Geometry and mechanics of insect hindwing fans: a modelling approach. Proc. R. Soc. B. 262, 181–187. ( 10.1098/rspb.1995.0194) [DOI] [Google Scholar]
- Wootton R. J., Evans K. E., Herbert R., Smith C. W. 2000. The hind wing of a desert locust (Schistocerca gregaria Forskål) I. Functional morphology and mode of operation. J. Exp. Biol. 203, 2945–2955. [DOI] [PubMed] [Google Scholar]
- Wootton R. J., Herbert P. G., Young C. R., Evans K. E. 2003. Approaches to the structural modelling of insect wings. Phil. Trans. R. Soc. B. 358, 1577–1587. ( 10.1098/rstb.2003.1351) [DOI] [PMC free article] [PubMed] [Google Scholar]
- Wortmann M., Zarnack W. 1993. Wing movements and lift regulation in the flight of desert locusts. J. Exp. Biol. 182, 41–72.8228784 [Google Scholar]
- Zeng L., Matsumoto H., Kawachi K. 1996. A fringe shadow method for measuring flapping angle and torsional angle of a dragonfly wing. Measure. Sci. Technol. 7, 786–791. [Google Scholar]
- Zeng L., Hao Q., Kawachi K. 2000. A scanning projected line method for measuring a beating bumblebee wing. Optics Commun. 183, 19–44. ( 10.1016/S0030-4018(00)00888-9) [DOI] [Google Scholar]


