

Abstract
Objective:
This study examined changes in drinking behavior after age 50 and baseline personal characteristics and subsequent life events associated with different alcohol-consumption trajectories during a 14-year follow-up period.
Method:
Data were taken from the Health and Retirement Study. The study sample included individuals ages 51–61 in 1992 who survived the sample period (1992–2006) and had at least five interviews with alcohol consumption information, yielding an analysis sample of 6,787 (3,760 women). We employed linear regression to determine drinking trajectories over 1992–2006. Based on these findings, each sample person was classified into one of five drinking categories. We used multinomial logit analysis to assess the relationship between personal demographic, income, health, and attitudinal characteristics as well as life events and drinking-trajectory category.
Results:
Overall, alcohol consumption declined. However, rates of decline differed appreciably among sample persons, and for a minority, alcohol consumption increased. Persons with increasing consumption over time were more likely to be affluent (relative-risk ratio [RRR] = 1.09, 95% CI [1.05, 1.12]), highly educated (RRR = 1.20, 95% CI [1.09, 1.31]), male, White (RRR = 3.54, 95% CI [1.01, 12.39]), unmarried, less religious, and in excellent to good health. A history of problem drinking before baseline was associated with increases in alcohol use, whereas the reverse was true for persons with histories of few or no drinking problems.
Conclusions:
There are substantial differences in drinking trajectories at the individual level in midlife and late life. A problem-drinking history is predictive of alcohol consumption patterns in later life.
High levels of alcohol consumption by older persons lead to poor health, poor cognition, problem-drinking patterns, and alcohol dependence (Blow and Barry, 2002; Moos et al., 2004; Oslin et al., 1998). However, moderate levels of alcohol consumption may actually be beneficial (Ferreira and Weems, 2008; Lang et al., 2007; Stott et al., 2008). Comparably high alcohol consumption by younger and older persons is more likely to adversely affect older persons because of the latter's lower ability to metabolize alcohol (Moore, 2003). The National Institute on Alcohol Abuse and Alcoholism (2007) and the American Geriatrics Society (Moore, 2003) have established clinical guidelines for alcohol use for persons ages 65 and older, specifying that such persons should consume a maximum of one drink daily, seven drinks weekly, and not more than three drinks on a given day. Merrick et al. (2008), based on cross-sectional analysis of a nationally representative sample of persons ages 65 and older, found that 9% consumed alcohol in excess of these guidelines.
Studies of life-course drinking patterns generally report increases in alcohol consumption peaking at early adulthood, with subsequent declines in participation, total consumption, and drinks per occasion (Fillmore et al., 1991; Johnson et al., 1998). Cross-sectional studies have consistently documented decreased alcohol consumption per occasion and increases in abstention with increased age (Breslow et al., 2003; Breslow and Smothers, 2003; Johnson et al., 1998; Ruchlin, 1997). Although some longitudinal studies have reported similar patterns of decline in drinking with age (Goodwin et al., 1987; Moore et al., 2005), others have not. Eigenbrodt et al. (2001) found increased abstention with age, and Glynn et al. (1985) found a decreased prevalence of drinking problems among older persons, but neither study found a statistically significant age-related decrease in alcohol consumption.
Most nationally representative studies of alcohol use among the elderly have been cross sectional (Breslow and Smothers, 2003; Kerr et al., 2004; Kirchner et al., 2007; Merrick et al., 2008), and most longitudinal studies have not been nationally representative (Eigenbrodt et al., 2001; Moos et al., 2004; Walton et al., 2000). Nationally representative and longitudinal studies generally have observed drinking patterns for less than 5 years (Dawson et al., 2008; Karlamangla et al., 2006; Perreira and Sloan, 2001) or fewer than five interviews (Goodwin et al., 1987; Moore et al., 2005; Perreira and Sloan, 2001). Longitudinal studies examining relationships between drinking behavior and age have offered limited insight into correlates of changes in drinking other than for demographic factors.
In this study, we used data from the Health and Retirement Study (HRS) to track the alcohol consumption of individuals ages 51–61 at baseline in 1992–2006. Based on each individual's self-reported alcohol consumption, we estimated each individual's base consumption and trend in consumption over 1992–2006. Based on these results, we classified each individual into one of five drinking-trajectory categories and used multinomial logit analysis to assess sources of differences in probabilities of being in each category.
Method
Data
The HRS has been conducted in even-numbered years since 1992. The 1992 HRS sample consisted of persons born during 1931–1941 and their spouses who could be any age. Baseline interviews were conducted in respondents' homes, with subsequent interviews by telephone. A response rate of approximately 80% was obtained in each subsequent survey year. At baseline, 12,652 individuals (7,608 households) were surveyed, including oversamples of Black and Hispanic persons. We limited our analysis to persons ages 51–61 at baseline (n = 9,601) who had at least five interviews (n = 7,843) and survived to the end of the observational period, leaving a final analysis sample of 6,787 individuals (Table 1). A total of 1,720 individuals (17.9%) died during the observational period.
Table 1.
Sample attrition by year and number of interviews completed
|
Panel A. Sample attrition and mortality by year for individuals age 51–61 in 1992 | ||||||||
| Sample year |
||||||||
| Sample status | 1992 | 1994 | 1996 | 1998 | 2000 | 2002 | 2004 | 2006 |
| Interviewed | 9,601 | 8,596 | 8,143 | 7,767 | 7,313 | 7,001 | 6,685 | 6,309 |
| Eligible but not interviewed | 0 | 775 | 1,018 | 1,077 | 1,156 | 1,012 | 990 | 756 |
| Exited sample (living) | 0 | 60 | 235 | 549 | 866 | 1,254 | 19,6 | 2,227 |
| Died | 0 | 168 | 205 | 208 | 266 | 334 | 230 | 309 |
| Totala |
9,601 |
9,601 |
9,601 |
9,601 |
9,601 |
9,601 |
9,601 |
9,601 |
|
Panel B. Sample attrition and mortality for individuals with fewer than five interviews versus analysis sample | ||||||||
| No. of interviews |
Died |
Exited sample |
Total |
|||||
| 1 | 61 | 271 | 332 | |||||
| 2 | 190 | 283 | 473 | |||||
| 3 | 203 | 274 | 477 | |||||
| 4 | 210 | 266 | 476 | |||||
| 5 | 293 | 324 | 617 | |||||
| 6 | 290 | 403 | 693 | |||||
| 7 | 238 | 691 | 929 | |||||
| 8 | 235a | 0 | 5,604 | |||||
| Total | 1,720 | 2,512 | 9,601 | |||||
Proxy interview obtained.
Defining drinking-trajectory categories
In the first two interviews (i.e., 1992, 1994), the HRS asked, “Do you ever drink any alcoholic beverages such as beer, wine, or liquor?” and “In general, do you have less than one drink a day, one to two drinks a day, three or four drinks a day, or five or more drinks a day?” Subsequently, the HRS asked, “Do you ever drink any alcoholic beverages such as beer or wine or liquor?” “In the last 3 months, on average, how many days per week have you had any alcohol to drink?” and “In the last 3 months, on the days you drink, about how many drinks do you have?”
Drinking trajectories for each sample person were computed based on the mean number of drinks per day during the reference period specified in the interviews. Mean drinks per day was calculated for each respondent in 1996–2006. In 1992 and 1994, for individuals who reported consuming less than one drink daily, the value of 0.5 drinks per day was assigned, followed by 1.5 for one to two, 3.5 for three to four, and 6 for five or more drinks per day. Based on the person's drinking trajectory over the study period, persons were categorized as (1) abstainers, (2) steady drinkers, (3) increasing drinkers, (4) decreasing drinkers, or (5) sporadic drinkers.
We estimated an equation of the following form for each individual in the sample: drinks/dayi = αi + δi × year + εi, with year being a continuous variable from 1–15. We assigned individuals with a positive and statistically significant estimate of αi and an insignificant estimate of δi to the steady-drinker group; increasing drinkers were persons with a positive, statistically significant estimate of δi; decreasing drinkers were those with a negative and statistically significant estimate of δi; persons with a statistically insignificant estimate for both parameters were classified as either sporadic drinkers or abstainers, the difference being that abstainers did not consume alcohol at all during the study period. Drinking trajectories and categories were computed using SAS Version 9.1 software (SAS Institute Inc., Cary, NC).
Multinomial logit analysis of drinking category
Overview.
The dependent variable in the multinomial logit analysis was a person's drinking category, with abstainers being the omitted group. Explanatory variables fell into these categories: drinking history, income and demographic characteristics, health and cognitive status, and preferences and social supports.
There were two specifications: first, we included only covariates for baseline characteristics; second, we added covariates for changes in demographic characteristics, health, and social support that occurred during the observation period. We accounted for the HRS sampling method and the clustered and stratified sampling method by using STATA Version 10.0 “SVYSET” programs (StataCorp LP, College Station, TX) with individual-level sampling probability weights.
Drinking history.
The measure of drinking history was the CAGE instrument for the clinical assessment of alcohol disorders (Buchsbaum et al., 1991). The CAGE score is based on answers to four questions: “Have you ever felt you should cut down your drinking?” “Have people annoyed you by criticizing your drinking?” “Have you ever felt bad or guilty about your drinking?” and “Have you ever had a drink first thing in the morning to steady your nerves or to get rid of a hangover?” Item responses on the CAGE are scored 0 or 1, with a higher score indicating the presence of an alcohol problem. Although the CAGE does not provide a Diagnostic and Statistical Manual of Mental Disorder, Third Edition, Revised (American Psychiatric Association, 1987), diagnosis of alcohol abuse or dependence (Girela et al., 1994), it has been validated as a clinical screening tool (Buchsbaum et al., 1991; Chan et al., 1994; Girela et al., 1994; Mayfield et al., 1974; McIntosh et al., 1994). Because we used values of CAGE obtained from the baseline interview and the questions referred to behaviors that occurred at any time in the past, the CAGE score (range: 0–4) measured the person's drinking history before baseline.
Income and demographic characteristics.
We included variables for annual household income, age, and education—all continuous variables. A second set of variables, all binaries, were for working full time, female gender, White race, and whether a person was married.
Health and cognitive status.
Individuals were asked to report their current health status as excellent, very good, good, fair, or poor. A binary variable was coded as 1 if a person reported being in fair or poor health.
To ascertain cognitive status, respondents were asked two word-recall questions (Herzog and Wallace, 1997). First, respondents recalled as many words as possible from a 20-word list immediately after it was read to them. Second, 5 minutes later, they were asked to recall these words again. For each word correctly recalled, an individual received 1 point. Considering responses to both questions, the cognition score could range from 0 to 40 points.
The HRS included 8 items from the 20-item Center for Epidemiological Studies-Depression (CESD) scale. Six items indicated depression (in the last week, respondent felt depressed; felt everything he or she did was an effort; experienced restless sleep; could not get going; felt lonely; felt sad). Two items suggested its absence (in the last week, respondent enjoyed life; was happy) and were reverse coded. Dichotomized values were summed to calculate a single depression score ranging from 0 to 8. The response could be in one of four categories: all or almost all of the time, most of the time, some of the time, or none or almost none of the time. Those individuals who responded most or all of the time were given 1 point on the CESD scale.
Preferences and social support.
The 1992 HRS contained a question on risk preferences in the financial domain—a gamble based on lifetime earnings. Each person was asked to choose between pairs of jobs where one guarantees current family income and the other offers a chance to increase income but also carries the risk of loss of income. If he or she would take the risk, the same scenario with riskier odds was presented. If he or she would not take the risk, the same scenario with less risky odds was presented. The risk tolerance measure from the HRS used a 4-point scale, ranging from a score of 1 for least risk averse to 4 for most risk averse.
In 1992, the HRS also assessed respondents' financial planning horizons. Persons were asked which period was the most important to them in planning for saving and spending: next few months, next year, next few years, next 5–10 years, or more than10 years. A financial planning horizon of next few months was scored 1 and more than 10 years was scored 5, with other responses falling in between.
Religiosity was measured by frequency of religious service attendance and importance of religion in a sample person's life. Frequency of religious service attendance ranged from 0 to 5, where 0 indicated no attendance and 5 indicated attendance more than once weekly. Importance of religion was measured on a scale from 0 to 2; a 0 indicated that religion is “not too important” and a 2 that religion is “very important.” Importance of religion was first asked in 1996; we assumed that responses were time invariant (i.e., would have been the same if asked at baseline).
Social support was measured by the frequency of social interactions a sample person had with his or her neighbors on a scale from 0 to 5, with 0 being no interaction with neighbors and 5 being daily or almost daily, with binary variables to indicate that a sample person has close friends or relatives living nearby.
Life events.
We included indicators of the occurrence of health, family, marital, and labor status changes after baseline. We set a binary variable equal to 1 if a person worked full or part time in 1992 and subsequently classified themselves as retired. A separate binary variable was set to 1 for individuals who worked full or part time at baseline and subsequently transitioned into “disabled” employment status. A binary variable was coded as 1 for individuals not married at baseline but who were married in at least one subsequent interview. We also included binary variables for persons married at baseline and who later reported being (a) divorced or (b) widowed, and (c) for those individuals who reported the death of a sibling after the baseline interview. To capture effects of newly occurring adverse health events, we included a count of the number of interviews after baseline that an individual reported a hospital stay of 3 or more days for persons not hospitalized in 2 years before the baseline interview and binary variables for individuals who reported never having had cancer, stroke, diabetes, or psychiatric diagnoses at baseline but who reported these diagnoses in subsequent interviews (Table 2).
Table 2.
Weighted means (M) and linearized standard errors (SE) of explanatory variables at baseline and occurrence of life events after baseline
| Variable | M | Linearized SE | Min. | Max. |
| Drinking behavior | ||||
| Drinks per day | 0.598 | 0.014 | 0 | 5.5 |
| CAGE score | 0.426 | 0.012 | 0 | 4 |
| Income and demographic characteristics | ||||
| Household income, in U.S. $10,000 | 5.28 | 0.15 | 0 | 130 |
| Works full-time | 0.586 | 0.008 | 0 | 1 |
| Years of education | 12.5 | 0.089 | 0 | 17 |
| Age | 55.5 | 0.042 | 51 | 61 |
| White | 0.877 | 0.007 | 0 | 1 |
| Female | 0.547 | 0.005 | 0 | 1 |
| Married | 0.760 | 0.007 | 0 | 1 |
| Health and cognitive status | ||||
| Fair/poor health | 0.152 | 0.007 | 0 | 1 |
| Cognition scorea | 13.473 | 0.137 | 0 | 40 |
| CESD score | 0.708 | 0.024 | 0 | 8 |
| Preferences and social supports | ||||
| Risk aversion | 3.18 | 0.02 | 0 | 4 |
| 1 = least risk averse | ||||
| 4 = most risk averse | ||||
| 0 = missing | ||||
| Financial planning horizon | 2.98 | 0.02 | 0 | 5 |
| 1 = next few months | ||||
| 5 = longer than 10 years | ||||
| 0 = missing | ||||
| Rarity of religious service attendanceb | 1.93 | 0.02 | 0 | 5 |
| 1 = more than once/week | ||||
| 5 = not at all | ||||
| 0 = missing | ||||
| Importance of religionc | 1.84 | 0.01 | 0 | 2 |
| 0 = not too important | ||||
| 2 = very important | ||||
| Frequency of socializing with neighborsd | 1.98 | 0.02 | 0 | 5 |
| 0 = no friends in neighborhood | ||||
| 5 = daily or almost every day | ||||
| 0 = missing | ||||
| Relatives live nearby | 0.208 | 0.006 | 0 | 1 |
| Friends live nearby | 0.436 | 0.007 | 0 | 1 |
| Life events | ||||
| Retired | 0.496 | 0.007 | 0 | 1 |
| Became disabled | 0.033 | 0.002 | 0 | 1 |
| Got married | 0.055 | 0.004 | 0 | 1 |
| Got divorced | 0.046 | 0.003 | 0 | 1 |
| Death of a spouse | 0.124 | 0.004 | 0 | 1 |
| Death of a sibling | 0.343 | 0.007 | 0 | 1 |
| Hospitalized | 0.731 | 0.015 | 0 | 7 |
| New diabetes diagnosis | 0.149 | 0.004 | 0 | 1 |
| New cancer diagnosis | 0.119 | 0.004 | 0 | 1 |
| New stroke | 0.063 | 0.003 | 0 | 1 |
| New psychiatric diagnosis | 0.099 | 0.004 | 0 | 1 |
| Observations, n | 6,787 | |||
Notes: Means calculated using survey weights, clustering, and strata. Min. = minimum; max. = maximum; CESD = Center for Epidemiological Studies—Depression scale.
Fewer observations because of missing values (n = 6,324);
fewer observations because of missing values (n = 6,260);
fewer observations because of missing values (n = 4,852);
fewer observations because of missing values (n = 6,336).
The multinomial analysis assessed the probability (Pij) of the ity person being in each category, 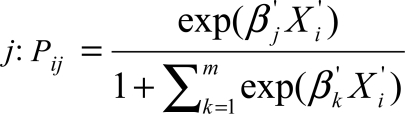 , where Xi is the set of drinking history, income and demographic characteristics, health, attitude, and social characteristics for each individual, i, and β′j is the effect of the Xi variables on the probability of being in each drinking category, including abstaining from drinking throughout the observational period. Parameter estimates reported below are relative-risk ratios (RRR) and are interpreted as the probability of belonging to a category given Xi divided by the probability of being an abstainer given Xi. The multinomial logit analysis was conducted using Stata Version 10 software with SVYSET commands to account for sampling weight, clustering, and strata.
Results
The single largest group was sporadic drinkers (30.0%), followed by abstainers (28.8%), steady drinkers (20.7%), decreasing drinkers (18.4%), and increasing drinkers (2.2%). Overall, the mean number of alcoholic beverages consumed daily declined from 0.60 at baseline to 0.36 at Year 15 (Table 3). Much of the decline occurred before Year 5, that is, when most sample persons were still in their 50s. The share of heavy drinkers remained relatively stable from baseline to Year 15. The share of abstainers increased from 35.2% at baseline to 66.3% at Year 15. Again, most change occurred in the first 5 years.
Table 3.
Alcohol consumption by drinking group
| Year |
||||||||
| Variable | 1992 | 1994 | 1996 | 1998 | 2000 | 2002 | 2004 | 2006 |
| Panel A: Mean drinks per day | ||||||||
| All | 0.60 | 0.55 | 0.39 | 0.37 | 0.35 | 0.37 | 0.38 | 0.36 |
| Abstainers | 0.00 | 0.00 | 0.00 | 0.00 | 0.00 | 0.00 | 0.00 | 0.00 |
| Steady | 1.21 | 1.16a | 0.90 | 0.90 | 0.81 | 0.83 | 0.78 | 0.75 |
| Increasing | 0.72 | 0.74 | 0.92 | 1.10 | 1.30 | 1.61 | 1.89 | 2.05 |
| Decreasing | 0.78 | 0.71 | 0.29 | 0.21 | 0.15 | 0.11 | 0.07 | 0.06 |
| Sporadic | 0.63 | 0.54 | 0.43 | 0.42 | 0.43 | 0.50 | 0.56a | 0.53 |
| Panel B: Heavy drinkers, % | ||||||||
| All | 4.6 | 4.2 | 4.0 | 4.1 | 4.0 | 4.2 | 4.4 | 4.7 |
| Abstainers | 0.0 | 0.0 | 0.0 | 0.0 | 0.0 | 0.0 | 0.0 | 0.0 |
| Steady | 12.4 | 11.6 | 10.7 | 11.3 | 10.1 | 11.0 | 9.6 | 10.4 |
| Increasing | 1.1a | 1.2a | 8.3 | 11.6 | 15.4 | 21.8 | 32.0 | 38.5 |
| Decreasing | 5.3 | 3.9 | 2.6 | 2.0 | 1.3 | 1.0 | 0.4a | 0.2a |
| Sporadic | 3.5 | 3.3 | 3.8 | 3.8 | 4.3 | 4.3 | 5.6 | 5.9 |
| Panel C: Abstaining, % | ||||||||
| All | 35.2 | 40.5 | 62.2 | 65.0 | 67.1 | 65.2 | 65.6 | 66.3 |
| Abstainers | 100.0 | 100.0 | 100.0 | 100.0 | 100.0 | 100.0 | 100.0 | 100.0 |
| Steady | 0.0 | 1.8 | 23.1 | 25.6 | 28.9 | 25.4 | 25.2 | 27.4 |
| Increasing | 16.6 | 17.9a | 15.6a | 10.0 | 9.7 | 2.3 | 0.0 | 0.0 |
| Decreasing | 0.0 | 0.0a | 56.8 | 68.7 | 76.9 | 79.9 | 86.3 | 87.9 |
| Sporadic | 20.4 | 37.8 | 59.6 | 60.4 | 60.5 | 53.5 | 52.0 | 51.2 |
| Observations, n | 7,654 | 7,107 | 6,937 | 6,761 | 6,543 | 6,518 | 6,414 | 6,309 |
Notes: Means calculated using survey weights, clustering, and strata.
Mean does not differ from abstaining group at 95% level according to t tests of averages for steady, increasing, decreasing, and sporadic drinkers versus abstainers.
Measured in mean number of drinks per day, the steady group was highest at baseline (M = 1.21) and the sporadic group lowest (M = 0.63), except for abstainers. By Year 15, however, increasing drinkers had the highest mean (M = 2.05 drinks daily), with decreasing drinkers again having the lowest mean among the nonabstainers (M = 0.06 drinks daily). By Year 15, 87.9% of decreasing drinkers abstained versus 0.0% at baseline. Steady drinkers decreased their alcohol consumption but not relative to the decreasing-drinker group. Mean daily consumption among increasing drinkers rose about threefold.
A history of problem drinking before baseline, measured by the CAGE score, was predictive of being an increasing drinker relative to a person who abstained throughout the observation period, the omitted reference group (Table 4). Persons with a history of problem drinking were less likely to be decreasing drinkers than they were to be abstainers. The RRR and associated confidence intervals (CIs) on the CAGE score variable were insensitive to the changes in specification. Hence, we will discuss only the results from the full specification.
Table 4.
Multinomial logit with relative risk ratios for the association of personal characteristics and life events with drinking behavior
| Steady drinker |
Increasing drinker |
Decreasing drinker |
Sporadic drinker |
|||||
| Drinking behavior | (1) | (2) | (1) | (2) | (1) | (2) | (1) | (2) |
| Drinking history | ||||||||
| CAGE score | 1.083 | 1.088 | 1.282* | 1.279* | 0.847* | 0.848* | 1.048 | 1.047 |
| [0.977, 1.200] | [0.980, 1.208] | [1.051, 1.565] | [1.039, 1.575] | [0.747, 0.961] | [0.748, 0.960] | [0.958, 1.147] | [0.956, 1.147] | |
| Income and demographic characteristics | ||||||||
| Household income | 1.087*** | 1.083*** | 1.090*** | 1.082*** | 1.060*** | 1.059*** | 1.064*** | 1.060*** |
| [1.058, 1.117] | [1.054, 1.112] | [1.054, 1.128] | [1.045, 1.120] | [1.029, 1.093] | [1.028, 1.091] | [1.034, 1.095] | [1.032, 1.090] | |
| Works full time | 1.074 | 1.000 | 0.985 | 0.943 | 1.032 | 1.038 | 0.942 | 0.870 |
| [0.889, 1.297] | [0.795, 1.259] | [0.633, 1.531] | [0.608, 1.463] | [0.878, 1.214] | [0.853, 1.264] | [0.799, 1.109] | [0.731, 1.036] | |
| Became retired | 1.139 | 0.974 | 0.990 | 1.131 | ||||
| [0.943, 1.375] | [0.636, 1.492] | [0.811, 1.208] | [0.970, 1.318] | |||||
| Became disabled | 0.604* | 1.687 | 0.670 | 1.095 | ||||
| [0.404, 0.903] | [0.518,5.497] | [0.350, 1.283] | [0.774, 1.550] | |||||
| Years of education | 1.165*** | 1.157*** | 1.213*** | 1.197*** | 1.107*** | 1.101*** | 1.062*** | 1.058** |
| [1.124, 1.207] | [1.118, 1.198] | [1.108, 1.327] | [1.093, 1.311] | [1.068, 1.147] | [1.062, 1.140] | [1.029, 1.096] | [1.025, 1.093] | |
| Age | 1.025 | 1.025 | 1.000 | 1.017 | 1.051** | 1.055*** | 1.012 | 1.017 |
| [0.999, 1.051] | [0.998, 1.054] | [0.951, 1.052] | [0.963, 1.074] | [1.023, 1.080] | [1.027, 1.085] | [0.987, 1.038] | [0.991, 1.043] | |
| White | 1.401* | 1.345* | 3.958* | 3.540* | 1.061 | 1.030 | 0.955 | 0.926 |
| [1.079, 1.819] | [1.033, 1.751] | [1.118, 14.00] | [1.012, 12.386] | [0.822, 1.369] | [0.788, 1.346] | [0.774, 1.179] | [0.750, 1.143] | |
| Female | 0.600** | 0.612** | 0.267*** | 0.280*** | 0.787 | 0.795 | 0.699** | 0.704* |
| [0.454, 0.794] | [0.463, 0.810] | [0.149, 0.477] | [0.155, 0.504] | [0.563, 1.100] | [0.568, 1.113] | [0.537, 0.908] | [0.541, 0.915] | |
| Married | 0.633** | 0.644** | 0.602 | 0.681 | 0.805 | 0.807 | 0.718** | 0.732** |
| [0.493, 0.812] | [0.502, 0.827] | [0.342, 1.061] | [0.372, 1.246] | [0.637, 1.017] | [0.636, 1.025] | [0.597, 0.863] | [0.611, 0.877] | |
| Became married | 0.991 | 1.211 | 0.863 | 1.089 | ||||
| [0.630, 1.557] | [0.420, 3.489] | [0.555, 1.342] | [0.771, 1.539] | |||||
| Became divorced | 1.525 | 1.549 | 1.824** | 1.575* | ||||
| [0.978, 2.379] | [0.788, 3.044] | [1.191, 2.793] | [1.065, 2.329] | |||||
| Death of spouse | 0.943 | 0.425 | 0.938 | 1.019 | ||||
| [0.709, 1.254] | [0.158, 1.145] | [0.772, 1.139] | [0.843, 1.231] | |||||
| Health and cognitive status | ||||||||
| Fair/poor health | 0.397*** | 0.423*** | 0.340** | 0.364* | 0.554*** | 0.557*** | 0.587*** | 0.611*** |
| [0.305, 0.518] | [0.326, 0.549] | [0.155, 0.744] | [0.169, 0.784] | [0.434, 0.707] | [0.437, 0.710] | [0.481, 0.717] | [0.500, 0.747] | |
| Hospitalized | 0.961 | 0.939 | 1.060 | 0.955 | ||||
| [0.900, 1.025] | [0.712, 1.238] | [0.988, 1.137] | [0.903, 1.010] | |||||
| New diabetes diagnosis | 0.638** | 0.353* | 0.999 | 0.786* | ||||
| [0.490, 0.830] | [0.158, 0.789] | [0.824, 1.212] | [0.637, 0.969] | |||||
| Steady drinker |
Increasing drinker |
Decreasing drinker |
Sporadic drinker |
|||||
| Drinking behavior | (1) | (2) | (1) | (2) | (1) | (2) | (1) | (2) |
| New cancer diagnosis | 1.325 | 1.280 | 1.039 | 1.164 | ||||
| [0.977, 1.796] | [0.706, 2.321] | [0.735, 1.470] | [0.896, 1.512] | |||||
| New stroke | 0.647* | 0.389 | 0.592** | 0.728 | ||||
| [0.431, 0.970] | [0.097, 1.556] | [0.408, 0.860] | [0.500, 1.059] | |||||
| New psych, diagnosis | 0.966 | 1.394 | 1.133 | 1.022 | ||||
| [0.757, 1.233] | [0.625, 3.113] | [0.859, 1.495] | [0.847, 1.232] | |||||
| Cognition score | 1.019 | 1.018 | 1.025 | 1.022 | 1.016 | 1.016 | 1.007 | 1.006 |
| [0.997, 1.041] | [0.997, 1.040] | [0.985, 1.067] | [0.981, 1.063] | [0.995, 1.037] | [0.995, 1.037] | [0.991, 1.023] | [0.990, 1.023] | |
| CESD score | 0.898** | 0.900** | 0.777* | 0.764* | 0.938* | 0.928* | 0.977 | 0.975 |
| [0.837, 0.963] | [0.838, 0.967] | [0.635, 0.952] | [0.624, 0.935] | [0.879, 1.000] | [0.871, 0.989] | [0.924, 1.033] | [0.919, 1.033] | |
| Attitude and social support | ||||||||
| Risk averse | 0.939 | 0.934 | 1.031 | 1.033 | 0.944 | 0.943 | 0.974 | 0.971 |
| [0.863, 1.021] | [0.859, 1.016] | [0.829, 1.282] | [0.828, 1.289] | [0.874, 1.020] | [0.872, 1.020] | [0.911, 1.041] | [0.910, 1.036] | |
| Financial planning horizon | 1.148** | 1.133* | 1.207 | 1.173 | 1.096 | 1.096 | 0.997 | 0.990 |
| [1.041, 1.265] | [1.030, 1.246] | [0.899, 1.620] | [0.893, 1.540] | [0.999, 1.203] | [0.997, 1.204] | [0.918, 1.083] | [0.913, 1.073] | |
| Freq. of religious service attendance | 0.738*** | 0.727*** | 0.785* | 0.770* | 0.696*** | 0.690*** | 0.771*** | 0.763*** |
| [0.680, 0.801] | [0.670, 0.790] | [0.628, 0.981] | [0.618, 0.958] | [0.639, 0.758] | [0.633, 0.753] | [0.719, 0.827] | [0.711, 0.819] | |
| Importance of religion | 0.373*** | 0.388*** | 0.269** | 0.280** | 0.596* | 0.608* | 0.480*** | 0.496*** |
| [0.262, 0.532] | [0.271, 0.557] | [0.112, 0.650] | [0.119, 0.660] | [0.387, 0.916] | [0.393, 0.940] | [0.337, 0.684] | [0.346, 0.711] | |
| Freq. of socializing with neighbors | 0.989 | 0.982 | 1.226** | 1.218** | 0.984 | 0.982 | 0.973 | 0.967 |
| [0.919, 1.064] | [0.912, 1.056] | [1.066, 1.410] | [1.059, 1.402] | [0.909, 1.065] | [0.908, 1.062] | [0.915, 1.036] | [0.910, 1.028] | |
| Relatives nearby | 0.664** | 0.675** | 0.583 | 0.600 | 0.603*** | 0.596*** | 0.782** | 0.787** |
| [0.495, 0.889] | [0.506, 0.901] | [0.336, 1.013] | [0.345, 1.046] | [0.499, 0.729] | [0.492, 0.721] | [0.660, 0.927] | [0.664, 0.933] | |
| Death of a sibling | 0.800* | 0.575* | 0.834 | 0.781** | ||||
| [0.673, 0.950] | [0.365, 0.905] | [0.685, 1.016] | [0.684, 0.893] | |||||
| Good friends nearby | 1.217* | 1.187 | 1.040 | 1.009 | 1.315* | 1.314* | 1.110 | 1.099 |
| [1.004, 1.474] | [0.976, 1.444] | [0.651, 1.662] | [0.633, 1.608] | [1.056, 1.638] | [1.052, 1.641] | [0.922, 1.336] | [0.908, 1.329] | |
| Observations, n | 6,787 | |||||||
Notes: Statistics are relative risk ratios, with 95% confidence intervals in brackets. Column (1) excludes life events/health shocks; column (2) is full specification. Results calculated using survey weights, clustering, and strata. CESD = Center for Epidemiological Studies—Depression scale; psych. = psychiatric.
p < .05;
p < .01;
p < .001.
A unit increase in the CAGE score was associated with a 28% increase in the probability of being in the increasing-drinker group (RRR = 1.28, 95% CI [1.04, 1.58]). An equivalent increase in the CAGE score made the individual 15% less likely to be in the decreasing group than to be in the abstainer group (RRR = 0.85, 95% CI [0.75, 0.96]).
Differences between a person with no history of problem drinking (CAGE score = 0) and one with problems on all four items (CAGE score = 4) are quite substantial. Having a CAGE score of 4 versus 0 increased the probability of being an increasing drinker by 112% relative to the probability of being an abstainer.
More highly educated individuals were less likely to be abstainers. Education was not protective of increased drinking. In fact, the highest RRR on educational attainment is for increasing drinkers (RRR = 1.20, 95% CI [1.09, 1.31]) and the lowest is for a group with persistently lower mean levels of daily alcohol consumption than increasing drinkers, sporadic drinkers (RRR = 1.06, 95% CI [1.03, 1.09]). Moreover, the RRRs for cognitive scores are near 1.0. Being older at baseline increased the probability of being a decreasing drinker. Being female raised the probability of being an abstainer. However, although the RRRs on the binary variables for women are all less than 1.0, the RRR is higher for the sporadic than for the other nonabstainer categories (RRR = 0.70, 95% CI [0.54, 0.92]). Whites are relatively much more likely to be in the increasing-drinking category (RRR = 3.54, 95% CI [1.01, 12.39]) and the steady-drinking category (RRR = 1.35, 95% CI [1.03, 1.75]) than are non-Whites.
Persons in fair/poor health at baseline were much more likely to be abstainers. None of the results on the cognitive score, measured at baseline, are statistically significant at conventional levels. Persons more depressed at baseline were more likely to be abstainers. Among the statistically significant findings, an increase of 1 on the CESD score decreases the probability of being a steady drinker by 10% (RRR = 0.90, 95% CI [0.84, 0.97]), an increasing drinker by 24% (RRR = 0.76, 95% CI [0.62, 0.94]), and a decreasing drinker by 7% (RRR = 0.93, 95% CI [0.87, 0.99]).
Persons with longer financial planning horizons were relatively more likely to be steady drinkers (RRR = 1.13, 95% CI [1.03, 1.25]). Individuals in each of the drinking categories did not statistically differ from one another with respect to risk preferences.
Individuals who are more religious, as measured by the frequency of religious service attendance and importance of religion to individuals, were relatively more likely to be abstainers. Neither variable is particularly predictive of drinking category among abstainers, with the exception that attaching importance to religion is quite strongly associated with not being an increasing drinker (RRR = 0.28, 95% CI [0.12, 0.66]). Among social support measures, socializing more frequently with neighbors (RRR = 1.22, 95% CI [1.06, 1.40]) is associated with increasing drinking, whereas having close friends nearby is associated with decreasing drinking (RRR = 1.31, 95% CI [1.05, 1.64]). Having relatives living nearby is associated with a relatively high probability of abstaining.
The occurrence of important life events during the study period generally is not systematically related to the probabilities of being in particular drinking groups. The lack of findings for important life events recorded by HRS interviews does not rule out the possibility that more minor stressors have an important role in affecting an individual's alcohol-consumption trajectory or that life events have a short-term impact after which alcohol consumption returns to its previous level.
Among the major adverse health events, the most consistent findings are for a new diagnosis of diabetes mellitus and for a new stroke. Being diagnosed with diabetes decreases the relative probability of being an increasing drinker by 65% (RRR = 0.35, 95% CI [0.16, 0.79]). There are statistically significant relationships between divorce and being a decreasing or sporadic drinker versus being an abstainer. The death of a sibling reduces the relative probability of being a steady drinker by 20% (RRR = 0.80, 95% CI [0.67, 0.95]), an increasing drinker by 42% (RRR = 0.58, 95% CI [0.37, 0.91]), and a sporadic drinker by 22% (RRR = 0.78, 95% CI [0.68, 0.89]).
Discussion
Overall, there was a decline in alcohol consumption as individuals transitioned from the 50s to 60s and 70s. However, rates of decline differed appreciably among sample individuals, and for a small minority, alcohol consumption increased. Persons with increasing consumption over time tended to have had a problem-drinking history, were relatively affluent and more highly educated, and were more likely to be male, White, unmarried, and less religious.
One of the most striking relationships is between a history of problem drinking, presumably most often before age 50, and the alcohol-consumption trajectories from the 50s to the mid-70s. Having had a history of problem drinking before the baseline period was generally associated with large changes in alcohol use, with increasing consumption for relatively large values of CAGE and the reverse for persons with low values on this measure.
About two thirds of persons older than age 65 with problem-drinking patterns are diagnosed with a problem-drinking pattern in early adulthood (Rigler, 2000). Some of these persons may use alcohol to self-medicate and continue use of alcohol for this purpose later in the life course. Some may have been successfully treated for alcohol abuse at an earlier age and relapsed later in life, sometimes in response to a stressful event. Overall, little is really known about longitudinal heavy or problem drinking over the life course, and available evidence is based on small localized samples (see, e.g., Brennan and Moos, 1996b, and Schonfeld and Dupree, 1991).
Although the CAGE is the most widely used screening instrument for alcohol abuse disorders and is viewed as appropriate for use in a general population (Smart et al., 1991), its usefulness in older populations has been questioned (Culberson, 2006). That we found associations between values obtained from the CAGE instrument and subsequent longitudinal alcohol consumption patterns supports its use in predicting alcohol consumption subsequently in the life course.
Higher socioeconomic status, as measured by educational attainment and income, was positively associated with alcohol consumption in our study. There are several possible pathways underlying observed patterns of alcohol consumption by income: (a) increases in income are associated with increased demand for alcohol (Cook and Moore, 2000); (b) higher income could lead to more time working and less time for alcohol consumption, but full-time work status was unrelated to drinking category; and (c) educational attainment could be a marker for knowledge of health risks (Kenkel, 1991) and for cognitive capacity (Ganzach, 2000). However, in our analysis, if the primary pathway operated through cognitive status, one would have expected better relative performance for the cognitive score. (d) Also, people may use alcohol consumption as a vehicle for career advancement (French and Zarkin, 1995; MacDonald and Shields, 2001), but this is more likely for persons at a younger age, and there was no relationship between fulltime work and the drinker categories in our study. Thus, on balance, the most compelling argument is that demand for alcohol increases with increasing income and/or education, and income may serve as a proxy for preferences not otherwise measured.
Although increasing drinkers socialized more frequently, decreasing drinkers were more likely to report having close friends nearby compared with nondrinkers. Studies that have focused on problem drinking have found associations between social isolation and the onset of problem drinking (O'Connell et al., 2003) and more frequent relapse into problem drinking (Schutte et al., 2001) in older populations. Moos et al. (2004) found that individuals whose friends approved of their drinking habits were more likely to develop a drinking problem in later life, whereas those individuals who received help in curbing their drinking from family and friends were less likely to develop such problems. Brennan and Moos (1996a) found that the effect of social resources on drinking and problem-drinking behavior depended on the individual's problem-drinking history, with late-onset drinkers more likely to curb drinking when they lose or reduce social resources.
Finally, that the major life events captured by the HRS were most often unrelated to drinking trajectories may seem surprising, at least at first glance. But mechanisms underlying the relationships between specific life events occurring to older individuals are complex. For example, persons experiencing adverse health events may be advised to reduce alcohol consumption or stop it entirely (see, e.g., Aira et al., 2005). Yet the evidence suggests that moderate alcohol consumption appears to have no effect on glycemic control and a decreased probability of cardiovascular events, the risk of which tends to increase in persons diagnosed with diabetes (Howard et al., 2004). In general, cancer patients are advised to drink no more than small amounts of alcohol. For certain types of cancer (e.g., oral, esophageal, and liver cancers), persons may experience immediate negative physical effects of alcohol consumption or may be strongly advised to stop drinking (American Cancer Society, n.d.). Literature on the association of getting divorced and subsequent drinking has yielded mixed results. Jose et al. (2000) found that divorce was associated with increased abstinence from drinking in men and decreased abstinence from drinking in women, whereas Perreira and Sloan (2001) found that, among problem drinkers, divorce was associated with subsequent decreases in alcohol consumption in both sexes. Our findings on life events are broadly consistent with those from previous studies in that, overall, evidence on the relationship between stressful life events and alcohol consumption among older persons has been mixed (Graham and Schmidt, 1999).
This study has several important strengths. The sample is nationally representative and longitudinal, spanning almost a decade and a half. Also, the HRS obtains data on a number of potentially important correlates of alcohol consumption, not just information on health, income, and demographic characteristics, but also on cognition and preferences that may be systematically related to alcohol consumption.
We acknowledge several study limitations. First, the HRS did not obtain information on when, in the earlier life course, problems related to alcohol consumption were experienced or how persistent they were. Second, details are lacking to provide an understanding of why this relationship exists. Several studies examining problem drinking and coping styles have reported that those who use avoidance coping to deal with life stressors are more likely develop or maintain late-life drinking problems (Brennan and Moos, 1996a; Moos et al., 2004; Schutte et al., 2001). Schuckit and Smith (2000) found that a family history of alcohol dependence, anxiety, and coping style predicts alcohol abuse and dependence. Other studies have reported contextual factors such as local laws and cultural norms, availability, neighborhood disorganization, and attitudes of peers have a significant influence on occurrence of alcohol-related problems (Hawkins et al., 1992). For persons with past drinking problems, the literature finds environmental factors such as interpersonal conflict, social pressure, and boredom are associated with relapses in drinking problems (Marlatt, 1996; Walton et al., 2003). Third, although the time-invariant covariates in the multinomial analysis were defined from the baseline HRS interview, we cannot rule out the possibility that the baseline values and the alcohol-consumption trajectories both rely on some unmeasured variable that accounts for the observed relationships. For the time-varying covariates, endogeneity is a more likely possibility. However, if the trajectories in alcohol use were important causes of the life events, we would have expected more statistically significant and positive relationships than we observed.
Finally, nearly one fifth of individuals otherwise eligible for inclusion in the analysis sample died during the 14-year follow-up period. In an analysis not reported here, we estimated Cox proportional hazard models using HRS data with the same sample exclusion criteria. We found that light to moderate drinking (defined as zero to two drinks [women] or three drinks [men] daily and representing 57.2% of the sample) was associated with relatively higher survival during the follow-up period. Light to moderate drinkers were distributed in all of the categories except for abstainers. They were slightly relatively overrepresented in the decreasing group and slightly underrepresented in the sporadic group. The extent of a survivorship bias, if it exists at all, is likely to be minor.
In sum, our study has documented considerable heterogeneity in alcohol consumption observed over a 14-year period among persons older than age 50 at baseline. Although most individuals reduced levels of alcohol consumption, a small minority substantially increased it. In general, alcohol consumption tended to be quite low, but there were exceptions that merit special attention. A history of problem drinking in earlier life affects alcohol-consumption trajectories in later life. It is important for clinicians to elicit near-elderly and elderly patients' drinking history and, based on responses, track the alcohol consumption of such persons over time.
Footnotes
This research was supported by National Institute on Alcohol Abuse and Alcoholism grant 2R01-AA012162.
References
- Aira M, Hartikainen S, Sulkava R. Community prevalence of alcohol use and concomitant use of medication—a source of possible risk in the elderly aged 75 and older? InternationalJournal of Geriatric Psychiatry. 2005;20:680–685. doi: 10.1002/gps.1340. [DOI] [PubMed] [Google Scholar]
- American Cancer Society (ACS) Nutrition for the person with cancer. Atlanta, GA: Author; n.d.. Retrieved from http://www.cancer.org/docroot/MBC/MBC_6.asp?sitearea=MBC. [Google Scholar]
- American Psychiatric Association. Diagnostic and statistical manual of mental disorders. 3rd ed., rev. Washington, DC: Author; 1987. [Google Scholar]
- Blow FC, Barry KL. Use and misuse of alcohol among older women. Alcohol Research & Health. 2002;26:308–315. [PMC free article] [PubMed] [Google Scholar]
- Brennan PL, Moos RH. Late-life drinking behavior: The influence of personal characteristics, life context, and treatment. Alcohol Health & Research World. 1996a;20:197–204. [PMC free article] [PubMed] [Google Scholar]
- Brennan PL, Moos RH. Late-life problem drinking: Personal and environmental risk factors for 4-year functioning outcomes and treatment seeking. Journal of Substance Abuse. 1996b;8:167–180. doi: 10.1016/s0899-3289(96)90227-8. [DOI] [PubMed] [Google Scholar]
- Breslow R, Faden V, Smothers B. Alcohol consumption by elderly Americans. Journal of Studies on Alcohol. 2003;64:884–892. doi: 10.15288/jsa.2003.64.884. [DOI] [PubMed] [Google Scholar]
- Breslow R, Smothers B. Drinking patterns of older Americans: National Health Interview Surveys, 1997–2001. Journal of Studies on Alcohol. 2003;65:232–240. doi: 10.15288/jsa.2004.65.232. [DOI] [PubMed] [Google Scholar]
- Buchsbaum DG, Buchanan RG, Lawton MJ, Schnoll SH. Alcohol consumption patterns in a primary care population. Alcohol and Alcoholism. 1991;26:215–220. doi: 10.1093/oxfordjournals.alcalc.a045103. [DOI] [PubMed] [Google Scholar]
- Chan AWK, Pristach EA, Welte JW. Detection by the CAGE of alcoholism or heavy drinking in primary care outpatients and the general population. Journal of Substance Abuse. 1994;6:123–135. doi: 10.1016/s0899-3289(94)90157-0. [DOI] [PubMed] [Google Scholar]
- Cook PJ, Moore MJ. Alcohol. In: Culyer AJ, Newhouse JP, editors. Handbook of Health Economics. Vol. 1, Pt 2. New York: Elsevier; 2000. pp. 1629–1673. [Google Scholar]
- Culberson J. Alcohol use in the elderly: Beyond the CAGE. Part 2: Screening instruments and treatment strategies. Geriatrics. 2006;61(11):20–26. [PubMed] [Google Scholar]
- Dawson DA, Stinson FS, Chou SP, Grant BF. Three-year changes in adult risk drinking behavior in relation to the course of alcohol-use disorders. Journal of Studies on Alcohol and Drugs. 2008;69:866–877. doi: 10.15288/jsad.2008.69.866. [DOI] [PMC free article] [PubMed] [Google Scholar]
- Eigenbrodt M, Mosley T, Hutchinson R, Watson R, Chambless L, Szklo M. Alcohol consumption with age: A cross-sectional and longitudinal study of the Atherosclerosis Risk in Communities (ARIC) Study, 1987–1995. American Journal of Epidemiology. 2001;153:1102–1111. doi: 10.1093/aje/153.11.1102. [DOI] [PubMed] [Google Scholar]
- Ferreira MP, Weems MKS. Alcohol consumption by aging adults in the United States: Health benefits and detriments. Journal of the American Dietetic Association. 2008;108:1668–1676. doi: 10.1016/j.jada.2008.07.011. [DOI] [PubMed] [Google Scholar]
- Fillmore KM, Hartka E, Johnstone B, Leino V, Motoyoshi M, Temple M. A meta-analysis of life course variation in drinking. British Journal of Addiction. 1991;86:1221–1267. doi: 10.1111/j.1360-0443.1991.tb01702.x. [DOI] [PubMed] [Google Scholar]
- French MT, Zarkin GA. Is moderate alcohol use related to wages? Evidence from four worksites. Journal of Health Economics. 1995;14:319–344. doi: 10.1016/0167-6296(95)90921-r. [DOI] [PubMed] [Google Scholar]
- Ganzach Y. Parents' education, cognitive ability, educational expectations and educational attainment: Interactive effects. British Journal of Educational Psychology. 2000;70:419–441. doi: 10.1348/000709900158218. [DOI] [PubMed] [Google Scholar]
- Girela E, Villanueva E, Hernandez-Cueto C, Luna JD. Comparison of the CAGE questionnaire versus some biochemical markers in the diagnosis of alcoholism. Alcohol and Alcoholism. 1994;29:337–343. [PubMed] [Google Scholar]
- Glynn RJ, Bouchard GR, LoCastro JS, Laird NM. Aging and generational effects on drinking behaviors in men: Results from the Normative Aging Study. American Journal of Public Health. 1985;75:1413–1419. doi: 10.2105/ajph.75.12.1413. [DOI] [PMC free article] [PubMed] [Google Scholar]
- Goodwin JS, Sanchez CJ, Thomas P, Hunt C, Garry PJ, Goodwin JM. Alcohol intake in a healthy elderly population. American Journal of Public Health. 1987;77:173–177. doi: 10.2105/ajph.77.2.173. [DOI] [PMC free article] [PubMed] [Google Scholar]
- Graham K, Schmidt G. Alcohol use and psychosocial well-being among older adults. Journal of Studies on Alcohol. 1999;60:345–351. doi: 10.15288/jsa.1999.60.345. [DOI] [PubMed] [Google Scholar]
- Hawkins JD, Catalano RF, Miller JY. Risk and protective factors for alcohol and other drug problems in adolescence and early adulthood: Implications for substance abuse prevention. Psychological Bulletin. 1992;112:64–105. doi: 10.1037/0033-2909.112.1.64. [DOI] [PubMed] [Google Scholar]
- Herzog AR, Wallace RB. Measures of cognitive functioning in the AHEAD study. Journals of Gerontology Series B. 1997;52B:37–48. doi: 10.1093/geronb/52b.special_issue.37. [DOI] [PubMed] [Google Scholar]
- Howard A, Arnsten J, Gourevitch M. Effect of alcohol consumption on diabetes mellitus. Annals of Internal Medicine. 2004;140:211–224. doi: 10.7326/0003-4819-140-6-200403160-00011. [DOI] [PubMed] [Google Scholar]
- Johnson FW, Gruenewald PJ, Treno AJ, Taff GA. Drinking over the life course within gender and ethnic groups: A hyperparametric analysis. Journal of Studies on Alcohol. 1998;59:568–580. doi: 10.15288/jsa.1998.59.568. [DOI] [PubMed] [Google Scholar]
- Jose BS, Van Oers HAM, Van De Mheen HD, Garretsen HFL, Mackenbach JP. Stressors and alcohol consumption. Alcohol. 2000;35:307–312. doi: 10.1093/alcalc/35.3.307. [DOI] [PubMed] [Google Scholar]
- Karlamangla A, Kefei Z, Reuben D, Greendale G, Moore A. Longitudinal trajectories of heavy drinking in adults in the United States of America. Addiction. 2006;101:91–99. doi: 10.1111/j.1360-0443.2005.01299.x. [DOI] [PubMed] [Google Scholar]
- Kenkel DS. Health behavior, health knowledge, and schooling. Journal of Political Economy. 1991;99:287–305. [Google Scholar]
- Kerr WC, Greenfield TK, Bond J, Ye Y, Rehm J. Age, period and cohort influences on beer, wine and spirits consumption trends in the US National Alcohol Surveys. Addiction. 2004;99:1111–1120. doi: 10.1111/j.1360-0443.2004.00820.x. [DOI] [PubMed] [Google Scholar]
- Kirchner J, Zubritsky C, Cody M, Coakley E, Chen H, Ware JH, Levkoff S. Alcohol consumption among older adults in primary care. Journal of General Internal Medicine. 2007;22:92–97. doi: 10.1007/s11606-006-0017-z. [DOI] [PMC free article] [PubMed] [Google Scholar]
- Lang I, Wallace RB, Huppert FA, Melzer D. Moderate alcohol consumption in older adults is associated with better cognition and well-being than abstinence. Age and Ageing. 2007;36:256–261. doi: 10.1093/ageing/afm001. [DOI] [PubMed] [Google Scholar]
- MacDonald Z, Shields MA. The impact of alcohol consumption on occupational attainment in England. Economica. 2001;68:427–453. [Google Scholar]
- McIntosh MC, Leigh G, Baldwin NJ. Screening for hazardous drinking: Using the CAGE and measures of alcohol consumption in family practice. Canadian Family Physician. 1994;40:1546–1553. [PMC free article] [PubMed] [Google Scholar]
- Marlatt GA. Taxonomy of high-risk situations for alcohol relapse: Evolution and development of a cognitive-behavioral model. Addiction. 1996;91(Suppl):S37–S49. [PubMed] [Google Scholar]
- Mayfield D, McLeod G, Hall P. The CAGE questionnaire: Validation of a new alcoholism screening instrument. American Journal of Psychiatry. 1974;131:1121–1123. doi: 10.1176/ajp.131.10.1121. [DOI] [PubMed] [Google Scholar]
- Merrick EL, Horgan CM, Hodgkin D, Garnick DW, Houghton SF, Panas L, Blow FC. Unhealthy drinking patterns in older adults: Prevalence and associated characteristics. Journal of the American Geriatrics Society. 2008;56:214–223. doi: 10.1111/j.1532-5415.2007.01539.x. [DOI] [PubMed] [Google Scholar]
- Moore AA. Clinical guidelines for alcohol use disorders in older adults. New York: American Geriatrics Society; 2003. Retrieved from http://www.americangeriatrics.org/Products/Positionpapers/alcoholPF.shtml. [Google Scholar]
- Moore A, Gould R, Reuben D, Greendale G, Carter K, Zhou K, Karlamangla A. Longitudinal patterns and predictors of alcohol consumption in the United States. American Journal of Public Health. 2005;95:458–464. doi: 10.2105/AJPH.2003.019471. [DOI] [PMC free article] [PubMed] [Google Scholar]
- Moos RH, Schutte K, Brennan P, Moos BS. Ten-year patterns of alcohol consumption and drinking problems among older women and men. Addiction. 2004;99:829–838. doi: 10.1111/j.1360-0443.2004.00760.x. [DOI] [PubMed] [Google Scholar]
- National Institute on Alcohol Abuse and Alcoholism. Helping patients who drink too much: A clinician 's guide. Updated 2005 edition. Bethesda, MD: Author; 2007 Reprinted. [Google Scholar]
- O'Connell H, Chin A-V, Cunningham C, Lawlor B. Alcohol use disorders in elderly people: Redefining an age old problem in old age. BMJ. 2003;327:664–667. doi: 10.1136/bmj.327.7416.664. [DOI] [PMC free article] [PubMed] [Google Scholar]
- Oslin D, Atkinson RM, Smith DM, Hendrie H. Alcohol related dementia: Proposed clinical criteria. International Journal of Geriatric Psychiatry. 1998;13:203–212. doi: 10.1002/(sici)1099-1166(199804)13:4<203::aid-gps734>3.0.co;2-b. [DOI] [PubMed] [Google Scholar]
- Perreira KM, Sloan FA. Life events and alcohol consumption among mature adults: A longitudinal analysis. Journal of Studies on Alcohol. 2001;62:501–508. doi: 10.15288/jsa.2001.62.501. [DOI] [PubMed] [Google Scholar]
- Rigler SK. Alcoholism in the elderly. American Family Physician. 2000;61:1710–1716. [PubMed] [Google Scholar]
- Ruchlin HS. Prevalence and correlates of alcohol use among older adults. Preventive Medicine. 1997;26:651–657. doi: 10.1006/pmed.1997.0233. [DOI] [PubMed] [Google Scholar]
- Schonfeld L, Dupree L. Antecedents of drinking for early- and late-onset elderly alcohol abusers. Journal of Studies on Alcohol. 1991;52:587–592. doi: 10.15288/jsa.1991.52.587. [DOI] [PubMed] [Google Scholar]
- Schuckit MA, Smith TL. The relationships of a family history of alcohol dependence, a low level of response to alcohol and six domains of life functioning to the development of alcohol use disorders. Journal of Studies on Alcohol. 2000;61:827–835. doi: 10.15288/jsa.2000.61.827. [DOI] [PubMed] [Google Scholar]
- Schutte KK, Byrne FE, Brennan PL, Moos RH. Successful remission of late-life drinking problems: A 10-year follow-up. Journal of Studies on Alcohol. 2001;62:322–334. doi: 10.15288/jsa.2001.62.322. [DOI] [PubMed] [Google Scholar]
- Smart R, Adlaf E, Knoke D. Use of the CAGE scale in a population survey of drinking. Journal of Studies on Alcohol. 1991;52:593–596. doi: 10.15288/jsa.1991.52.593. [DOI] [PubMed] [Google Scholar]
- Stott DJ, Falconer A, Kerr GD, Murray HM, Trompet S, Westendorp RGJ, Ford I. Does low to moderate alcohol intake protect against cognitive decline in older people? Journal of the American Geriatrics Society. 2008;56:2217–2224. doi: 10.1111/j.1532-5415.2008.02007.x. [DOI] [PubMed] [Google Scholar]
- Walton MA, Blow FC, Bingham CR, Chermack ST. Individual and social/environmental predictors of alcohol and drug use 2 years following substance abuse treatment. Addictive Behaviors. 2003;28:627–642. doi: 10.1016/s0306-4603(01)00284-2. [DOI] [PubMed] [Google Scholar]
- Walton MA, Mudd SA, Blow FC, Chermack ST, Gomberg ESL. Stability in the drinking habits of older problem-drinkers recruited from nontreatment settings. Journal of Substance Abuse Treatment. 2000;18:169–177. doi: 10.1016/s0740-5472(99)00032-x. [DOI] [PubMed] [Google Scholar]