

Abstract
In vivo fluorescence cancer imaging is an important tool in understanding tumor growth and therapeutic monitoring and can be performed either with endogenously produced fluorescent proteins or exogenously introduced fluorescent probes bound to targeting molecules. However, endogenous fluorescence proteins cannot be altered after transfection, thus requiring rederivation of cell lines for each desired color, while exogenously targeted fluorescence probes are limited by the heterogeneous expression of naturally occurring cellular targets. In this study, we adapted the dehalogenase-based protein-Tag (HaloTag) system to in vivo cancer imaging. By introducing highly expressed HaloTag receptors (HaloTagR) in cancer cells coupled with an externally injected a range of fluorophore-conjugated dehalogenase-reactive sequences. Tumor nodules arising from a single transfected cell line were stably labeled with fluorescence varying in emission spectra from green to near infrared. After establishing and validating a SHIN3 cell line stably transfected with HaloTagR (HaloTagR-SHIN3), in vivo spectral fluorescence imaging studies were performed in live animals using a peritoneal dissemination model. The tumor nodules arising from HaloTagR-SHIN3 could be successfully labeled by 4 different fluorophore-conjugated HaloTag-ligands each emitting light at different wavelengths. These fluorophores could be alternated on serial imaging sessions permitting assessment of interval growth. Fluorescence was retained in histological specimens after fixation. Thus, this tagging system proves versatile both for in vivo and in vitro imaging without requiring modification of the underlying cell line. Thus, this strategy can overcome some of the limitations associated with the use of endogenous fluorescent proteins and exogenous targeted optical agents in current use.
Introduction
In vivo fluorescence imaging is performed either with endogenously produced fluorescent proteins (e.g. GFP, RFP) (1, 2) or exogenously introduced organic or inorganic fluorescent probes (e.g. fluorescein, rhodamine, cyanine) bound to targeting ligands (3). Each method has its advantages and disadvantages. Endogenous fluorescent proteins emit strong signals with minimal photo-bleaching, and are consistently produced in stably transfected cells (2, 4). The choice of the encoded fluorescent protein depends on the task to be accomplished and includes considerations such as the depth of the target tissue (due to limited light penetration at lower wavelengths), the tissue-specific spectral characteristics of auto-fluorescence or other competing fluorescent compounds, and the desired brightness of the fluorescence. However, once a particular fluorescent protein has been selected, the fluorescent properties of the transfected cells cannot be changed; instead another stable transfection and cloning must be performed. This is not only time consuming but may also alter the biologic characteristics of the cell line in ways that introduce new variables into experiments so that each new clone must be extensively validated against prior clones. In contrast, exogenous fluorescent probes utilize a wide range of colors, from blue to near infrared. These injectable fluorescent probes must be conjugated to targeting ligands to improve their specificity, but are limited to naturally occurring cellular targets that are often heterogeneously expressed in tumors and may be in low abundance compared to background signals.
An alternative approach is to use a gene reporter in which non-fluorescent markers (enzymes, receptors, antigens etc.) are introduced into cells but are later “tagged” with an exogenous fluorescent ligand unique to that reporter. Such “tag” reporter systems (e.g Flag-Tag®, Snap-Tag®, Clip-Tag® or Halo-Tag®), have been widely used to label target molecules in cells in vitro (5, 6). By introducing highly expressed “Tag” receptors into the target cells, the target to background (TBR) can be markedly improved. This approach increases the flexibility of fluorescence imaging, since many different fluorophores, exhibiting a broad range of emission wavelengths, can be conjugated to the tag-ligand. Therefore, “Tag” methods have the potential to overcome some of the disadvantages of both endogenous fluorescent proteins and exogenous fluorescent probes in in vivo fluorescence cancer imaging.
The dehalogenase-based protein-Tag (HaloTag) System is a protein labeling method that uses an enzymatic reaction to covalently tether organic probes directly to a specially designed reporting protein expressed on the membrane surface of live cells (6, 7). This receptor protein is a modified haloalkane dehalogenase that covalently binds to a ligand containing a chloride-terminated sequence (HaloTag ligand; HaloTagL). By genetically fusing this modified haloalkane dehalogenase (HaloTag receptor; HaloTagR) protein with a target protein, the HaloTagL can provide spatial information about target fusion-proteins in live cells. Although the HaloTag system has been employed extensively in vitro, it could also be used as an in vivo imaging reporter by coupling it with an externally injected fluorescent tag thus, overcoming the disadvantages of both endogenous and exogenous fluorescence. For instance, this would allow conjugation of the tag to a variety of organic fluorophores ranging in emission wavelength from blue to near infrared, which would create a highly flexible in vivo research imaging system that does not require constant modification of the underlying cell lines. Here, we demonstrate the capability of the HaloTag system for multicolor in vivo cancer imaging using an established human cell line stably transfected with HaloTagR (HaloTagR-SHIN3) (8).
Experimental Procedures
The plasmid preparation of HaloTag receptor protein
The vector encoding β1-Integrin-HaloTag 7 fusion protein (β1Int-HaloTag) was designed according to the protocol described previously (9). Briefly, the humanβ1-Integrin sequence was synthesized (Blue Heron Biotech, Bothell, WA) with a signal peptide (amino acids 1–20), a truncated extracellular domain (amino acids 190–217, 722–730), a transmembrane domain (amino acids 731–756), and a truncated cytoplasmic domain (amino acids 757–762). The HaloTag 7 gene was cloned downstream of the signal peptide and upstream of the extracellular domain. The fusion construct was confirmed by restriction digest analysis and sequencing. DNA was purified using endotoxin free Maxiprep kit (Qiagen, Valencia, CA).
HaloTag ligands
The HaloTagL-TMR and HaloTagL-Alexa488, are commercially available, and were provided by Promega Inc. (Madison, WI). The HaloTagL-Dy633 and HaloTagL-IR800 were synthesized by Promega Inc.. The structures of all 4 ligands are shown in Figure 1 and the synthesis methods for HaloTagL-Dy633 and HaloTagL-IR800 are as follows:
Figure 1.
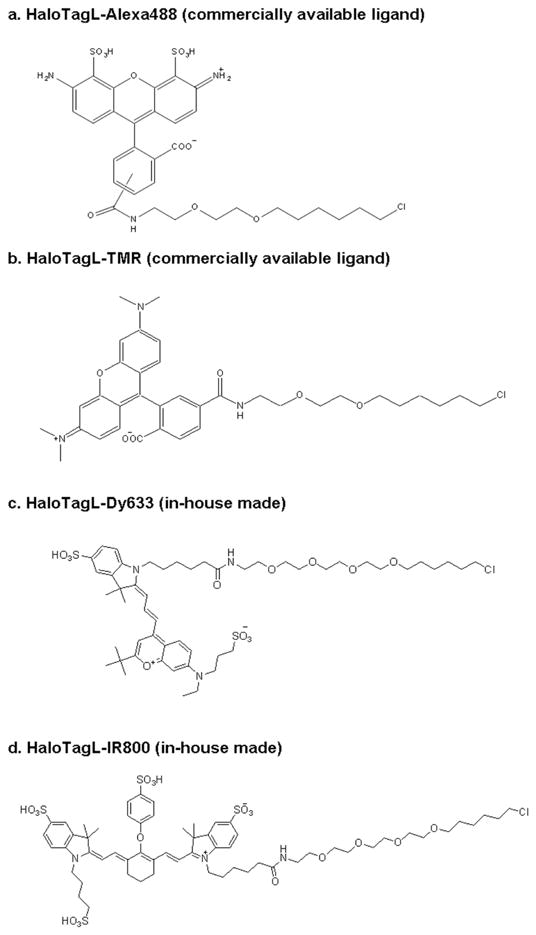
Chemical structures of HaloTag ligands. Chemical structures of all 4 HaloTagLs, which we used in this study, are shown.
A. HaloTagL-Dy633
To a stirring solution of Dy633 succinimidyl ester (10 mg, 0.012 mmol) (Dyomics GmbH, Jena, Germany) in 1 mL anhydrous DMF (stored over molecular sieves) was added 18-chloro-3,6,9,12-tetraoxaoctadecan-1-amine hydrochloride as a 0.5 M solution in DMF (34 μL, 0.017 mmol) followed by diisopropylethylamine (5 μL, 0.024 mmol). The reaction mixture was allowed to stir for 12 h in the dark, diluted with 1 mL of acetonitrile and was subjected to preparative HPLC purification, giving the product (8.98 mg, 74%) as a dark solid.
MS: m/z for C51H76ClN3O12S2+: 1021 (100%), 1022 (50.8%). Found: 1021.0.
B. HaloTagL-IR800
To a stirring solution of IRDye 800CW™ succinimidyl ester (5 mg, 0.0043 mmol) (LI-COR Bioscience, Lincoln, NE) in 750 μL anhydrous DMF (stored over molecular sieves) was added 18-chloro-3,6,9,12-tetraoxaoctadecan-1-amine hydrochloride as a 0.5 M solution in DMF (34 μL, 0.017 mmol) followed by catalytic amount of K2CO3. The reaction mixture was allowed to stir for 12 h in the dark, diluted with 1 mL of acetonitrile and was subjected to preparative HPLC purification, giving the product (5 mg, 86%) as a dark solid.
MS: m/z for C60H83ClN3O18S4+: 1296 (100%), 1298 (50.8%). Found: 1298.
Cell culture
An established ovarian cancer cell line SHIN3 (8) was employed for this study. The cell lines were grown in RPMI 1640 medium (Invitrogen Corporation, Carlsbad, CA) containing 10% fetal bovine serum (FBS) (Invitrogen Inc.), 0.03% L-glutamine at 37 °C, 100 units/mL penicillin, and 100 μg/mL streptomycin in 5% CO2.
Transfection of HaloTag receptor protein to the SHIN3 cells
The HaloTagR plasmid described above was transfected into SHIN3 cells simultaneously with a neomycin-resistant plasmid (Promega Inc.) using the cationic liposome method. Three μg of HaloTagR plasmid and 1 μg of neomycin-resistant plasmid were mixed well with 20 μL of cationic liposome solution (DNA fectin, Life Technologies, Rockville, USA) and incubated for 30 min at room temperature. The plasmid-cationic liposome mixture was added to 1 ×10⁵ SHIN3 cells plated in a 25cm2 cell culture flask and incubated for 6 hours at 37°C in 5% CO2 before being placed back into the regular media and kept overnight. The next day, the initial selection of cells was achieved with 1.5mg/mL neomycin in the regular culture media and colonies were allowed to grow over 2 weeks. HaloTagR-positive colonies were selected by staining with HaloTagL-TMR and spread in culture dishes. This cloning process was repeated twice to derive a stable SHIN3-HaloTagR positive cell line.
Mammalian cells culturing, labeling and imaging
HalotagR-SHIN3 cells were maintained in RPMI1640 media supplemented with Hepes, MEM NEAA, Glutamine and 10% FBS (Invitrogen Inc.) at 37°C and 5% carbon dioxide. For imaging experiments, cells were plated on an 8-well Lab-Tech ll chamber cover glass (Thermo Fisher Scientific, Rochester, NY), labeled with HaloTagL and imaged directly or fixed, permeabilized and then processed for immunocytochemistry using HaloTag® polyclonal Ab (Promega Inc.) and Alexa Fluor 594 goat anti-rabbit IgG Ab (Invitrogen Inc.) or Alexa Fluor 488 goat anti-rabbit IgG Ab (Invitrogen Inc.) prior to imaging. All procedures were performed according to the manufacturer’s protocol. All imaging was performed sequentially using an Olympus FV500 confocal microscope (Olympus America, Inc., Melville, NY) equipped with appropriate filter sets.
Detection of the Halo-Tag protein by SDS-PAGE
HaloTagR-SHIN3 cells were labeled with either HaloTagL-Alexa488 or HaloTagL-TMR or both ligands. The cells were homogenized and their proteins were analyzed by SDS-PAGE gels according to the manufacturer’s protocol (Promega, Inc.). Gels were then scanned on a Typhoon 9400 (GE Healthcare, Piscataway, NJ) fluorescence imager with the appropriate filter settings for each fluorophore.
Tumor model
All procedures were approved by the National Cancer Institute Animal Care and Use Committee. The intraperitoneal tumor implants were established by intraperitoneal injection of 2 × 10⁶ cells suspended in 200 μL of PBS in female nude mice (National Cancer Institute Animal Production Facility, Frederick, MD). Experiments with tumor bearing mice were performed at 14 days for the parent SHIN3 mouse model and 21 days for the HaloTagR-SHIN3 mouse model.
Spectral Fluorescence imaging study
Comparison study of parent-SHIN3 and HaloTagR-SHIN3 bearing mice
After establishing peritoneal tumor implants with either the parent-SHIN3 or HaloTagR-SHIN3 cell lines (n=5, each group), 20 nmol of HaloTagL-TMR diluted in 300-μl PBS with 0.4% bovine serum albumin (Sigma Chemical, St. Louis, MO) were injected into the peritoneal cavities of each mouse 24hrs prior to imaging. Mice were sacrificed with carbon dioxide, and the abdominal cavities were exposed. Spectral fluorescence images were obtained using the Maestro In-Vivo imaging system (CRi, Inc., Woburn, MA). Five sets of side-by-side whole abdominal cavity images of animals harboring tumors from the parent-SHIN3 or HaloTagR-SHIN3 cell lines, as well as images of all tumor nodules were obtained. The brief setting of imaging parameters were described in the Supporting information.
Comparison study of injected amounts of HaloTag ligands
Either 10 nmol or 100 nmol of HaloTagL-Alexa488 or HaloTagL-TMR diluted in 300-μl PBS with 0.4% bovine serum albumin (Sigma Chemical) were injected into the peritoneal cavities of each mouse 24hrs prior to imaging. Mice were sacrificed with carbon dioxide, and the abdominal cavities were exposed. Spectral fluorescence images were obtained using the Maestro In-Vivo imaging system (CRi, Inc.). Three sets of side-by-side whole abdominal cavity images of animals harboring tumors, as well as images of tumor nodules were obtained. The brief setting of imaging parameters were described in the Supporting information.
Multi-color in vivo spectral fluorescence imaging
HaloTagL-Alexa488, -TMR, -Dy633, and -IR800 ligands were used for this study. 60 nmol of each ligand diluted in 300-μl PBS with 0.4% bovine serum albumin were injected into the peritoneal cavities of mice with intraperitoneal dissemination of HaloTagR-SHIN3 24hrs prior to imaging. Mice were anesthetized with subcutaneously administered 10% pentobarbital sodium (Nembutal; Abbott Laboratories, Abbott Park, IL), followed by in vivo spectral fluorescence imaging using the Maestro In-Vivo imaging system. Since the most efficient filter settings varied depending on the characteristics of the fluorophore, a multi-excitation acquisition (10) was employed. The imaging parameters are described in the Supporting information. After obtaining in vivo spectral fluorescence images in live mice, all mice were sacrificed with carbon dioxide, and their abdominal cavities were exposed and imaged with the same acquisition settings. Finally, all spectral fluorescence images were unmixed to distinguish autofluorescence from the 4 different fluorophores using commercial software (Maestro software, CRi). This experiment was performed twice with similar results.
Serial in vivo spectral fluorescence imaging study
Sixty nmol of either HaloTagL-TMR or HaloTagL-IR800 diluted in 300μl PBS with 0.4% bovine serum albumin was injected into the peritoneal cavities of mice bearing intraperitoneal HaloTagR-SHIN3 tumors. HaloTagL-IR800 was initially injected into the animal and imaging was performed at 24 and 48 hours. After the 48 hour image, the same amount of HaloTagL-TMR was administered and imaging was obtained at 72, and 96 hours after initial injection. The order of administration of the two fluorophores was also reversed in another group of two mice. For each imaging session, mice were anesthetized with Isoflurane (IsoFlu; Abbott Laboratories, Abbott Park, IL), and then were imaged using the Maestro In-Vivo imaging system. Two single excitation spectral fluorescence images were acquired for each mouse with either green filter settings or near-infrared filter settings. Other settings of the image acquisition were held constant. The spectral fluorescence images consisting of autofluorescence spectra and either TMR or IR800 spectra were obtained and then unmixed, based on their spectral patterns using commercial software (Maestro software, CRi). All mice were subsequently sacrificed with carbon dioxide. This experiment was repeated twice.
In vivo real-time fluorescence endoscopy
After establishing peritoneal tumor implants with HaloTagR-SHIN3 cell lines, 60 nmol of either HaloTagL-Alexa488 or -TMR diluted in 300-μl PBS with 0.4% bovine serum albumin were injected into the peritoneal cavities 24hrs prior to imaging (n=3, each group). In vivo fluorescence endoscopy was performed with clinical endoscopic system (EVIS Ecera II CLV-180, Olympus Corporation, Tokyo, Japan) equipped with in-house developed fluorescence imaging system. A blue filter setting (excitation filter: 465 to 500 nm, emission filter: 516 to 556 nm band pass) for HaloTagL-Alexa488 and a green-filter setting (531 to 556 nm, 570 to 625 nm band pass) for HaloTagL-TMR were employed for single-excitation acquisition.
Tissue processing
Embedding tissue
Formalin-fixed tissues were washed in water to remove formalin, then immersed in multiple baths of progressively less concentrated ethanol from 100% to 70%, followed by HistoClear Xylene (Fisher Scientific, Pittsburgh, PA) and then hot molten paraffin wax. Embedded tissue blocks were then cut into very thin (0.5–1 microns) sections using a microtome and slices were placed on glass slides (11, 12).
Dewaxing and antigen retrieval
Paraffin sections were de-waxed by immersion in the following solutions, each for 3 min at RT: 3 times in HistoClear Xylene, 2 times in 100% Ethanol, once in 95% Ethanol, and then once in 70% Ethanol. Antigen retrieval was done by incubating slides in warm (94–96°C) 0.01 M Citrate Buffer pH=6.0 for 30 min. followed by cooling step at RT (11–13).
Immunolabeling
All incubation steps were done in a humidified chamber at RT with gentle rocking. Slides were first incubated in a blocking buffer: PBS +60 min., primary Ab to HaloTag (2 μg/ml, Promega Inc.) were applied for overnight incubation at +4°C and finally Alexa Fluor® 594 goat anti-rabbit IgG Ab (Invitrogen Inc.) or Alexa Fluor® 488 goat anti-rabbit IgG Ab (Invitrogen Inc.) for 60 min. After washing three times in PBS for 5 min. slides were mounted in Vectashield (Vector Laboratories, Burlingame, CA) and stored at 4°C. All tissue fluorescence and confocal imaging was done using an Olympus BX61 fluorescence and an FV500 confocal microscope (Olympus America Inc.) in sequential mode equipped with appropriate filter sets.
Results
HaloTagR stably expresses in SHIN3 cells transfected with HaloTagR protein gene (HaloTagR-SHIN3) in vitro
SHIN3 cells were transfected with the HaloTagR protein gene fused to β1-integrin-encoding gene, creating a unique cell membrane marker (9); cloning was performed using HaloTagL-TMR to select a colony of cells that stably expressed the HaloTagR on the cell surface and endoplasmic vesicles without interfering with cellular proliferation or tumorigenesis. After establishing the HaloTagR-SHIN3 cell line, the HaloTagR expression was validated by confocal microscopy (Figure 2A), SDS-PAGE (Figure 2B) and immunohistochemical analysis (Supplemental Figure 1). After validation of HaloTagR-SHIN3, tumor bearing mice underwent in vivo spectral fluorescence imaging.
Figure 2.

A. Confocal fluorescence microscopic images of the SHIN3 cells stably expressing HaloTagR (HaloTagR-SHIN3). HaloTagR-SHIN3 cells were labeled with HaloTagL-Alexa488 at 5 μM for 15 min. (a) or HaloTagL-TMR at 5 μM for 15 min. (b) or pulsed HaloTagL-Alexa488/chased HaloTagL-TMR (c). Images were collected sequentially with appropriate filter sets. Fluorescence images of HaloTagL-Alexa488 (upper left), HaloTag-TMR (upper right), merged image of HaloTag-Alexa488 and TMR (lower right), and DIC images (lower left).
B. Detection of the Halo-Tag protein by SDS-PAGE. The expression of HaloTagR protein in HaloTagR-SHIN3 cells labeled as shown above were analyzed with SDS-PAGE. HalotagL-Alexa488 only bound to the 2 types of truncated membrane HaloTagRs while HalotagL-TMR also permeated into the cells, binding to the truncated cytoplasmic receptor in addition to the 2 membrane receptors. The gel was scanned on a Typhoon camera. Bands corresponding to cell-surface or internal protein pools were quantified using ImageQuant.
HaloTagL specifically binds to tumor nodules arising from HaloTagR-SHIN3 in vivo
To validate the HaloTag system in vivo, spectral fluorescence imaging was performed on HaloTagR-SHIN3 and non-transfected parental SHIN3 tumors after intraperitoneal injection in mice. The SHIN3 tumor model replicates the peritoneal metastases commonly seen in human ovarian cancers. After tumors were established, HaloTagL-TMR was injected intraperitoneally to label the transfected cells. SHIN 3 tumors composed of cells expressing the HaloTagR (HaloTagR-SHIN3) were identified in vivo by unmixing the TMR spectrum from background signal. Non-transfected SHIN3 tumors demonstrated no focal fluorescence (Figure 3). These results suggest that the HaloTagL-TMR binds to the HaloTagR-expressing SHIN3 tumors in vivo while unbound HaloTagL is cleared from the body within a day.
Figure 3.

Comparative spectral fluorescence imaging study demonstrated specific binding of HaloTagL to SHIN3 stably expressing stm-HaloTag® 7 (HaloTagR-SHIN3) tumor growing in mice. The side-by-side comparative spectral fluorescence images of representative pair (A) and the all excised tumor nodules (B) are shown here. Both mice received the same amount of HaloTagL-TMR ligand 24 hours prior to imaging. On the white light images, the same sized tumors can be identified in the both mice (arrows). The unmixed spectral fluorescence images shows that HaloTagR-SHIN3 tumor is depicted by the specific wavelength light which corresponded to TMR spectrum with very low background signal, while parent SHIN3 tumor does not. These results support the concept that the HaloTagL specifically binds to HaloTagR expressing SHIN3 tumor.
Larger amount of HaloTagL shows brighter and more homogeneous HaloTagR-SHIN3 tumor staining in vivo
In order to evaluate the dose effect to the HaloTagL to the tumor in vivo, a comparative imaging study was performed using HaloTagR-SHIN3 tumor bearing mice injected with 10 nmol or 100 nmol of either HaloTagL-Alexa488 or HaloTagL-TMR ligands. Tumors in mice, which received 100 nmol HaloTag, showed brighter staining with both fluorophores. These results suggested that insufficient dose of HaloTagL did not saturate the HaloTagR expressing in the HaloTagR-SHIN3 tumor.
Tumor nodules arising from HaloTagR-SHIN3 can be depicted by various fluorophore-conjugated HaloTagLs in vivo
To demonstrate the ability of this system to accommodate multiple colors, in vivo multi-color spectral fluorescence imaging was performed after the injection of fluorescent HaloTagLs labeled with several different fluorophores (Alexa488, TMR, Dy633, and IR800) ranging in emission wavelength from green to near infrared in different tumor bearing mice. In mice with peritoneal metastases arising from the HaloTagR-SHIN3 cell line, different color HaloTagLs resulted in multi-color depiction of the tumors arising from the same transfected cell line (Figure 5A).
Figure 5.

A. Multiple-color in vivo spectral fluorescence imaging. Unmixed multiple-color spectral fluorescence images of live, anesthetized mice (a), the exposed abdominal cavities (b), and the excised tumor nodules (c) are shown. All mice were injected i.p. with the HaloTagR-SHIN3 cell line. Twenty four hours prior to imaging the mice received HaloTagLs labeled with different fluorophores (left to right; HaloTagL-Alexa488, -TMR, -Dy633, and -IR800 ligands). The tumor nodules are depicted at different wavelengths corresponding to the emission spectra of the fluorophores conjugated to the HaloTagLs. The spectral pattern of each fluorophore (d) is shown. Note that tumors removed from a HaloTagR-SHIN3 mouse, which did not receive ligand, was included as a control (arrow).
B. Serial “pulse-chase” in vivo spectral fluorescence imaging. Imaging sessions took place at 24, 48, 72, and 96 hours after injection of either HaloTagL-TMR or HaloTagL-IR800. After the images were acquired at 48 hours, the same amounts of HaloTagL-TMR were given to the mice in same fashion, and vice versa. The unmixed spectral fluorescence images shows that the tumor nodules are detected for at least 96 hours in the anesthetized live mice after the single administration of either ligand (arrows). Furthermore, additional colors can be added (arrow heads), and simultaneously spectrally resolved. However, the light intensity arising from each ligand-conjugate gradually weakened during the course of observation, probably due to metabolism and photo bleaching.
Fluorescence signals can be switched on alternate imaging sessions
The serial in vivo spectral fluorescence images showed that the tumor nodules were detected for at least 96 hours in the anesthetized live mice after the single administration of either ligand (Figure 5B). Moreover, when two different (e.g. yellow and NIR) fluorophores were used alternately on serial imaging sessions, it was possible to label the interval tumor growth occurring between each imaging session using different colors (Figure 5B). However, the light intensity arising from each ligand-conjugate gradually weakened during the course of observation, probably due to metabolism and photo bleaching.
In vivo real-time endoscopy of the HaloTagR-SHIN3 tumor labeled by either HaloTagL-Alexa488 or HaloTagL–TMR
In vivo real-time endoscopy showed that peritoneal tumor implants, which were originated from the same HaloTagR-SHIN3 cell lines, emitted different fluorescence signals from pre-injected HaloTag-ligands 24 hrs before imaging (Supplemental videos, HaloTagL-Alexa488(A) and HaloTagL–TMR(B)). Both real-time endoscopic images specifically depicted small peritoneal implant of HaloTagR-SHIN3 tumors.
Histological validation of HaloTag receptor expression in the HaroTagR-SHIN3 tumor
Formalin-fixed paraffin-embedded tumor tissue specimens, which were obtained from mice shown in Figure 5, were imaged without any additional staining on an Olympus BX61 fluorescence microscope with the appropriate filter sets (Figure 6A). Immunohistochemistry of stm-HaloTag 7 fusion protein, which was induced in HaloTagR-SHIN3 cells, in the same formalin-fixed paraffin-embedded mouse tumor tissue used above, confirmed HaloTagR expression in the HaloTagR-SHIN3 tumor (Figure 6B).
Figure 6.

Histological validation of HaloTag receptor expression in the HaroTagR-SHIN3 tumor.
A. Formalin-fixed paraffin-embedded tumor tissue specimens were imaged on an Olympus BX61 fluorescence microscope with the appropriate filter sets for HaloTagL-Alexa488 (a) or HaloTagL-TMR (b) or HaloTagL-Dy633 (c) or HaloTagL-IR800 (d).
B. Immunohistochemistry of stm-HaloTag 7 fusion protein, which was induced in HaloTagR-SHIN3 cells, in formalin-fixed paraffin-embedded mouse tumor tissue confirms HaloTagR expression in the HaloTagR-SHIN3 tumor.
Discussion
The wide range of fluorophores available to bind to the HaloTagL enables the selection of the optimal color to meet the requirements of a particular experiment such as avoiding overlap with the spectrum of an administered drug, avoiding autofluorescence or adapting to available imaging equipment, without creating new, genetically modified cell lines (14). Furthermore, an appropriate near infrared (NIR) probe may be selected for visualizing deep tumors due to the better tissue penetration and low background signal in the NIR (Figure 5, also see Supplemental figure 3), whereas a green fluorophore, with higher quantum efficiency, may be preferred for surface imaging applications such as endoscopy (Supplemental videos). Thus, using HaloTagR-transfected tumor cell lines, the tumor can be “painted” with any color as needed without changing the underlying tumor model.
A desirable feature of this system is that the colors could be successfully switched or added on serial in vivo imaging sessions. This feature has also been described for injectable target probes including labeled monoclonal antibodies and other receptor ligands, which target naturally-occurring receptor proteins. By alternating colors interval growth can be measured. However, such targeting agents require stably and homogenously expressing endogenous targets on tumor cells as well as sufficient affinity to their respective target antigens. In contrast, the HaloTag system artificially induces sufficient numbers of cell targets by translating the HaloTagR enzyme receptor in the majority of transfected cells, enabling highly specific, stable covalent binding to the tag-ligand which, in turn, can be labeled with a broad range of fluorophores conjugated to HaloTagL.
There are several limitations to this method. First, while HaloTagR was highly expressed in the majority of cells, some tumors were inhomogeneously labeled (Figure 6A) mainly due to inhomogeneous intratumoral distribution of HaloTagL and partly due to variable expression of the HaloTagR protein. The former is overcome by increasing the dose of HaloTagL. When the dose of HaloTagL was increased up to 100 nmol (a 10-fold increase), the brightness of the tumors became more homogeneous compared to the initial dose of 10 nmol (Figure 4). Additionally, deeper tumors were not labeled as effectively as superficial tumors, although HaloTagR expression detected by immunohistochemistry was relatively homogeneous compared with the in vivo distribution of HaloTagLs (Figure 6B, also see Supplement figure 2). Since the HaloTagL can bind strongly and quickly to HaloTagR, tumor cells on the surface of tumor implants were more likely to be detected than tumor cells located deeper to the surface (Figure 6A). The brightness of tumors or cells using the HaloTag system was dependent on the number of transcripts expressing HaloTagR per cell and the dose of HaloTagL injected into the mouse; however, in our hands the brightness of a green fluorescent HaloTagL was brighter than that of a comparable GFP construct both in vitro and in vivo. Finally, during acquisition of serial in vivo images, the intensity of fluorescence gradually diminished especially with the IR800 ligand, possibly due to catabolism or photo bleaching (Figure 5B). Therefore, to assess longitudinal tumor growth with this method, multiple injections of ligands with proper timing of the imaging, a use-mode analogous to that of bioluminescence imaging, will be required. In this experiment, despite its shorter emission wavelength, TMR-ligand showed comparable brightness to IR80- ligand probably because TMR ligand could bind to both membrane and cytoplasmic receptors, while IR800 ligand bound only to the membrane receptors. However, we were still able to validate persistent HaloTagR expression over time in tumor cells by detecting retained fluorescence signal in histological specimens even after fixation (Figure 6). It is possible that in vivo imaging of intracellular fusion protein targets could be performed as well by using appropriate permeable ligands such as HaloTagL-TMR as shown in Figure 2B.
Figure 4.

Comparison of injected amounts of HaloTag ligands. A comparative imaging study was performed using HaloTagR-SHIN3 tumor bearing mice injected with 10 nmol or 100 nmol of either HaloTagL-Alexa488 (A) or HaloTagL-TMR (B) ligands. Tumors in mice, which received 100 nmol HaloTagL-TMR, show brighter and more homogeneous staining with both fluorophores.
In conclusion, we demonstrate the ability of the HaloTag reporter system to successfully perform in vivo cancer imaging and we verify that numerous fluorophores spanning a broad spectrum of emission wavelengths can be used with the same transfected cell line. Thus, the HaloTag reporter system can be used in practically every step of cancer imaging studies including in vitro cell-sorting or cloning, in vitro validation and quantification of receptor expression, in vivo longitudinal animal imaging, and ex vivo histological analysis. Furthermore, the system is flexible because virtually any kind of tumor can be transfected with the HaloTagR protein and imaged with virtually any fluorophore that can be conjugated to HaloTagL. This strategy can overcome some of the limitations associated with the use of endogenous fluorescent proteins or exogenous targeted optical agents, and could become a valuable research approach for in vivo cancer imaging in animals.
Supplementary Material
Acknowledgments
N.Ko. and M.O. equally contributed to this work. We gratefully acknowledge Chad Zimprich and Shana Svendsen for the cloning of β1Int-HaloTag7 and initial characterization of the β1Int-HaloTag 7 fusion protein. This work was supported by the Intramural Research Program of the National Institutes of Health, National Cancer Institute, Center for Cancer Research.
Footnotes
Supporting Information Available. Setting of imaging parameter, and additional in vitro and histological data. This material is available free of charge via the Internet at http://pubs.acs.org.
References
- 1.Hoffman RM. Advantages of multi-color fluorescent proteins for whole-body and in vivo cellular imaging. J Biomed Opt. 2005;10:41202. doi: 10.1117/1.1992485. [DOI] [PubMed] [Google Scholar]
- 2.Hoffman RM. The multiple uses of fluorescent proteins to visualize cancer in vivo. Nat Rev Cancer. 2005;5:796–806. doi: 10.1038/nrc1717. [DOI] [PubMed] [Google Scholar]
- 3.Weissleder R, Pittet MJ. Imaging in the era of molecular oncology. Nature. 2008;452:580–589. doi: 10.1038/nature06917. [DOI] [PMC free article] [PubMed] [Google Scholar]
- 4.Kogure T, Karasawa S, Araki T, Saito K, Kinjo M, Miyawaki A. A fluorescent variant of a protein from the stony coral Montipora facilitates dual-color single-laser fluorescence cross-correlation spectroscopy. Nat Biotechnol. 2006;24:577–581. doi: 10.1038/nbt1207. [DOI] [PubMed] [Google Scholar]
- 5.Gautier A, Juillerat A, Heinis C, Correa IR, Jr, Kindermann M, Beaufils F, Johnsson K. An engineered protein tag for multiprotein labeling in living cells. Chem Biol. 2008;15:128–136. doi: 10.1016/j.chembiol.2008.01.007. [DOI] [PubMed] [Google Scholar]
- 6.Los GV, Encell LP, McDougall MG, Hartzell DD, Karassina N, Zimprich C, Wood MG, Learish R, Ohana RF, Urh M, Simpson D, Mendez J, Zimmerman K, Otto P, Vidugiris G, Zhu J, Darzins A, Klaubert DH, Bulleit RF, Wood KV. HaloTag: a novel protein labeling technology for cell imaging and protein analysis. ACS Chem Biol. 2008;3:373–382. doi: 10.1021/cb800025k. [DOI] [PubMed] [Google Scholar]
- 7.Los GV, Wood K. The HaloTag: a novel technology for cell imaging and protein analysis. Methods Mol Biol. 2007;356:195–208. doi: 10.1385/1-59745-217-3:195. [DOI] [PubMed] [Google Scholar]
- 8.Imai S, Kiyozuka Y, Maeda H, Noda T, Hosick HL. Establishment and characterization of a human ovarian serous cystadenocarcinoma cell line that produces the tumor markers CA-125 and tissue polypeptide antigen. Oncology. 1990;47:177–184. doi: 10.1159/000226813. [DOI] [PubMed] [Google Scholar]
- 9.Svendsen S, Zimprich C, McDougall MG, Klaubert DH, Los GV. Spatial separation and bidirectional trafficking of proteins using a multi-functional reporter. BMC Cell Biol. 2008;9:17. doi: 10.1186/1471-2121-9-17. [DOI] [PMC free article] [PubMed] [Google Scholar]
- 10.Koyama Y, Barrett T, Hama Y, Ravizzini G, Choyke PL, Kobayashi H. In vivo molecular imaging to diagnose and subtype tumors through receptor-targeted optically labeled monoclonal antibodies. Neoplasia. 2007;9:1021–1029. doi: 10.1593/neo.07787. [DOI] [PMC free article] [PubMed] [Google Scholar]
- 11.Key M. Immunohistochemincal Staining Methods. Dako; Carpenteria, CA: 2006. [Google Scholar]
- 12.Robertson D, Savage K, Reis-Filho JS, Isacke CM. Multiple immunofluorescence labelling of formalin-fixed paraffin-embedded (FFPE) tissue. BMC Cell Biol. 2008;9:13. doi: 10.1186/1471-2121-9-13. [DOI] [PMC free article] [PubMed] [Google Scholar]
- 13.Viegas MS, Martins TC, Seco F, do Carmo A. An improved and cost-effective methodology for the reduction of autofluorescence in direct immunofluorescence studies on formalin-fixed paraffin-embedded tissues. Eur J Histochem. 2007;51:59–66. [PubMed] [Google Scholar]
- 14.Verkhusha VV, Lukyanov KA. The molecular properties and applications of Anthozoa fluorescent proteins and chromoproteins. Nat Biotechnol. 2004;22:289–296. doi: 10.1038/nbt943. [DOI] [PubMed] [Google Scholar]
Associated Data
This section collects any data citations, data availability statements, or supplementary materials included in this article.