Abstract
In this article we consider consequences of spatial coherences and conformations in diffraction of (macro)molecules with different potential energy landscapes. The emphasis is on using this understanding to extract structural and temporal information from diffraction experiments. The theoretical analysis of structural interconversions spans an increased range of complexity, from small hydrocarbons to proteins. For each molecule considered, we construct the potential energy landscape and assess the characteristic conformational states available. For molecules that are quasi-harmonic in the vicinity of energy minima, we find that the distinct conformer model is sufficient even at high temperatures. If, however, the energy surface is either locally flat around the minima or the molecule includes many degrees of conformational freedom, a Boltzmann ensemble must be used, in what we define as the pseudoconformer approach, to reproduce the diffraction. For macromolecules with numerous energy minima, the ensemble of hundreds of structures is considered, but we also utilize the concept of the persistence length to provide information on orientational coherence and its use to assess the degree of resonance contribution to diffraction. It is shown that the erosion of the resonant features in diffraction which are characteristic of some quasi-periodic structural motifs can be exploited in experimental studies of conformational interconversions triggered by a laser-induced temperature jump.
1. Introduction
It is remarkable that structural and energetic changes caused by conformational interconversions in bioorganic molecules are controlled by a subtle balance of weak forces such as hydrogen bonding, electrostatics, dispersion, and hydrophobic interactions.[1] The net result is the emergence of a unique function out of complexity.[1] One example is the rotational motion in biopolymers, which is known to largely determine the stability of the secondary and higher-order molecular structures as well as to control the dynamics of their (un)folding. At the end, the potential energy barriers of rotation about the Ramachandran angles, which define the backbone conformation of a protein, are surmounted and structures are stabilized by formation of bonding intramolecular interactions.[2] These interactions, in their turn, are weak enough to be disrupted at the expense of a few kcal/mole, or ~ 0.1 eV, underscoring the fluctional nature of the native fold. Thus, conformational change is at the heart of complex macromolecular function as it reveals the topology of the energy landscape guiding the (un)folding process.[3]
Earlier, we noted that experimental observations of transient changes reveal non-two-state dynamics of DNA/RNA melting and provide evidence for the existence of collapsed structures of DNA/RNA hairpins, labile in destacking but compact in nature.[4] Similar states, which often arise in protein folding, typically involve hydrophobic and/or secondary structure collapse.[5] Recently, we constructed a robust theoretical model of DNA (un)folding which predicted the temperature-dependent unfolding behavior.[6] To represent the ensemble-level temporal evolution or energetics of a large bioorganic molecule in three dimensions, coarse graining of the atomic detail to two or three variables is often required. Within the framework of our model, which allows for a lucid visualization of the collapsed state(s) in a simple 2D space, intermediate structures are well defined by the two coordinates of the landscape during (un)zipping, whereas the dependence of the (un)folding transition on the stem sequence and the loop length of the hairpin is shown in the enthalpic and entropic contributions to the free energy of the hairpin-water system.[6]
Because elementary events of (un)folding, which include conformational interconversions, often occur, or are triggered, on the ultrafast time scale, their inherent structural dynamics is elusive to the conventional methods of probing on the nanosecond and longer time scale. Such elementary events[7] span a time window—from femtoseconds to nanoseconds—which turns out to be orders of magnitude shorter than the typical time scale of the globular motions in biopolymers (microseconds or longer). As with molecular and materials studies, ultrafast electron diffraction (UED), crystallography (UEC), and microscopy (UEM) have the potential for direct visualization of biostructural change as they provide atomic-scale spatial and temporal resolutions.[8] In a recent study, we considered the ensemble-wide resonant features associated with certain structural motifs, such as α-helices, β-sheets, etc., and noted that they can be exploited in experimental studies of conformational changes triggered by a laser-induced temperature jump.[9] Thus, if a transition is induced in an ensemble of macromolecules possessing a particular structural motif, the long-term spatial quasi-periodicity associated with a number of repeating internuclear distances characteristic of the native (e.g., helical) fold is expected to vanish, or rapidly decrease, throughout the ensemble.
To explore the helix-to-coil transformation in a macromolecular ensemble of α-helices, we suggested an experimental UED methodology. Specifically, monitoring the fraction of the "pitch" internuclear distances (~5.5 Å), which is a natural measure of the residual helicity in the ensemble, was found to uniquely elucidate conformational change, even for isolated systems. In the theoretical UED simulations, the experimentally-determined structure of the protein thymosin-β9, which consists of two adjoining α-helices connected by a loop, was used to calculate the electron-diffraction patterns of isotropic molecular ensembles composed of up to N ≈ 4000 partially-randomized macromolecular conformations. The ensemble-averaged residual helicity measurements, though blind to some structural details, were shown to be robust and insensitive to the random, strain-free globular irregularities in the fold.[9] Due to the quasi-random nature of the conformational change, ensemble-convergent simulations provide a common ground for the theoretical biomolecular studies reported here.
In this paper, we examine the theoretical basis for understanding structural interconversions involving multiple rotational barriers to conformational changes. Of particular focus is the role played by the shape and dimensionality of the potential energy surface in isolated systems and their manifestation in UED. We begin by considering systems with two to three intramolecular large-amplitude motions (n-butane and trans-stilbene) and end with the analysis of arachidic acid, a system of 19 degrees of rotational freedom. For the latter molecule, the role of spatial coherence is highlighted.
2. Preliminaries
In the course of a UED experiment, the gas-phase (molecular) sample is typically clocked with an ultrashort laser pulse, and the changes are pictured by time-delayed ultrashort probing electron pulses.[10] Because of the very large cross-section for scattering of electrons, as compared to that of X-ray light, it is possible to achieve the ultrafast temporal resolution when studying molecular systems in the gas phase (a nontrivial task because of the lack of crystallinity and low molecular density of the sample). This conceptual methodology[11] has been further developed and applied in the studies of chemical reactions, excited-sate structure dynamics, and nonequilibrium conformational changes on their native (ultrafast) time scales.[12] Examples of experimental UED studies from this laboratory[13,14,15,16] include determination of transient structures in radiationless (dark) processes, bifurcations, and intramolecular structural rearrangements. The ongoing UED research involves studies of complex biomolecules, and the entry to this area was made in the recent study of the biological chromophore, indole,[16] in its ground- and excited-state structure. The challenge is in the study of systems with many conformers.
For such complex systems, the traditional analyses of gas electron diffraction (GED), which have been successful in the determination of thousands of structures,[17] need to be revisited. The theoretical framework of UED and GED methods have been developed and outlined in a number of sources.[18] Briefly, a 2D electron-scattering pattern represents an average over a certain molecular ensemble {l}, l∈[1, N]. The pattern is radially averaged to yield one-dimensional ensemble-averaged scattering intensities,
| (1) |
where
| (2) |
is an oscillatory, molecular structure- and conformation-dependent intensity component which is summed over all the internuclear distances of a molecule rij, i≠j, and over the ensemble N. The term BI(s) is a monotonic background scattering function, which is the sum of atomic and inelastic scattering and other experimental factors contributing to the background, and s is the magnitude of momentum transfer between an incident electron and an elastically-scattered electron; s = (4π/λ)·sin(θ/2), where λ is the de Broglie wavelength (0.069 Å at 30 keV), and θ is the scattering angle.
For the l,i,jth quasi-harmonic oscillator in thermal equilibrium, the isotropic molecular scattering intensity may be expressed as
| (3) |
where are the effective and equilibrium separations, respectively. Scattering amplitudes and atomic phases, fi(s) and ηi (s), have been tabulated for most of the atoms.[19] In the equilibrium (Boltzmann) limit, the root-mean-square (RMS) vibrational amplitude of an oscillator is given by
| (4) |
where denote the force constant and the frequency of vibration, respectively. Thus, in the ensemble-averaged modified molecular intensity,
| (5) |
where (k, n) is typically chosen to be the heaviest pair of atoms in the molecule, each is represented by a damped scattering intensity wave (the larger the , the greater the damping). It is noteworthy that form a set of parameters that can, in principle, be obtained from the experimental data. However, because Equation (5) has, in principle, more than one solution, a molecular model based on some estimated structure parameters and vibrational correction terms has to be constructed and further refined using a least-squares fitting procedure until a reasonable agreement between the experimental and calculated scattering intensities is achieved.
For small and medium-sized molecules, quantum chemical (QC) calculations followed by normal-coordinate analyses of the resulting Cartesian force fields are normally used to assess {rij} and {uij} along with higher-order vibrational corrections[20] (alternatively, RMS vibrational amplitudes may be obtained from spectroscopic data,[21] or estimated using empirical equations).[22] For a biomolecule, however, the ensemble averaging involves the entire landscape of quasi-random conformations, and a new methodology is needed in order to obtain structural changes and evolutions. The approach briefly described in one of our studies[9] allows for the generation of non-overlapping random macromolecular conformations within seconds on a standard CPU. When the model is extended to span the conformational landscape, we can obtain the ensemble-averaged diffraction patterns using an expanded version of the standard UED program developed in this laboratory.[18a] By analyzing the conformational ensemble jointly with its diffraction pattern, we can elucidate the (un)folding transitions from an experimental perspective.
Upon the Fourier transformation of <sM(s)> with respect to (s, r), the ensemble-averaged radial distribution function,
| (6) |
is obtained, where an artificial damping coefficient k is typically used to compensate for the unwanted oscillations induced by a finite data range (smax < ∞). Because <f(r)> has more intuitive appeal than <sM(s)>, both UED and GED results are typically interpreted in terms of <f(r)> which provides a snapshot of the density distribution of internuclear distances throughout the ensemble. In the case of UED, the procedure is repeated for a series of experimental measurements corresponding to a set of well-defined time points {tm} and, by Fourier-transforming {<sM (tm; s)>} with respect to (s, r), {<f(tm; r)>} is obtained. Finally, by taking the difference of electron-diffraction patterns recorded at different times, we obtain the ensemble-averaged diffraction differences,
| (7) |
which map the spatiotemporal evolution of the structure.
For almost half a century, the so-called pseudoconformer approach of Morino and Hirota,[23] which is sometimes confusingly termed dynamic GED model, has been successfully used to describe small-scale molecular systems with intramolecular large-amplitude conformational motions.[24] It is to be noted that, in the GED studies, the word “dynamic” typically denotes a stationary ensemble of pseudoconformers rather than the actual dynamics of interconversions between the conformers. To properly account for the scattering term arising from a given rij,
| (8) |
the generalized probability Pij(r)dr of finding rij ∈ [r, r + dr] has to be calculated (cf. Equation 3 which implies that Pij(r) is a Gaussian distribution function). Because the low-frequency torsional motions are assumed to be adiabatically separable from the quasi-harmonic molecular vibrations restricted by rigid potentials, Pij(r) is represented by
| (9) |
where a (multidimensional) probability density distribution function describing the slow large-amplitude motions, P(ϕ), is approximated by statistical weights of a representative set of discrete pseudoconformers. Notably, the pseudoconformers spanning the conformational space of a molecule are vastly different from the thermally stable rotational isomers of the molecule. Rather, they constitute a basis used to parameterize molecular ensembles similarly to the parameterization of electron shells of atoms by spherical harmonics.[25]
Because the studied specimen is normally assumed to be in thermal equilibrium, the anticipated pseudoconformer weights are typically obtained using simple Boltzmann statistics (the same approach is invoked to assess the mole fractions of rotational isomers parameterizing the distinct-conformer, or static, GED model). The far-from-equilibrium molecular ensembles which are observed during the course of UED measurements can also be described in a similar fashion, provided that their characteristic probability density distributions are defined. However, as we recently pointed out, nonthermal molecular ensembles represent a real challenge to both theory and experiment as they are often dominated by far-from-equilibrium structures accumulating in the vicinity of the classical turning points of a potential well.[8b] Due to the complex nature of the nonequilibrium phenomena, the explicit analytical and numerical methods, such as wavefunction calculations and Monte Carlo (MC) simulations,[26,18a] are usually invoked to unravel the details of the accompanying microscopic transformations.
A key point pertinent to the choice of a particular theoretical model (distinct-conformer vs. pseudoconformer) is a priori computational assessment of the conformational separability under the experimental conditions. The separability of rotational isomers in an ensemble depends on whether the rotational probability density distribution function P(ϕ), with ϕ = (ϕ1, ϕ2, ϕ3, …) being generalized rotational coordinates, is characterized by separable maxima in the ϕ-space. It has long been known that thermally-equilibrated ensembles of simple organic molecules which possess a set of thermally-stable rotational isomers and a limited number of internal rotational axes can, in principle, be approximated with a distinct-conformer model at the expense of enlarged RMS vibrational amplitudes. Though the resulting uij values can not be interpreted as physically meaningful quasi-harmonic vibrational amplitudes because they are forced to account for intramolecular motions other than quasi-harmonic thermal vibrations, the structure parameters obtained from such studies in many cases come out to be in agreement with one's expectations.[18a]
However, flexibility and fluxionality characteristic of proteins, DNAs/RNAs, and other biopolymers with complex high-dimensional energy landscapes preclude any use of the primitive quasi-harmonic model which does not provide an adequate description of the conformational space. It is to be noted that, besides low energy barriers between rotational isomers which facilitate both (un)folding and secondary structure formation,[2] there exist areas of landscape which are energetically unfavorable. Because biopolymers are known to be sterically frustrated molecules,[27] the self-avoidance condition imposes severe restrictions on the freedom of conformational interconversions. As a result, there exist a large number of collapsed structures facilitating the search for the native fold which are energetically proximal to the native structure(s) possessed by the macromolecule. In addition, the coupling between individual rotational motions is usually quite strong because of the steric strain. Aside from the above-mentioned complications to the energy landscape for macromolecules, the existence of flat U-shaped potentials E(ϕ) of internal rotation precludes formation of well separated rotational isomers, even for small molecules (see below).
It is perhaps instructive to comment on the relevance of P(ϕ) for large biopolymers. At thermal equilibrium, the summation over the upper energy levels of a given potential which is required to obtain pseudoconformer populations throughout an ensemble can, in principle, be replaced with a calculation of Boltzmann weights of the pseudoconformers parameterizing the ensemble, provided that the number of molecules in the ensemble is infinitely large. Unlike vibrational wavefunctions of a simple harmonic oscillator which can be assessed analytically or, in general, the upper-level wavefunctions of an nD restricting potential (n ≥ 1), which can be assessed by numerically diagonalizing the corresponding Hamiltonian, the exact rotational wavefunctions of a biomolecule are impossible to obtain. Moreover, the rotational potential itself is usually not known, which precludes a precise assessment of the statistical weights of the pseudoconformers. However, if E(ϕ1), E(ϕ2), E(ϕ3), … of the biopolymer are assumed to be known, one can calculate P(ϕ1), P(ϕ2), P(ϕ3), … and thus obtain the approximate uncorrelated Boltzmann probability density distribution P(ϕ) throughout the ensemble. The resulting P(ϕ), in its turn, may be used to generate a pseudocomformer ensemble of a finite size which will satisfy P(ϕ) with a given degree of precision. The latter approach is used here to assess the temperature dependence of the pseudoconformer populations throughout the ensemble of 1024 molecules of a long-chain alkane. Self-avoidance is taken care of by restricting conformation-dependent nonbonded distances, excluding {Cl…Cl+3} distances already described by {P(ϕl)} (see Figure 1), to the sum of van der Waals-type radii of the atoms involved, as discussed below.
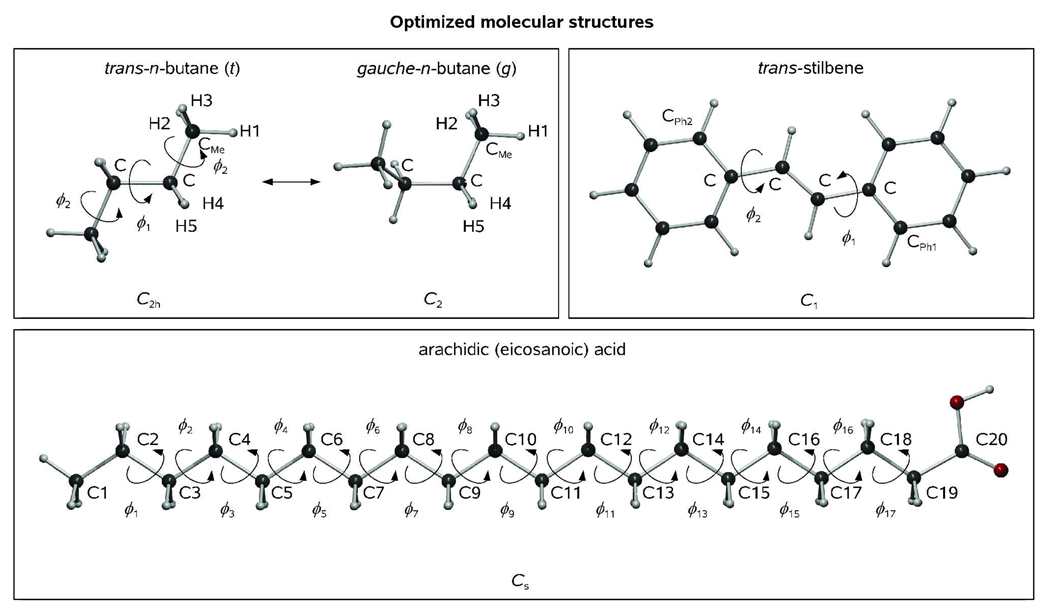
Figure 1.
Optimized molecular structures of trans-n-butane (t), gauche-n-butane (g), trans-stilbene, and arachidic (eicosanoic) acid as obtained using specified symmetry constraints at our standard computational level (see Text).
In what follows, we first focus on the structure and conformational preferences of a small linear saturated hydrocarbon molecule, n-butane, which is intended to serve as a benchmark system for long-chain alkanes. Having assessed the energy differences and structure parameter variations which accompany conformational interconversions of n-butane, we construct a pseudoconformer model and demonstrate the applicability of the distinct-conformer model of n-butane in a wide range of temperatures. To outline the impact of certain structural motifs on the conformational preferences of molecules possessing single C-C bonds, we compare potential energy landscapes, rotational probability-density distributions, and theoretical electron-diffraction patterns of stilbene and n-butane (it is noteworthy that a robust distinct-conformer model cannot be constructed in the case of stilbene; see below). Finally, stimulated by an earlier experimental study of fatty acids and phospholipids on substrates,[28] we use thermal probability-density functions to generate large molecular ensembles of arachidic acid in the gas phase and simulate their averaged electron diffraction patterns at a variety of temperatures. The role of the structural resonance[9] and the significance of the pseudoconformer representation are explored in detail for the linear alkane chains, and connections to the (un)folding transitions in proteins are made.
3. Conformational Prototypes: Case Studies
n-Butane
Molecular structure and rotational isomerization of gaseous n-butane have been repeatedly studied by Bartell and coworkers for more than two decades.[29] From GED data[30] and DFT calculations,[31] there exists a local potential energy minimum characteristic of gauche-butane (symmetry group C2; g) about 3 kJ/mol above the structure of trans-butane (symmetry group C2h; t), which represents the global minimum on the potential energy hypersurface.[32] Here, we analyse computed energy differences and structure parameter variations which accompany conformational interconversions in n-butane, construct a pseudoconformer GED model which explicitly treats large amplitude motions in n-butane, and assess the temperature dependence of the conformational mixture of n-butane in terms of a simple but robust two-conformer model of Bartell.
Molecular structures of the two rotational isomers of n-butane as obtained at our standard B3LYP/6-311G(d,p) computational level using GAUSSIAN software package[33] are shown in Figure 1. Most importantly, τCMe-C-C-CMe(g) exceeds 60°, the value characteristic of the idealized g-conformer of n-butane, by 6–12° (τcalc = 65.6°, τGED = 72(5)°[29e]). This may be attributed to the influence of a steric strain, as the closest H…H nonbonded distance in the g-conformer of n-butane equals 2.38 Å, and αC-C-CMe opens up by about 1° on going from the t-conformer to the g-conformer. Indeed, because the van der Waals radius of a hydrogen atom equals 1.20 Å,[34] the two methyl groups of gauche-butane must be engaged in a pronounced steric interaction (this is also evidenced by calculated CMe…CMe nonbonded distance of 3.19 Å, cf. van der Waals radius of a Me group which reportedly equals 2.0 Å).[35] Interestingly, the calculated rC-C(g) = 1.537 Å is found to exceed rC-C(t) = 1.533 Å by only 0.004 Å. Calculated C…CMe/CMe…CMe nonbonded distances equal 2.56/3.93 and 2.58/3.19 Å in t- and g-conformers of n-butane, respectively.
Simultaneous internal rotations with respect to the three C-C bonds of n-butane give rise to a potential energy landscape populated by an ensemble of rotational pseudoconformers. The three large amplitude motions are coupled because varying τC-CCMe-H1 causes τCMe-C-C-CMe to deviate significantly from its equilibrium value, and vice versa. For simplicity, we impose a C2 point group symmetry on the structural model of the molecule. The potential energy landscape which hinders the torsional motions in n-butane can then be defined in terms of two, rather than three, rotational coordinates (ϕ1 = τCMe-C-C-CMe, ϕ2 = τC-C-CMe-H1) which range from the eclipsed configuration (ϕ1,= 0°, ϕ2 = 0°) to the staggered configuration (ϕ1,= 180°, ϕ2 = 180°) thus spanning the entire conformational space. A more elaborate treatment of internal rotations in n-butane is, of course, feasible but, given that it requires construction of 4D potential-energy surfaces, we impose the above-mentioned symmetry constraints on our model because the case study of n-butane is only invoked here as an illustration.
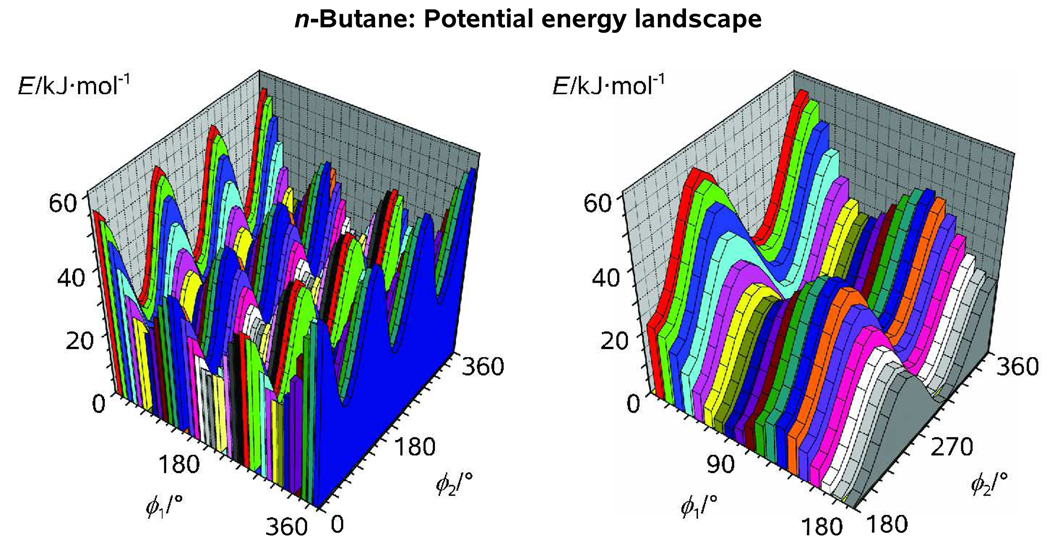
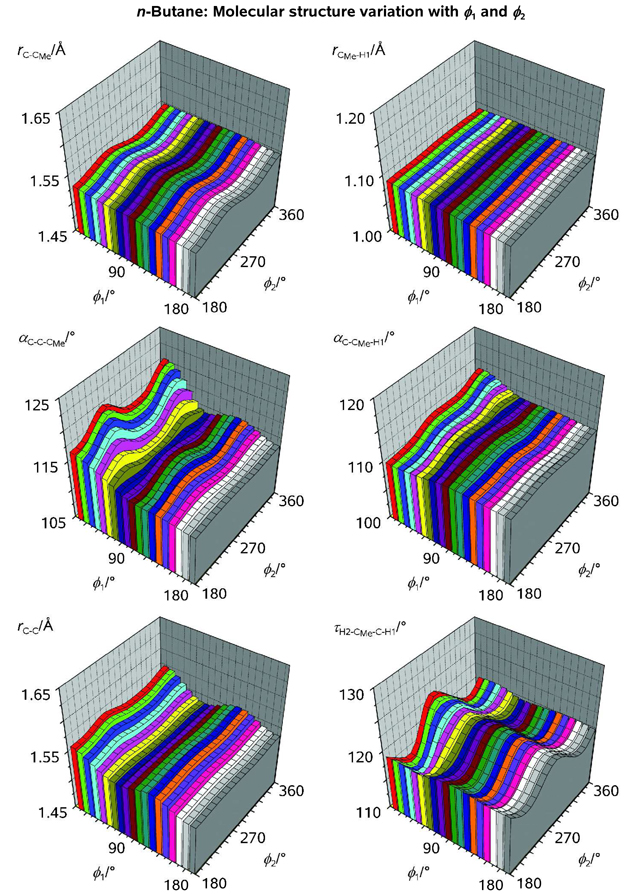
The potential energy landscape of n-butane as obtained from a relaxed (ϕ1, ϕ2) scan calculation with a step of Δ ϕ = 10° is presented in Figure 2. For a given value of ϕ1 = 0, 10, … 360°, the Me groups would make a complete turn from ϕ2 = 0° to ϕ2 = 360° with a step of 10° (colored slices). For clarity, only the uppermost quadrant of the (ϕ1, ϕ2) grid will be considered here (see Figure 2). We note that the two Me groups of n-butane are rotated concertedly within the framework of our model. Thus, the trans-to-trans conformational barrier we obtain as we move along ϕ2 (23.9 kJ/mol) is twice the barrier to internal rotation “per Me group” (~12.0 kJ/mol). The latter value is similar to our estimate for the trans-to-gauche isomerization barrier along ϕ1 (13.6 kJ/mol) which implies that the three torsional motions in n-butane are almost equally significant. Notably, rCMe-H1 is practically unaffected by the conformational changes. The same is true for both αC-C-CMe and αC-CMe-H1 within the “strain-free” area of the landscape (66° < ϕ1 < 294°). The local symmetry of a Me group, however, is dependent on the value of ϕ2 as τH2-CMe-C-H1 may deviate from 120° by ±3–4° (Figure 3).
Figure 2.
Rotational potential of n-butane as obtained from a relaxed (ϕ1, ϕ2) scan calculation with a step of 10° at our standard computational level; Note that imposing a C2 point group symmetry on the structure of n-butane implies a concerted rotation of its two Me groups (see Text).
Figure 3.
Rotational variations of selected structure parameters on n-butane (see Legend and comments in the Text). During the scan calculation over the two rotational coordinates shown in Figure 2 the structure parameters of n-butane (symmetry group C2) were fully optimized.
It is noteworthy that if the internal rotation with respect to the central C-C bond is explored, the corresponding bond length, rC-C, exhibits a pronounced variation as a function of ϕ1 (Figure 3). However, if the internal rotation occurs with respect to a (peripheral) C-CMe bond, rC-CMe demonstrates a much weaker variation as a function of ϕ2. According to Weinhold and coworkers, the vicinal hyperconjugation plays an important role in determining the preference for staggered conformations characteristic of linear alkanes.[36] This is in agreement with rC-C shortening in the staggered configuration of n-butane as compared to the eclipsed configuration as the hyperconjugative delocalization is only efficient when in-phase lobes of vicinal σ and σ*' orbitals eclipse (ϕ = 60, 180, 300°). Because in the g-conformer (ϕ1 = 65.6°, ϕ2 = 177.3°) the electron delocalization is hindered, rC-C(g) turns out to be 0.004 Å longer than rC-C(t) (see above). If, on the other hand, the in-phase lobes of vicinal σ and σ*' orbitals are staggered, rC-C increases by 0.02 (ϕ1 = 120, 240°) to 0.03 (ϕ1 = 0°) Å, which may be attributed to the absence of hyperconjugative delocalization and an increase in the steric strain, especially at ϕ1 = 0°. As seen in Figure 3, a similar (but weaker) effect accompanies rotation of a Me group in n-butane. However, a recent theoretical study has reinstated that conventional steric repulsions overwhelmingly dominate the barriers in ethane.[37]
In a series of GED studies carried out at room temperature, Bartell and coworkers invoked the following assumptions in their analysis: (i) the entire ensemble of rotational pseudoconformers of n-butane can be reduced to a thermally-weighted mixture of gauche-butane and trans-butane, and (ii) the structure parameters of the two rotamers of n-butane are essentially the same.[29a,c,e] Generally, the structure of a molecule is determined by 3n − 6 degrees of freedom, where n is the number of atoms in the molecule. The pseudoconformer GED model used in our study implies that, for each node of the (ϕ1, ϕ2) grid shown in Figure 4, both the energy change and the 3n − 6 structure parameter variations obtained from DFT calculations are taken into account. Below, we present a detailed comparison of an improved two-conformer model of Bartell with a number of pseudoconformer models. In the case of n-butane, it is also demonstrated that the distinct-conformer approach is applicable in a wide range of temperatures.
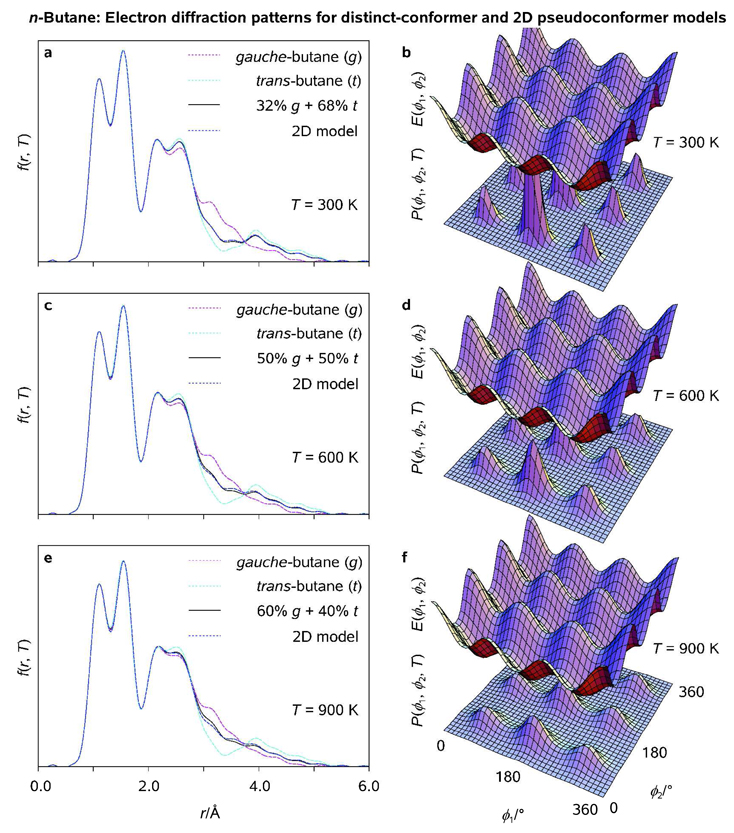
Figure 4.
Radial distribution functions (<f(r, T)>; a, c, e) and thermal probability density distribution functions (P(ϕ1, ϕ2, T); b, d, f) as obtained for fully-correlated 2D pseudoconformer models of n-butane at T = 300, 600, 900 K, respectively; <f(r, T)> characteristic of the two-conformer models of Bartell[29] and calculated potential energy surfaces E(ϕ1, ϕ2), cf. Figure 2, are plotted for comparison (see Legend).
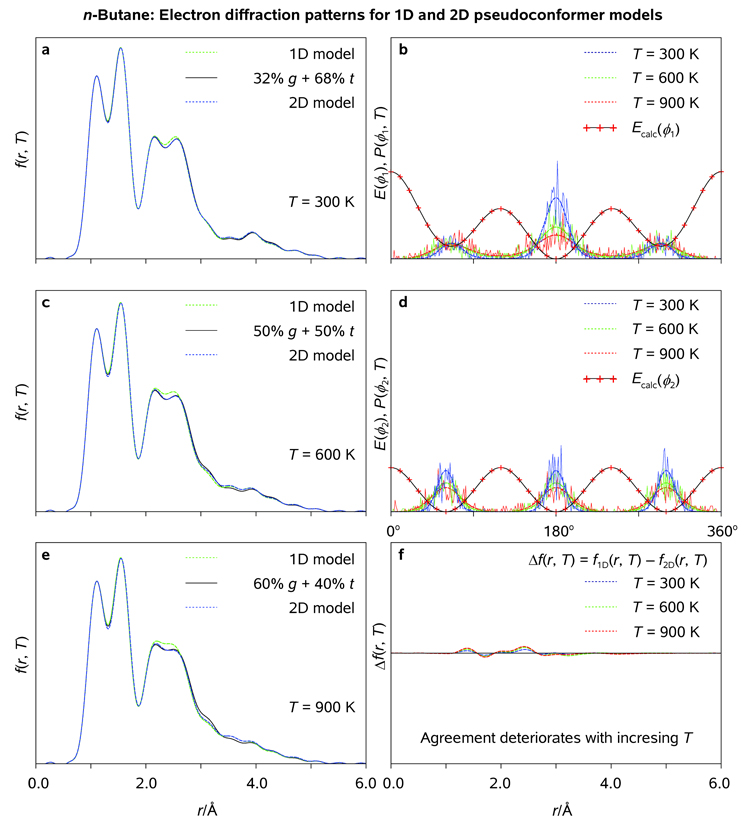
The electron diffraction simulations discussed below were carried out as follows. First, the two-conformer model we constructed, (1 − α)g + α t, where α ∈ [0, 1] is the mole fraction of trans-n-butane in the mixture, was similar to that of Bartell, apart from the fact that molecular structures of the g- and t-rotamers of n-butane (Figure 1) were optimized at our standard computational level (see above). Second, the (simplified) 1D pseudoconformer model, which assumed no coupling between ϕ1 and ϕ2, implied that rotational barriers E(ϕ1) and E(ϕ2) were obtained from 1D relaxed potential-energy surface scans over ϕ1 and ϕ2, respectively; Molecular ensembles of 1024 rotational pseudoconformers of n-butane were generated using 1D thermal probability density functions P(ϕ1, T) and P(ϕ2, T), Figure 5; The model was based on the optimized structure of the t-rotamer (no changes in the structure parameters other than ϕ1 and ϕ2 were allowed). Third, the (correlated) 2D pseudoconformer model was based on the relaxed (ϕ1, ϕ2) potential energy surface scan, Figure 2 and Figure 3; 37 × 37 = 1369 rotational pseudoconformers of n-butane representing the nodal values of τCMe-C-C-CMe and τC-C-CMe-H1 on the (ϕ1, ϕ2) grid were assigned the statistical weights obtained from the calculated 2D thermal probability density distribution functions P(ϕ1, ϕ2, T), Figure 4; The 3n −6 = 36 structure parameter variations (n = 14 for n-butane) were included in the model as 2D functions of ϕ1 and ϕ2. Fourth and finally, radial distribution functions <f(r, T)> were calculated using UEDANA[18a] for the above-mentioned models at T = 300, 600, and 900 K with an artificial damping factor of 0.0084 Å2; RMS amplitudes of thermal vibrations were estimated using the empirical equations at T = 300 K and further extrapolated to elevated temperatures.
Figure 5.
Radial distribution functions (<f(r, T)> a, c, e) and thermal probability density distribution functions (P(ϕ1, T), P(ϕ2, T); b, d) as obtained for uncorrelated 1D pseudoconformer models of n-butane at T = 300, 600, and 900 K; <f(r, T)> characteristic of fully-correlated 2D pseudoconformer models and two-conformer models of Bartell[29] are plotted for comparison. Pertinent diffraction differences are shown as well (see Legend).
Variations of the 2D and 1D rotational probability density functions with ϕ1 and ϕ2 are shown in Figure 4 and Figure 5 at different temperatures. At T = 300 K, the radial distribution functions <f(r, T)> are clearly dominated by t- and g-like pseudoconformers of n-butane with the two Me groups in staggered orientation (ϕ2 ≈ 60, 180, 300°). Along with low electron-scattering power of H atoms, this provides a posteriori justification of imposing the C2 molecular symmetry on the models of n-butane. A slight discrepancy between the 1D and 2D pseudoconformer models (Figure 5) may be attributed to both model imperfections, such as crude vibrarional corrections and fixed structure parameters of the g-rotamer (see above) and increasing mole fractions of intermediate pseudoconformers and the g-rotamer at elevated temperatures. We conclude that sharp, separable maxima in P(ϕ1, ϕ2, T) allied with the averaging nature of electron-diffraction experiments renders the (uncorrelated) 1D pseudoconformer model fairly accurate in the case of linear alkanes.
It is noteworthy that, in full agreement with the GED[29e] and spectroscopic[38] evidence analyzed by Bartell, our 2D pseudoconformer model predicts 68, 50, and 40% fractions of trans-n-butane at T = 300, 600 and 900 K, respectively. The two-conformer [(1 −α)g + αt] and the pseudoconformer radial distribution functions fall almost exactly on top of each other at room temperature (Figure 4). Despite some slight deterioration of the agreement between the two approaches at elevated temperatures, it remains satisfactory even at T = 900 K, which can be attributed to the statistical separability of the t- and g-rotamers of n-butane. Unsophisticated as it may seem, the uncorrelated 1D pseudoconformer model may also be used to simplify the explicit treatment of internal rotations in biomolecules such as long-chain linear alkanes and possibly proteins. Finally, we note that because the mole fraction of trans-butane is expected to approach 98% on cooling of the conformation mixture to T = 100 K,[29e] the so-called "gauche effect"[39] in n-butane has a purely thermal nature.
trans-Stilbene
Unlike n-butane which is composed of sp3-hybridized C-atoms forming a flexible hydrocarbon chain, trans-stilbene (or trans-1,2-diphenylethylene) possesses a number of fairly rigid π-systems which determine its unique conformational preferences. The major controversy surrounding the structure of trans-stilbene is related to exact planarity (or nonplanarity) of the molecule in its ground electronic state.[40] From experimental studies, it has been derived that the potential functions of internal rotation for free molecules of phenylethylene (styrene) and trans-stilbene are similar in form and that they have a broad, flat minimum at an angle 0 ≤ ϕ ≤ 20° between the planes of the phenyl group and the ethylene fragment.[41] A 2D pseudoconformer GED and ab initio study of Konaka and coworkers recently addressed the issue of planarity of the electronic ground state in trans-azobenzene.[42] Despite the small barrier (at ϕ = 0°) separating the two slightly nonplanar rotamers, as obtained at the MP2/6-31+G* computational level, the experimentally determined topology of the potential energy landscape of trans-azobenzene revealed that that the molecule is planar with a 99.1% certainty. Below we demonstrate that the inversion barrier at ϕ = 0° may be an artifact of using deficient ab initio methods.
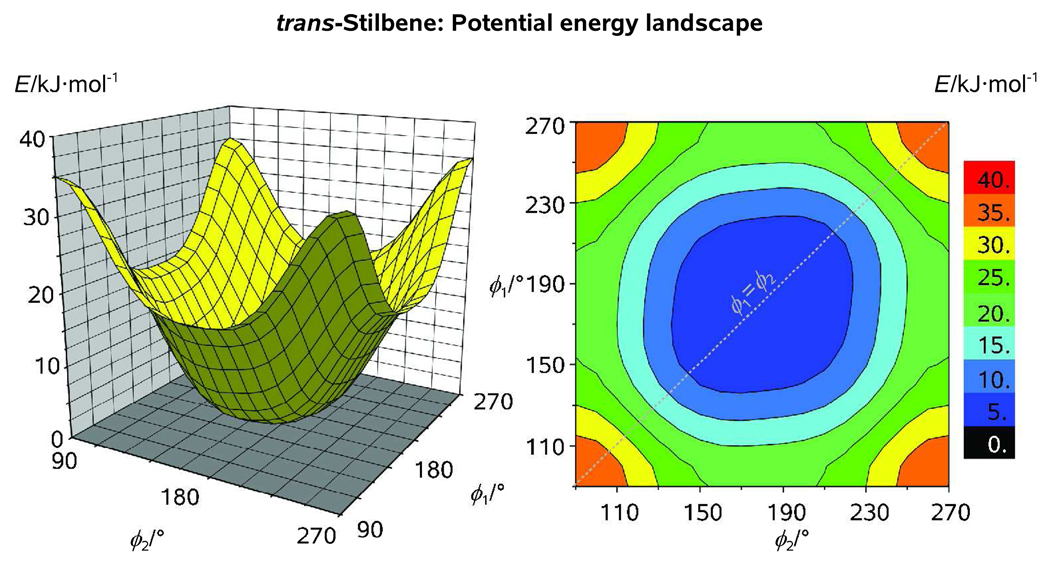
A 2D rotational potential of the ground electronic state of trans-stilbene as obtained at our standard computational level is presented in Figure 6 (cf. Figure 8 in Ref. [43]; see also Figure 1 for the optimized molecular structure). Because no symmetry constraints were imposed on the theoretical model of the molecule, two rotational coordinates, ϕ1 = ϕCPh1-C-C=C and ϕ2 = τCPh2-C-C=C, ranging from 90° to 270° were chosen to define the orientations of the two phenyl groups with respect to the ethylene plain (Figure 6). A relaxed (ϕ1, ϕ2) scan calculation with a step of Δϕ = 10° was then carried out (for a given orientation of the first phenyl group, ϕ1 = 90, 100, … 270°, the second phenyl group would make a turn from ϕ2 = 90° to ϕ2 = 270° with a step of 10°). The resulting potential energy landscape has a single broad minimum centered at (180°, 180°) which corresponds to the planar equilibrium structure. Because the two phenyl groups are reportedly engaged in an electrostatic interaction,[41] the rotational landscape is slightly asymmetric with respect to directions of the phenyl-group twisting (Figure 6). The topology of the landscape indicates that there is a slight bias towards nonplanar pseudoconformers of trans-stilbene possessing a quasi-C2 molecular symmetry (ϕ1 ≈ ϕ2). For comparison with the 2D GED and ab initio study of trans-azobenzene, the calculations were repeated at MP2/6-31+G* computational level.[42] Slightly nonplanar equilibrium structures of trans-stilbene obtained at this level of theory may be indicative of computational deficiency of the ab initio approach used in Ref. [42].
Figure 6.
Rotational potential of trans-stilbene as obtained from a relaxed (ϕ1, ϕ2) scan calculation with a step of 10° at our standard computational level; Note that, despite the flatness of the potential in the vicinity of the equilibrium structure, there exists a slight bias toward the nonplanar pseudoconformers of trans-stilbene which possess a quasi-C2 symmetry (ϕ1 ≈ ϕ2).
Figure 8.
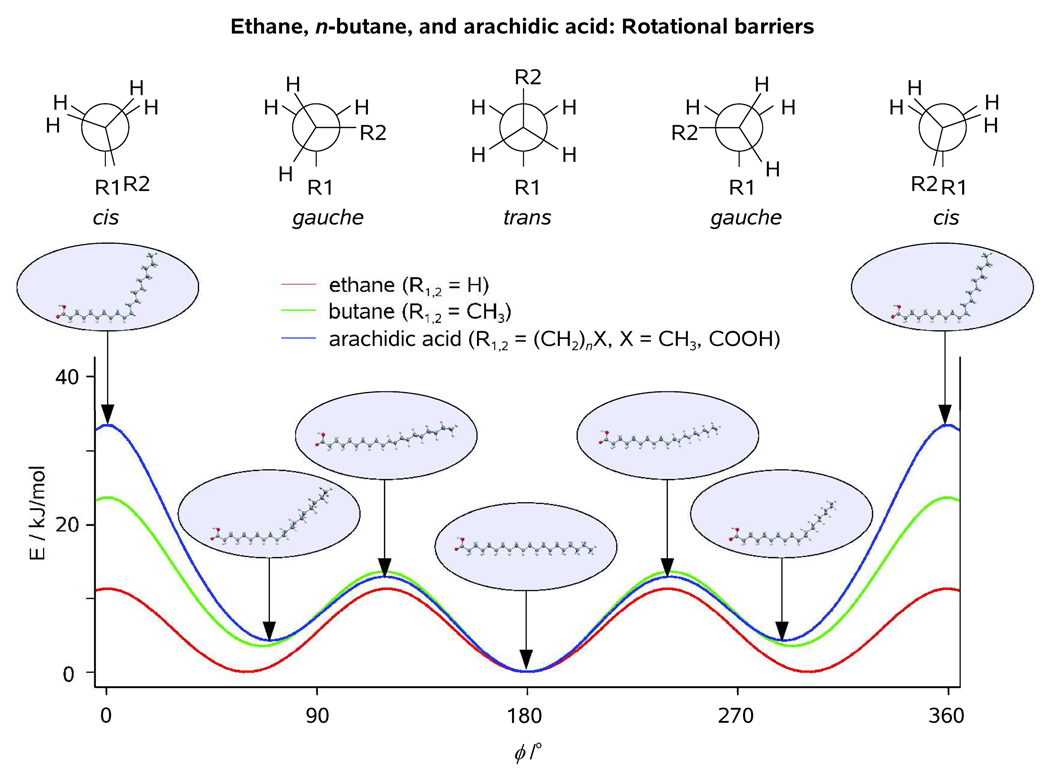
1D rotational potentials with respect to the central C-C bond as obtained at our standard computational level for ethane, n-butane, and arachidic acid (see Text). Molecular geometries characteristic of the eclipsed and staggered conformations of arachidic acid with respect to ϕ9 are shown in the insets for clarity.
Generally, the topology of the rotational potential of trans-stilbene implies that the structure of its electronic ground state is fluctional, i.e., there exists an ensemble of rotational pseudoconformers energetically proximal to the "equilibrium structure". Regardless of whether such structure is planar, or slightly nonplanar, there will always be a number of energy quanta deposited into the large-amplitude modes at elevated temperatures. The resulting rotational wavepacket will wander within the 2D potential energy well depicted in Figure 6 and, because of the averaging nature of GED/UED, the molecular structure obtained will of course be nonplanar; for example, CO2 is a linear molecule but high-temperature GED data reflect a bent geometry as the probability of all the bent configurations increases (the so-called shrinkage effect).[44] For stilbene, reports vary on the actual value of ϕ, and there are studies that suggest nonplanarity at elevated temperatures.[40b] As discussed below, the restricting potential is flat and care has to be exercised in assessing the values of ϕ. Thus, the explicit pseudoconformer modeling of intramolecular rotations must be used to account for the conformational preferences of gaseous trans-stilbene.
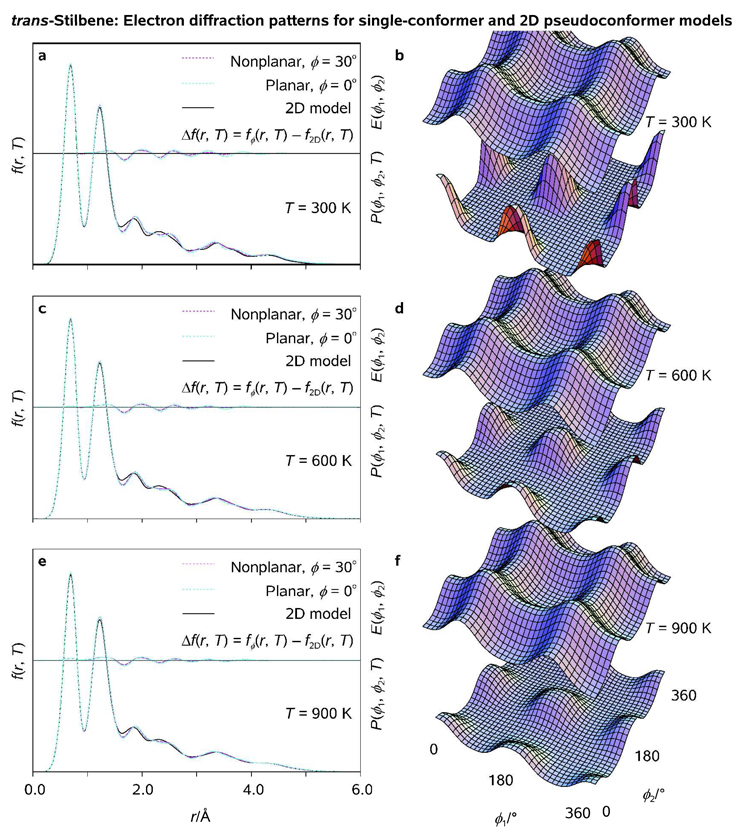
The electron diffraction simulations presented below were carried out as follows. First, two single-conformer models featuring ϕ1 = ϕ2 = 180° and ϕ1 = ϕ2 = 150° (ϕ = 30°) were constructed; All molecular structure parameters except ϕ1 and ϕ2 were optimized at our standard computational level (see above). Second, the (correlated) 2D pseudoconformer model was based on the relaxed (ϕ1, ϕ2) potential energy surface scan, Figure 6; 19 × 19 = 361 rotational pseudoconformers of trans-stilbene representing the nodal values of τCPh1-C-C=C and τCPh2-C-C=C on the (ϕ1, ϕ2) grid were assigned the statistical weights obtained from the calculated 2D thermal probability density distribution functions P(ϕ1, ϕ2, T), Figure 7; The 3n − 6 = 72 structure parameter variations (n = 26 for trans-stilbene) were included in the model as 2D functions of ϕ1 and ϕ2. Third and finally, radial distribution functions <f(r, T)> were calculated using UEDANA[18a] for the above-mentioned models at T = 300, 600, and 900 K with an artificial damping factor of 0.02 Å2; RMS amplitudes of thermal vibrations were estimated using the empirical equations at T = 300 K and further extrapolated to elevated temperatures.
Figure 7.
Radial distribution functions (<f(r, T)>; a, c, e) and thermal probability density distribution functions (P(ϕ1, ϕ2, T); b, d, f) as obtained for fully-correlated 2D pseudoconformer models of trans-stilbene at T = 300, 600, 900 K, respectively; <f(r, T)> characteristic of single-conformer models which represent planar (ϕ = 0°) and nonplanar (ϕ = 30°) optimized molecular structures and calculated potential energy surfaces E(ϕ1, ϕ2), cf. Figure 6, are plotted for comparison (see Legend).
Variations of the 2D rotational probability density functions with ϕ1 and ϕ2 are shown in Figure 7 at different temperatures. Because the 2D potential energy well in trans-stilbene is wide and flat (cf. "particle in a box"), the most likely structures which dominate the molecular ensemble are energetically proximal. As a result, the radial distribution function <f(r, T)> of the pseudoconformer model is not very sensitive to temperature. The temperature dependence of radial distributions characteristic of distinct-conformer models has been discussed in detail elsewhere using Fe(CO)4 as an example.[18a] Briefly, because intramolecular motions in vibrationally-hot molecular ensembles can not be considered small and harmonic, the quasi-harmonic treatment of molecular vibrations becomes less adequate at elevated temperatures. Within the framework of a quasi-C2 single-conformer model, neither ϕ = 0° nor ϕ = 30° provide an adequate description of the conformational space of trans-stilbene. The structural proximity between planar and slightly nonplanar pseudoconformers is also noteworthy, as it must preclude a reliable experimental discrimination between molecular structures of the pseudoconformers which fall within the ϕ ≤ 30° nonplanarity range (Figure 7).
Using the two case studies outlined above as an example, we have demonstrated that in the absence of intermolecular interactions and/or intramolecular chemical processes, such as formation or rupture of hydrogen bonds between molecular fragments, the conformational preferences of an isolated molecular ensemble can be traced down to an interplay of large-amplitude motions. Depending on how these motions are hindered and coupled, we either describe the rotational energy landscape as quasi-harmonic and dominated by the isomers at the energy minima (distinct-conformer approach) or U-shaped, requiring a (multidimensional) Boltzmann ensemble to capture the conformational distribution (pseudoconformer approach). For small and medium-sized molecules, calculated structure parameter variations associated with conformational interconversions and realistic vibrational corrections obtained from normal coordinate analyses of Cartesian force fields may be taken into account. Having considered these prototype systems, we next address conformational interconversions for bio-type molecules and demonstrate that multidimensional Boltzmann ensembles account for their behavior at thermal equilibrium.
4. Structural Resonance in Macromolecules
Long-Chain Hydrocarbons: Arachidic Acid
Perhaps the simplest of membrane-type structures is a bilayer of fatty acids. These long hydrocarbon chains possess a quasi-1D spatial periodicity, self-assemble on surfaces (substrates) and can also be made as “2D crystals”. Stimulated by recent experimental and theoretical studies of the structural dynamics of fatty acids and phospholipids on substrates,[45,46] in the present Section we discuss the theoretical modeling of conformational interconversions in molecular ensembles of arachidic acid at thermal equilibrium.
The molecular structure of arachidic acid, C19H39COOH, was optimized at our standard computational level imposing the Cs point symmetry group which implied planarity of the backbone chain of the molecule (Figure 1). The backbone-averaged values of bond distances and valence angles, <rC-C> and <αC-C-C>, were equal to 1.533 Å and 113.6°, respectively. A single rotational coordinate, ϕ = τC9-C10-C11-C12 ranging from 0 to 180° was chosen to define the relative orientation of the two equally large fragments of the molecule, and a scan calculation with a step of Δϕ = 10° was then carried out with respect to ϕ (in order to save the CPU time, all molecular structure parameters except ϕ were kept fixed to their optimized values throughout the scan). Though the resulting potential to internal rotation closely resembled that of n-butane on going from trans- to gauche-configuration with respect to C10-C11 axis (60° < ϕ < 180°), the rotational barrier at ϕ = 0° turned out to be considerably higher in arachidic acid (E0 = 34 kJ/mol, cf. 24 and 11 kJ/mol as obtained for n-butane and ethane, respectively; see Figure 8). It is to be noted, however, that relaxing the structural constraints imposed on the molecule, including those imposed on the C9-C10-C11-C12 moiety (rC-C = 1.533 Å, αC-C-C = 113.6°), during the scan calculation is expected to somewhat decrease the value of E0 that we obtained for arachidic acid, which will further improve the agreement between the rotational potentials of arachidic acid and n-butane. It is also noteworthy that the relative impact of E0 on the thermal probability density distribution which describes the internal rotation in arachidic acid is insignificant because P(ϕ, T) → 0 for E → E0 in the assumption of thermal equilibrium.
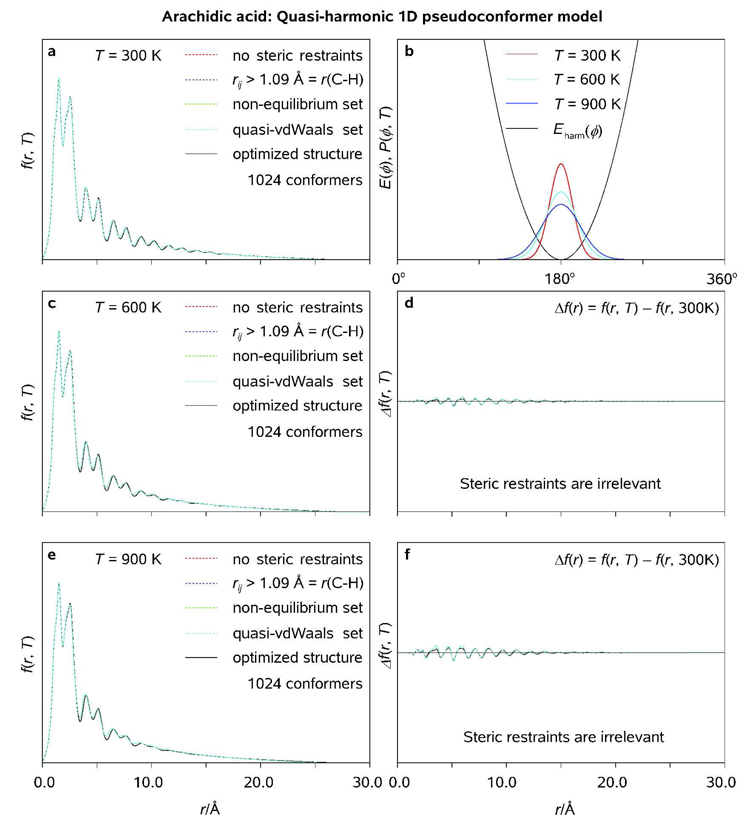
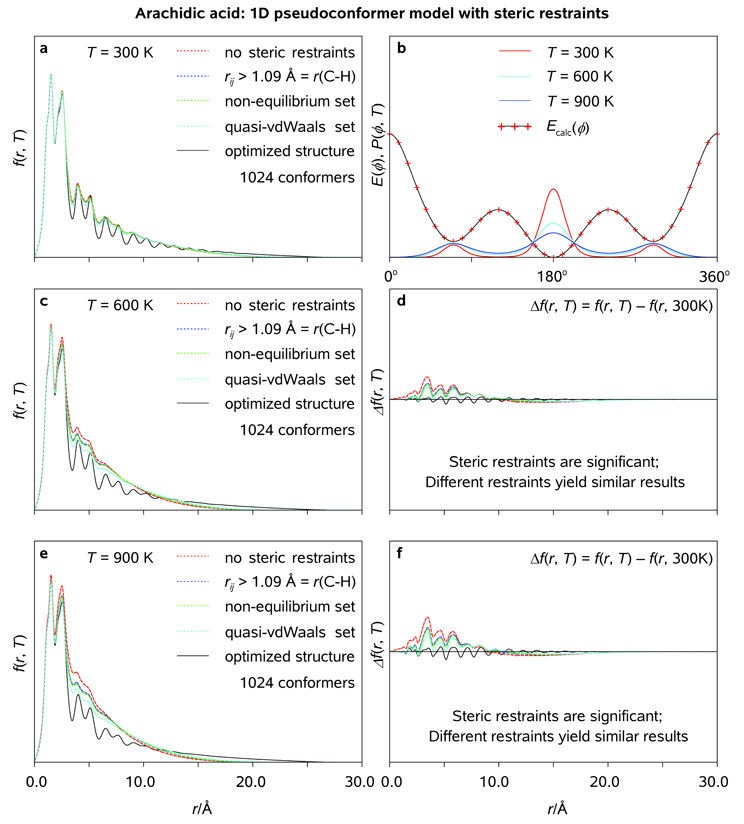
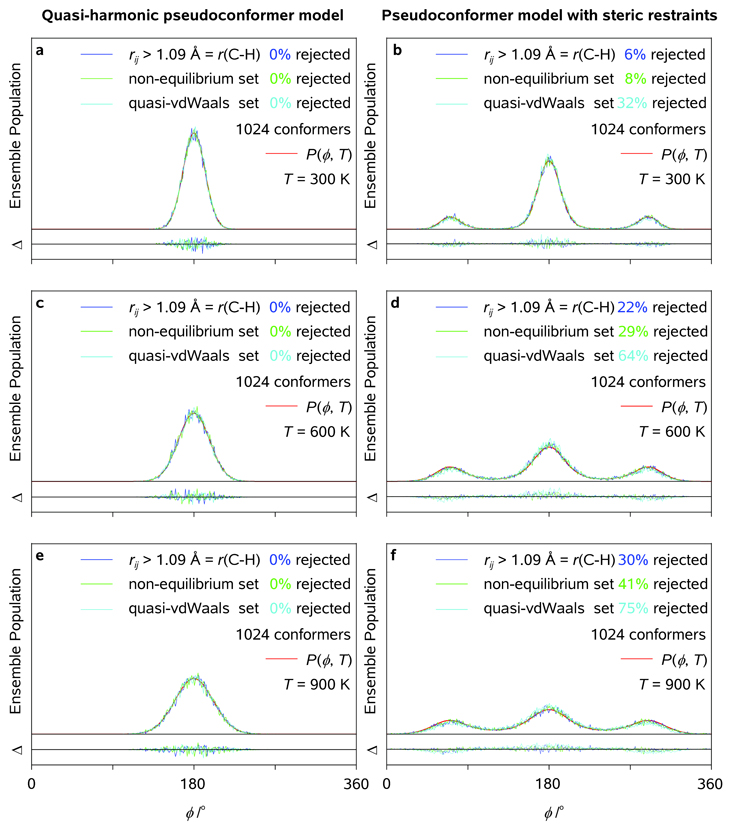
The electron diffraction simulations discussed below were carried out as follows. First, the single-conformer model of a "straightened" molecule of arachidic acid was constructed using the structure parameters optimized at our standard computational level (see above). Second, the (simplified) pseudoconformer model, which assumed no coupling between ϕl = τCl-Cl+1-Cl+2-Cl+3, l ∈ [1,17], implied that rotational barriers E(ϕl) were obtained from the 1D potential-energy surface scan over ϕ = ϕ9; 1024 random, nonlinear rotational pseudoconformers of arachidic acid were generated using 1D thermal probability density functions P(ϕl, T) = P(ϕ, T); The model was based on the optimized structure of the straightened Cs rotamer (no changes in the structure parameters other than ϕl were allowed); A given pseudoconformer characterized by {ϕl} was excluded from the ensemble if it did not satisfy one of the following steric restraints: (i) rij > 1.09 Å; (ii) rij > 1.09 Å, rCl…Cj>l+3 > 2.8 Å, and rO…Cj<18 > 2.8 Å ("non-equilibrium" restraint), or (iii) rij > 1.09 Å, rCl…Cj>l+3 > 3.4 Å, and rO…Cj<18 > 3.4 Å (reproducing a van der Waals-type restraint). Third, the local (ϕl ≈ 180°) quasi-harmonic pseudoconformer model was constructed by repeating the above procedure for a single-well harmonic potential closely approximating the central potential well of E(ϕl); the resulting electron diffraction patterns were compared with those obtained using both simplified pseudoconformer model and single-conformer model based on the optimized molecular structure of arachidic acid (symmetry group Cs). Fourth, the fully-correlated pseudoconformer model of arachidic acid was not constructed because DFT calculations of the excessive number of pseudoconformers and structure parameter variations were not feasible for arachidic acid. Fifth, and finally, radial distribution functions <f(r, T)> were calculated using UEDANA[18a] for the above-mentioned models at T = 300, 600, and 900 K with an artificial damping factor of 0.01 Å2; RMS amplitudes of thermal vibrations were estimated using the empirical equations at T = 300 K and further extrapolated to elevated temperatures.
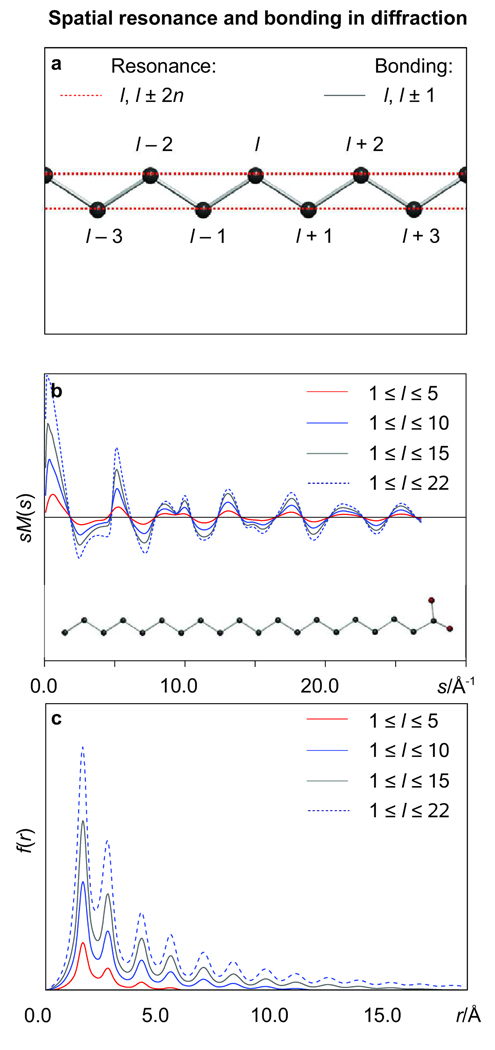
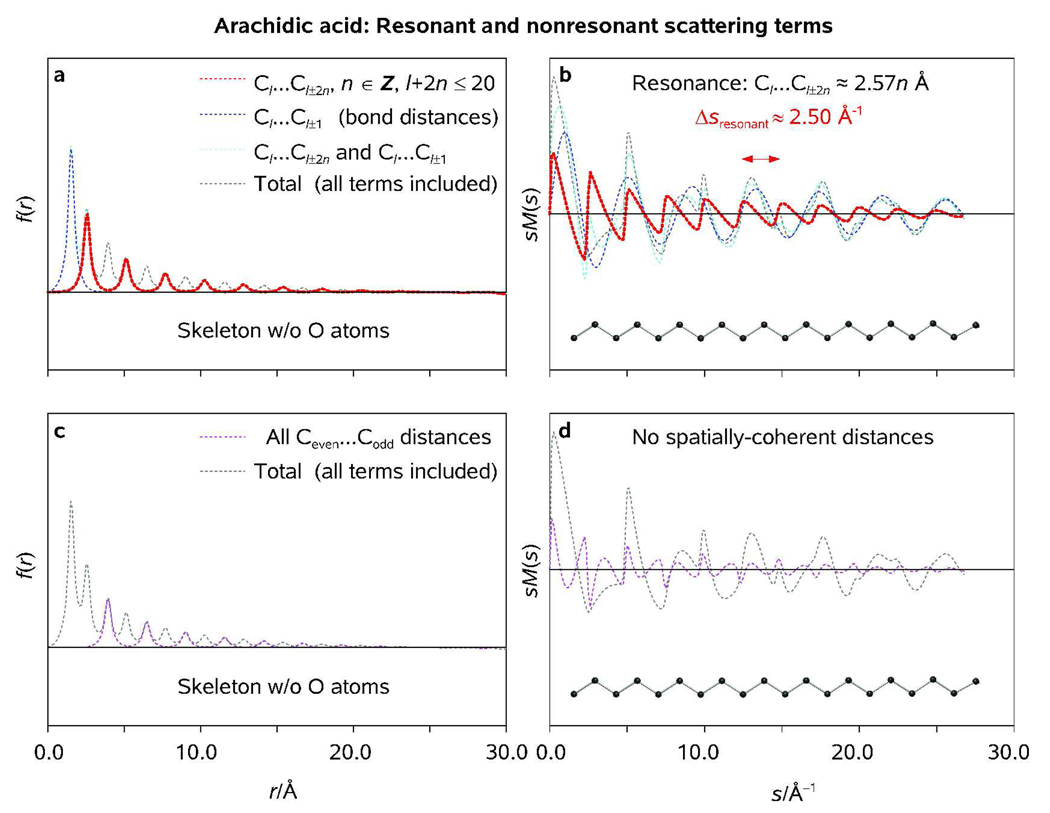
The 1D structural quasi-periodicity characteristic of the hydrocarbon chain of arachidic acid (Figure 1) gives rise to a number of resonant effects which are rarely observed in the gas phase. The nonbonded distances repeating throughout the molecule enable UED to measure the disruption, or residual degree, of the structural ordering in arachidic acid, which is similar to that induced by the long-range spatial periodicity of a crystal structure in the solid state. Indeed, the radial distribution function associated with the optimized molecular structure of arachidic acid, f(r), displays a series of distinct peaks which are almost equally separated on the r-scale. This unique structural pattern, which is robust and insensitive to random substitutions, becomes even more pronounced if the simulations are limited to the backbone scattering only (Figure 9 and Figure 10). As the length of the backbone chain taken into account increases, both the number of peaks and their relative amplitudes increase, and so does the intensity of some very sharp sM(s) features which closely resemble 1D profiles of Debye-Scherrer rings typically observed for polycrystalline materials in the powder-diffraction experiments. In order to identify the structural origin of these resonant features, we carried out a number of UED simulations using different subsets of the set of C-atoms, {Cl}, forming the heavy-atom backbone of the molecule.
Figure 9.
Radial distribution functions (<f(r, T)>, truncated at ~20 Å for clarity; c) and modified molecular scattering internsities (sM(s); b) as obtained at T = 300 K for indicated fragments of the backbone chain (a) of arachidic acid. Note that the sharp resonant features in sM(s) and <f(r)> become more pronounced as the chain length increases.
Figure 10.
Radial distribution functions (<f(r, T)>; a, c) and modified molecular scattering internsities (sM(s); b, d) as obtained at T = 298 K for resonant and nonresonant scattering terms within the backbone of arachidic acid (see Text) as obtained using GED software package developed at the University of Oslo (KCED25); see Ref. [18a] and Ref. [39] therein. RMS vibrational amplitudes were calculated from the Cartesian force field of the optimized structure of arachidic acid (symmetry group Cs) using a modified version of the program ASYM40.[20b]
The electron diffraction simulations based on the standard quasi-harmonic UED approach indicated that the complete set of internuclear distances associated with the backbone C-atoms of arachidic acid can be divided into resonant (Cl…Cl+2n, n ∈ Z) and nonresonant subsets (Figure 10). The resonant subset, which consists of internuclear distances rC…C = 2.57n Å, n = 1, 2, …, gives rise to well-defined periodic patterns in both f(r) and sM(s). Indeed, from the Bragg diffraction condition of a crystalline structure,
| (10) |
where Θ is the incident angle, d is the real-space periodicity, and λ is the scattered-radiation wavelength, it follows that for <dresonant> = 2.57 Å the reciprocal-space periodicity,
| (11) |
equals ~2.5 Å−1 (Figure 10). Notably, the zigzag scattering pattern of the coherently-distributed internuclear distances interferes with that of all the other internuclear distances within the chain, including the C-C bond distance of 1.53 Å. The constructive or destructive interference of the two patterns results in either amplification or quenching of resonant features in the reciprocal space (Figure 10).
All the C atoms tend to lie in a plane, or very nearly so, giving a flat zigzag molecular structure for crystalline fatty acids.[47] Despite the anticipated planarity of arachidic acid at T → 0 K, the internal rotations are expected to partially randomize its molecular structure at elevated temperatures, thus giving rise to an ensemble of fluxional pseudoconformers populating the potential energy landscape in accordance with the Boltzmann distribution. As seen in Figure 11 and Figure 12, neither the single-conformer model nor the local (ϕl ≈ 180°) quasi-harmonic pseudoconformer model based on the optimized (Cs) structure of the molecule can provide a physically-sound description of the conformational space of gaseous arachidic acid. In order to take the thermal conformational smearing into account, the (minimal) uncorrelated pseudoconformer model has to include realistic rotational probability density distributions, {P(ϕl, T)}, and a set of steric restraints which prohibit the unphysical molecular conformations (Figure 12).[48] It is to be noted that, because of the amphipathicity of arachidic acid, its molecules may form linear and cyclic polymers in the gas phase. Though the linear aggregation will have virtually no impact on the results reported here, the cyclic, especially intramolecular, aggregation will significantly affect both the persistence length (see discussion below) and the electron diffraction patterns of gaseous arachidic acid. However, given the length and the conformational flexibility of C19H39COOH in the gas phase, it is unlikely that the hydrophilic "head" of the molecule will coherently bind to the hydrophobic "tale" of the molecule, especially on the ultrafast time scale.
Figure 11.
Radial distribution functions (<f(r, T)>; a, c, e) and thermal probability density distribution functions (P(ϕ, T); b) as obtained for uncorrelated quasi-harmonic pseudoconformer models of arachidic acid at T = 300, 600, and 900 K using different steric tolerances (see Text); <f(r, T)> characteristic of the optimized structure of arachidic acid (symmetry group Cs) are plotted for comparison. Pertinent diffraction differences are shown as well (see Legend).
Figure 12.
Radial distribution functions (<f(r, T)>; a, c, e) and thermal probability density distribution functions (P(ϕ, T); b) as obtained for uncorrelated pseudoconformer models of arachidic acid at T = 300, 600, and 900 K using different steric tolerances (see Text); <f(r, T)> characteristic of the optimized structure of arachidic acid (symmetry group Cs) are plotted for comparison. Pertinent diffraction differences are shown as well (see Legend).
Variations of rotational and quasi-harmonic probability density functions with ϕl , along with the corresponding variations of the pseudoconformer populations in generated molecular ensembles (210 = 1024 molecules), are shown in Figure 13 at different temperatures. As seen in the results of Figure 13, the agreement between the pseudoconformer populations characteristic of the infinite (smooth lines) and numerically generated, finite (fuzzy lines) molecular ensembles, though satisfactory at T ≈ 300 K, starts to deteriorate at T ≈ 600 K. On the average, about 50% of the generated ensemble is rejected at T ≈ 900 K, which implies a considerable bias towards ϕl ≈ 180° for the 1024 molecular structures taken into account at the latter temperature. However, despite the limited applicability of the approach at highly-elevated temperatures, it may still be useful at "physical" and physiological temperatures which range between 300 and 400 K (we note that many biomolecules tend to denaturate, or even decompose, in the vicinity of T = 400 K). The calculated diffraction differences, <Δf(r, T)> = <f(r, T)> − <f(r, T0)>, where T and T0 are the final and the initial temperatures of the studied specimen, respectively, can be used to experimentally determine the degree of structural coherence associated with the (residual) spatial periodicity in a molecular ensemble at each particular point in time. Alternatively, the effective temperature of a gaseous molecular ensemble can be assessed and monitored in time during a temperature-jump experiment.
Figure 13.
Thermal probability density distribution functions, P(ϕ, T), and ensemble populations characteristic of the generated sets of 1024 sterically allowed pseudoconformers of arachidic acid as obtained for uncorrelated quasi-harmonic and regular pseudoconformer models at T = 300, 600, and 900 K using different steric tolerances (see Text).
Persistence Length: A Polymer Description
The key question pertinent to studies of flexible macromolecules is the extent to which the 1D structural quasi-periodicity characteristic of long-chain linear alkanes at low temperarures will be preserved at elevated (including physiological) temperatures. In order to answer this question, we assessed the ensemble-averaged persistence length of arachidic acid at a variety of temperatures using the classical approach of statistical thermodynamics. The persistence length, Lp, is a basic statistical property indicating the characteristic distance within a polymer for which directional coherence is lost. For an infinite chain of covalent bonds, it is defined as the projection of the average the end-to-end vector onto the axis defined by the first covalent bond.[49] For pieces of the chain that are shorter than the persistence length, the molecule behaves rather like a flexible elastic rod, while pieces of the chain that are longer than the persistence length have essentially no correlated motion. We shall compute the end-to-end persistence length (denoted Lp*) for a saturated hydrocarbon chain. Thus, Lp* will serve as a coherence length over which a quasi-periodic motif will be preserved over the ensemble of structures. The dependence of this coherence on chain length and temperature will also be addressed.
In the following, bold variables denote vectors, angled brackets denote ensemble averaging, and all lengths are given in units of C-C bond lengths (rC-C ≈ 1.533 Å). Suppose that r1, the first C-C bond in the chain, is defined to be in the direction of the z axis ez. Then Lp* is given by the average of the z-component of the end-to-end vector R:
| (12) |
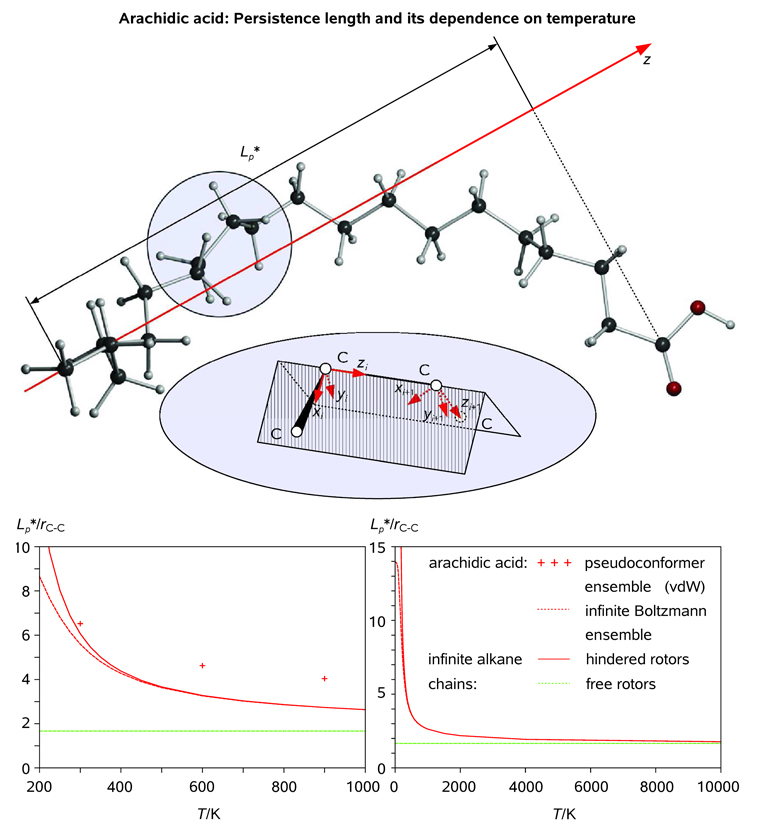
where <R> is the sum of the average individual bond vectors <ri>. As an illustration, Lp* is shown for the molecular conformation depicted in Figure 14. In the limit of the number of bonds in the chain, N approaching infinity, Lp* approaches the formal persistence length Lp.[49b] To calculate <ri>, we define a series of local Cartesian coordinates for every bond. The z axis is defined to be in the direction of the bond itself, while the x axis is perpendicular to the z axis in the triangular plane formed by the bond and the previous bond. The y axis is then uniquely defined according to the right-hand convention for Cartesian coordinates (see Figure 14).
Figure 14.
Persistence length of arachidic acid as obtained from statistical thermodynamics (sterically uncorrelated 1D {P(ϕl)}) and ensemble averaging (210 self-avoiding C19H39COOH chains generated at T = 300, 600, and 900 K). The end-to-end persistence length is the projection of the end-to-end vector in the direction of the first C-C bond. Each C-C bond is the z axis of its own local Cartesian coordinate frame (top). The end-to-end vector is the sum of the individual bond vectors, each of which can be calculated by multiplying its local coordinates by the appropriate power of the coordinate transformation matrix; definition of local coordinate systems for two adjacent C atoms of the backbone is illustrated in the inset (see Text). The end-to-end persistence length of arachidic acid is plotted along with those of infinite linear alkane chains consisting of free and hindered rotors (bottom; see Legend).
To distinguish between the bond and the coordinate system, we designate <ri>j to be the ith bond described in the jth coordinate system. For example, in its own local coordinates, each bond by definition points in the z direction: <ri>i = [0, 0, 1]. In order to define the x, y coordinates of the first bond, which has no prior bonds to establish a coordinate system, we fix the coordinate frame of the first bond to the global coordinate frame:
| (13) |
Thus, <ri> can be computed by writing <ri>i in the coordinates of <ri>1. This is accomplished recursively by the transformation matrix:
| (14) |
which represents any vector in the ith coordinate system in terms of its averaged coordinates in the i − 1th coordinate system. Here, ψ is the torsional angle of rotation of the ith bond relative to the ith positive x axis, and θ = 113.6° is the valence angle along a linear alkane chain. Averaging over the torsional angle yields:
| (14a) |
| (14b) |
where Z is the normalizing partition function and E(ψ) is determined from our quantum chemical calculations. Although <sin ψ> = 0 due to symmetry about the x axis, <cos ψ> is nonzero and depends on the temperature. Using the transformation matrix M, we obtain:
| (15) |
where the superscript and subscript on the right-hand-side vector denote, “transpose” and “ith” coordinate system, respectively. From right to left, we take the ith bond vector in its own coordinate system and transform it i − 1 times until it is in the coordinate system of the first bond, and finally extract the z component of the final vector to obtain the ensemble-averaged projection of the ith bond onto the first bond. Note that in Equation (15), Equations (14a,b) are substituted in M, resulting in ensemble averaging due to the distributive multiplication of M. Finally, we obtain the end-to-end persistence length by summing over all bonds:
| (16) |
which approaches Lp as N approaches infinity.
Using the calculated torsional potential (see Figure 8), we computed <cos ψ> as a function of temperature by Boltzmann weighting for an infinitely large molecular ensemble. The results, both for an infinitely long linear alkane chain and arachidic acid, are plotted in Figure 14. In addition, these results asymptote to the value of (1 + cos θ)−1 or 1.67 in the limit of infinite temperature, consistent with the persistence length of a freely rotating chain.[49b] We note that the effect of the carboxylic acid group at the end of the chain is ignored since we are considering long chains (e.g. N = 19 for arachidic acid). In the limit of zero temperature, the trans-configuration dominates. Thus, Lp* = R · ez, with ‖R‖ approaching the length of the extended chain. In this case, as N approaches infinity, Lp diverges. In addition, we can understand the smearing of the periodic peaks in the radial distribution function of arachidic acid at high temperatures as the shortening of the end-to-end persistence length and consequent loss of local periodicity and coherence. We note that Equation (16) does not take into account steric interactions which prohibit certain areas of the conformational space. The discrepancy between the sterically-uncorrelated Lp * as obtained from Equation (16) and the three values of Lp *(T), T = 300, 600, and 900 K, as obtained from explicit averaging of 210 self-avoiding C19H39COOH chains increases with temperature, as shown in Figure 14. This is caused by the increasing number of sterically frustrated pseudoconformers in the higher-temperature molecular ensembles (by discarding sterically frustrated pseudoconformers which do not satisfy self-avoidance criteria we mimic the bias towards more ordered structures implicit in the "realistic" persistence length which takes self-avoidance into account).
For a given experimental temperature T, the isolated, rotationally-perturbed molecular ensembles and the corresponding ensemble-averaged probability density distributions can also be pictured using ensemble-convergent MD simulations. Such simulations provide a state-of-the-art theoretical account of structural interconversions within the ensemble as they are based on realistic interatomic interaction potentials which determine the intramolecular motions at each particular point in time. With our newly-built supercomputer cluster, which currently features 32 dual quad-core Intel E5345 compute nodes, 12 GB RAM/node, ~20 TB of network-attached disk storage space, and a 1 GigE network interconnection mesh, we are now poised to explore such dynamics of complex energy landscapes. The structural interconversions which involve numerous degrees of rotational freedom, such as conformational changes in biological macromolecules, may be modeled, and the ensemble convergence achieved at increasingly longer time scales.[6a,8b]
One of the systems of interest to us is that of fatty acids immobilized on substrates.[50] MD simulations have been performed on such a system, in collaboration with Prof. T. Shoji and colleagues in Japan. The model used was that of a silicon substrate with the adsorbates made of C20H42 chains, covering a total combined length of 95 Å. The potentials for the chains, substrate and the interaction at the interface were obtained from ab initio calculations. The time step was 0.5 fs and the total number of steps was 200,000. The heat pulse was modeled based on the kinetic energy of the substrate atoms. The radial distribution function and the actual vibration motions of the atoms were obtained at different times. These calculations provided the structural-cell dimensions observed experimentally, and elucidated the coherent motion in the chain bonds and their time scales. Preliminary results show the increase in -CH2-CH2-CH2-distance near the silicon surface by 0.08 Å in about 5 ps. With the same approach, studies of the self-assembly were made to elucidate the formation of inter-chain stacking with void channels in between at zero pressure and in a confined “box”. It would be of interest to assess the spatial coherence of these types of systems in isolation, without substrate or solvation perturbations.
In continuation of research on order–disorder transitions in biomolecules, which was first triggered by our interest in helix–coil iterconversions in proteins[9] and DNA/RNA,[4a,6] we have also elucidated the resonant features arising from a DNA double helix. These features can be exploited as motifs in the forthcoming UED experiments. Preliminary UED simulations have already shown that (i) the unique resonant pattern of a double-helical DNA macromolecule is perhaps the most pronounced one when compared to other biological motifs, including α-helices and β-strands, and (ii) ensemble-convergent MD simulations are necessary in order to gain quantitative insights into details of unfolding. In this regard, atomic-resolution MD trajectories are expected to provide not only the actual time constants for the change, but also the ensemble-averaged dynamics of the intermediate structures involved. A comprehensive account of this work will be the subject of another publication.
Helix-to-Coil Transitions
Elsewhere,[9] we considered this fundamental biomolecular process, and here we only highlight the relevance to the general picture of structural resonance developed in this paper. It is known that transformations, such as helix–coil transitions in the protein thymosin-β9 (Tβ9, PDB ID 1HJ0),[9] can be triggered by a rapid temperature jump. A fundamental question is whether or not these transitions are possible in the isolated state of the protein (of special interest to us is the study of biological structural changes free of the obscuring effects of solvent). UED represents a direct experimental approach for addressing this question because its experimental methodology suffices to observe the transitions which in solution occur on the nanosecond time scale.[27] However, for a protein, the problem is nontrivial as the detailed information regarding individual bond distances, valence angles, and conformations may not be readily available from the electron-scattering data. For example, in order to investigate the unfolding of a protein upon a temperature jump, we must take into account all possible final conformations. This complexity may suggest the masking of significant change in diffraction.
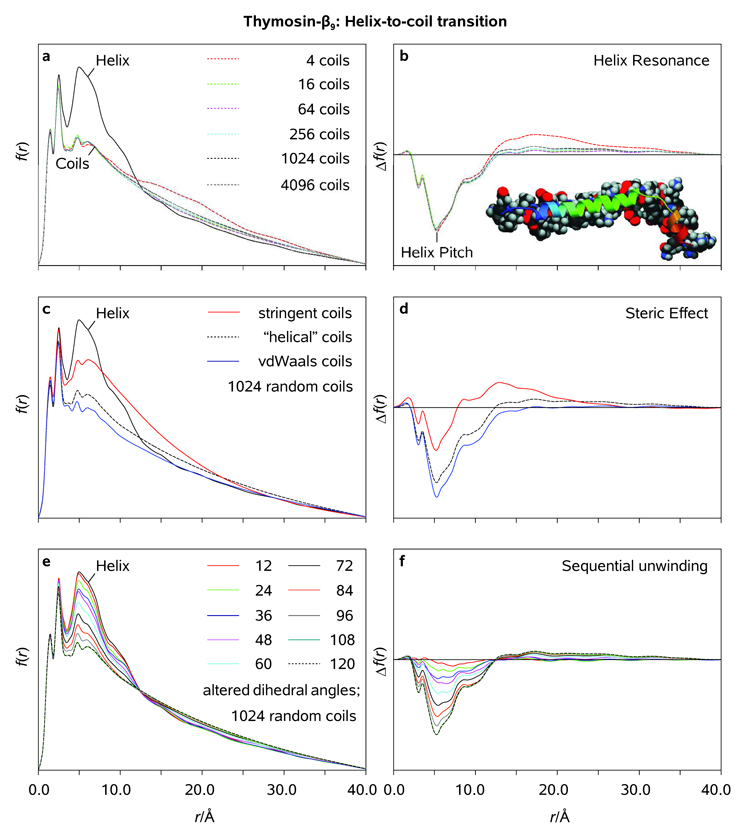
In a recent theoretical UED study of the helix–coil structural phase transition in Tβ9, we (i) generated large ensembles of randomized molecular structures ("coils") in order to ascertain the size of the ensemble required for UED simulations to converge, (ii) investigated the impact of the steric overlap tolerance imposed on the generated coil structures on the reliability of our simulations, and (iii) calculated the diffraction-differences characteristic of the helix–coil transition in Tβ9.[9] Because both size and conformational flexibility of the macromolecule precluded any use of the probability-density modeling in the case of Tβ9,[51] a different methodology was needed in order to obtain structural changes and evolutions. The approach we developed to rapidly generate large ensembles of nonoverlapping random coiled structures of Tβ9 on a standard CPU,[52] after the modifications which allowed us to take P(ϕ) into account, was further used in the theoretical UED studies of conformational interconversions in molecular ensembles of arachidic acid (see above). Because reducing the ensemble size from 4096 random coils (fractional error per radial distribution peak below 0.01) to 1024 random coils was found to have very little impact on the accuracy of UED simulations (Figure 15), we used the latter ensemble size in the studies reported here.
Figure 15.
Radial distribution functions (<f(r)>; a, c, e), and diffraction-differences with respect to the reference α-helical structure of thymosin-β9 (<Δf(r)>; b, d, f) as obtained using different ensemble sizes, steric tolerances, and degrees of backbone randomization (see Text).
The electron diffraction simulations discussed below were carried out as follows. First, the (simplified) pseudoconformer model assumed no coupling between the internal rotations in Tβ9; 1024 (partially)randomized, nonlinear pseudoconformers of Tβ9 were generated using the above-mentioned approach;[52] The model was based on the experimental structure of Tβ9 as obtained from 2D 1H NMR[53] measurements (no changes in the structure parameters other than the torsional angles determining the backbone conformation were allowed); The set of torsional angles, {ϕl}, of a given pseudoconformer was randomly readjusted if it did not satisfy one of the following steric restraints: (i) rij > 2.6 Å ("stringent" restraint); (ii) rij > rij(native) as obtained from the NMR structure of Tβ9 ("helical" restraint), or (iii) rij > 3.1 Å (van der Waals-type restraint).[9] Second, radial distribution functions <f(r, T)> were calculated using UEDANA[18a] for the above-mentioned models at T = 300 K with an artificial damping factor of 0.02 Å2 and further compared with those of equally large ensembles of native (α-helical) structures of Tβ9;[53] RMS amplitudes of thermal vibrations were estimated using the empirical equations at T = 300 K.
At thermal equilibrium, there is no physical reason to impose a threshold more stringent than van der Waals on the pseudoconformer structures present in the ensemble. Thus, the features in Figure 15 demonstrate that no matter what threshold nature imposes, there is a clear distinction between α-helical and random-coil structures of Tβ9. As shown in Figure 15, helix–coil transitions in Tβ9 predominantly manifest themselves through a major redistribution of the density of internuclear distances in the inner area of <f(r)>. Most significantly is that a group of repeating nonbonded distances associated with the α-helical structure of Tβ9 causes a pronounced resonant ordering in <f(r)>, whereas incoherently distributed nonbonded distances of a random-coil ensemble render its averaged radial distribution function rather featureless. Indeed, the average distance measured on a helix backbone for an atom to its mirror image along the α-helix axis ("pitch") is about 5.5 Å. Accordingly, the radial distribution function of the helical ensemble depicted in Figure 15 shows a well-defined peak at ~5.5 Å, with some periodicity corresponding to ~5.5 Å. This resonant pattern in <f(r)> disappears as the helix unwinds.
As shown in Figure 15, the helicity loss associated with the helix-to-coil transitions appears to be quasi-linear in n, the number of arbitrarily-altered dihedral angles in the backbone chain of Tβ9, within the framework of our model. However, the above quasi-linearity is disrupted as n approaches its limiting values of 0 and 120 on the right and left ends of the 123-atom backbone of Tβ9, respectively. This is due to the terminal residues of Tβ9 which do not possess α-helical structure.[53] It is also noteworthy that a local disruption of the quasi-linearity, which occurs at n ≈ 36, may be attributed to a quasi-random loop region which separates the two α-helices of Tβ9.[53] Because the helical resonance in <f(r)> is unaffected by the globular conformation of Tβ9,[9] the spatial coherence associated with the secondary structure in the protein provides a robust experimental criterion with which to evaluate the residual helicity in a molecular ensemble at each particular point in time. The helicity changes shown in Figure 15 reflect the direct temporal evolution of the ensemble as the protein undergoes the helix-to-coil transition. Thus, the diffraction-difference curves <Δf(r)> between (partially)randomized and native molecular ensembles represent anticipated changes with t, but the actual time constants for the change will be the subject of another contribution.
5. Conclusion
In the present study, our aim was to elucidate the role of coherence and conformations in biological structure determination by ultrafast electron diffraction (UED). At the heart of the problem are conformational interconversions which have been addressed for a series of potential energy hypersurfaces, from relatively small-sized (trans-stilbene and n-butane) to relatively complex ones (arachidic acid). Theoretical models which sample a limited set of pseudoconformers and/or utilize the canonical Boltzmann averaging have long been applied in many areas of research, such as atomic and molecular clusters, condensed matter, and biomolecules,[3,54,55] with the aim of understanding the energy landscapes involved in the transformations. Our focus, however, is on experimental observables, in this case—UED.
Specifically, it is shown here that isolated order–disorder transitions in (bio)polymers can be mapped out with ultrafast electron diffraction. The spatial and temporal resolutions and sensitivity of UED experimets suffice to detect the corresponding structural change using selective motifs of spatial coherence. As importantly, a theoretical model which is compatible with the conformational energy landscape is required to obtain meaningful interpretations of the experimental data. For small and medium sized molecules, if the shape of the internal rotation potential is quasi-harmonic in the vicinity of the minima as with n-butane, then the distinct-conformer model is sufficient to fit the diffraction. However, if the potential forms a flat basin around the equilibrium structure as with trans-stilbene, an ensemble (pseudoconformer) treatment should be employed.
For (bio)molecules with numerous energy minima, because the size of the conformational space scales exponentially with the number of degrees of rotational freedom, the ensemble-convergent pseudoconformer modeling should be used. For the latter case, the one dimensional radial distribution function <f(r)> was shown to converge to its infinite-sample value using only a few thousand conformations chosen randomly from the ensemble. In addition to the distribution of interatomic distances, calculation of the persistence length provides a distance scale within which parts of the molecule are correlated in their orientation and conformation, and as such it can be used as an experimental indicator of residual coherence.
Though insensitive to certain structural details, such as small bond-distance and valence-angle variations across the ensemble, the coarse-graining theoretical model should account for the ensemble-wide structural resonance. The temporal evolution of the residual degree of structural ordering can then be assessed by monitoring the erosion of resonant electron-diffraction features characteristic of the structural motifs which undergo a disordering transition upon a laser-induced temperature jump. For example, the structural quasi-periodicity characteristic of arachidic acid and thymosin-β9 was shown to induce unique resonance patterns in the ensemble-averaged radial distribution functions and modified molecular scattering intensities, and the resonant scattering terms giving rise to such patterns were uniquely identified. Such motif changes are most dramatic in the case of DNA double helices. It is of interest to note that in the original structure determination[56] of DNA fibers the double helical structure was the key motif, and later the high-resolution crystal structure confirmed the atomic positions.[57] With the newly constructed UED-4 apparatus we hope to explore such directions of research.
Acknowledgments
We are grateful to the National Science Foundation and National Institutes of Health (NIH grant # RO1- GM081520-01) for funding of this research and we wish to express our gratitude to Prof. Jack Roberts for inspiring discussions involving conformational change and to Prof. David Wales for a number of helpful comments. MML acknowledges financial support from the Krell Institute and the US Department of Energy (DoE grant # DE-FG02-97ER25308) for a graduate fellowship at Caltech.
References
- 1.For a discussion, see: Zewail AH. In: Physical Biology: From Atoms to Medicine. Zewail AH, editor. London: Imperial College Press; 2008. pp. 23–49.
- 2.Kawashima Y, Usami T, Ohashi N, Suenram RD, Hougen JT, Hirota E. Acc. Chem. Res. 2006;39:216–220. doi: 10.1021/ar040310c. [DOI] [PubMed] [Google Scholar]
- 3.Wales DJ. Energy Landscapes: Applications to Clusters, Biomolecules and Glasses. Cambridge: Cambridge University Press; 2003. [Google Scholar]
- 4.See, for example: Ma H, Wan C, Wu A, Zewail AH. Proc. Natl. Acad. Sci. U. S.A. 2007;104:712–716. doi: 10.1073/pnas.0610028104. Ma H, Proctor DJ, Kierzek E, Kierzek R, Bevilacqua PC, Gruebele M. J. Am. Chem. Soc. 2006;128:1523–1530. doi: 10.1021/ja0553856.
- 5.a) Enderlein J. Chem. Phys. Chem. 2007;8:1607–1609. doi: 10.1002/cphc.200700247. [DOI] [PubMed] [Google Scholar]; b) Miller TF, III, Vanden-Eijnden E, Chandler D. Proc. Natl. Acad. Sci. U.S.A. 2007;104:14559–14564. doi: 10.1073/pnas.0705830104. [DOI] [PMC free article] [PubMed] [Google Scholar]
- 6.a) Lin MM, Meinhold L, Shorokhov D, Zewail AH. Phys. Chem. Chem. Phys. 2008;10:4227–4239. doi: 10.1039/b804675c. [DOI] [PMC free article] [PubMed] [Google Scholar]; b) Crow JM. Chem. Biol. 2008;3:B50. [Google Scholar]
- 7.Zewail AH. In: Les Prix Nobel: The Nobel Prizes 1999. Frängsmyr T, editor. Stockholm: Almqvist&Wiksell; 2000. pp. 110–203. [Google Scholar]
- 8.For reviews, see: Thomas JM. In: Physical Biology: From Atoms to Medicine. Zewail AH, editor. London: Imperial College Press; 2008. pp. 51–114. Shorokhov D, Zewail AH. Phys. Chem. Chem. Phys. 2008;10:2879–2893. doi: 10.1039/b801626g. Zewail AH. Annu. Rev. Phys. Chem. 2006;57:65–103. doi: 10.1146/annurev.physchem.57.032905.104748. See also: Ref. [1] and references therein.
- 9.Lin MM, Shorokhov D, Zewail AH. Chem. Phys. Lett. 2006;420:1–7. [Google Scholar]
- 10.See, for example: Srinivasan R, Lobastov VA, Ruan C-Y, Zewail AH. Helv. Chim. Acta. 2003;86:1763–1838. Ihee H, Lobastov VA, Gomez UM, Goodson BM, Srinivasan R, Ruan C-Y, Zewail AH. Science. 2001;291:458–462. doi: 10.1126/science.291.5503.458.
- 11.a) Zewail AH. Faraday Discuss. Chem. Soc. 1991;91:207–237. [Google Scholar]; b) Williamson JC, Zewail AH. Proc. Natl. Acad. Sci. U.S.A. 1991;88:5021–5025. doi: 10.1073/pnas.88.11.5021. [DOI] [PMC free article] [PubMed] [Google Scholar]
- 12.See Ref. [8b,c] and references therein.
- 13.Srinivasan R, Feenstra JS, Park ST, Xu S, Zewail AH. Science. 2005;307:558–563. doi: 10.1126/science.1107291. [DOI] [PubMed] [Google Scholar]
- 14.Xu SJ, Park ST, Feenstra JS, Srinivasan R, Zewail AH. J. Phys. Chem. A. 2004;108:6650–6655. [Google Scholar]
- 15.a) Park ST, Feenstra JS, Zewail AH. J. Chem. Phys. 2006;124:174707. doi: 10.1063/1.2194017. [DOI] [PubMed] [Google Scholar]; b) He Y, Gahlmann A, Feenstra JS, Park ST, Zewail AH. Chem.-Asian J. 2006;1–2:56–63. doi: 10.1002/asia.200600107. [DOI] [PubMed] [Google Scholar]
- 16.Park ST, Gahlmann A, He Y, Feenstra JS, Zewail AH. Angew. Chem., Int. Ed. 2008;47:9496–9499. doi: 10.1002/anie.200804152. [DOI] [PubMed] [Google Scholar]
- 17.See, for example: Kuchitsu K, editor. Structure Data of Free Polyatomic Molecules. Berlin-Heidelberg: Springer Verlag; 1998.
- 18.See, for example: Shorokhov D, Park ST, Zewail AH. Chem. Phys. Chem. 2005;6:2228–2250. doi: 10.1002/cphc.200500330. Hargittai I, Hargittai M, editors. Stereochemical Applications of Gas-Phase Electron Diffraction, Part. A: The Electron Diffraction Technique. New York: VCH Publishers Inc.; 1988. and references therein.
- 19.Ross AW, Fink M, Hilderbrandt RL. In: International Tables for Crystallography, Vol. C, Mathematical, Physicaland Chemical Tables. Wilson AJC, editor. Dordrecht: Kluwer; 1992. [Google Scholar]
- 20.See, for example: Sipachev VA. J. Mol. Struct. 2004;693:235–240. Hedberg L, Mills IM. J. Mol. Spectrosc. 1993;160:117–142. doi: 10.1006/jmsp.2000.8168. Novikov VP, Sipachev VA, Kulikova EI, Vilkov LV. J. Mol. Struct. 1993;301:29–36. Sipachev VA. J. Mol. Struct. 1985;121:143–151.
- 21.Mastryukov VS, Dorofeeva OV. J. Struct. Chem. 1979;20:504–508. [Google Scholar]
- 22.a) Mastryukov VS, Cyvin SJ. J. Mol. Struct. 1975;29:16–25. [Google Scholar]; b) Osina EL, Mastryukov VS, Vilkov LV, Cyvin SJ. J. Struct. Chem. 1975;16:977–978. [Google Scholar]; c) Cyvin SJ, Mastryukov VS. J. Mol. Struct. 1976;30:333–337. [Google Scholar]; d) Mastryukov VS, Osina EL. J. Struct. Chem. 1976;17:147–148. [Google Scholar]; e) Mastryukov VS. J. Struct. Chem. 1976;17:69–73. [Google Scholar]; f) Mastryukov VS, Osina EL, Vilkov LV, Cyvin SJ. J. Struct. Chem. 1976;17:64–68. [Google Scholar]
- 23.Morino Y, Hirota E. J. Chem. Phys. 1958;28:185–197. [Google Scholar]
- 24.For recent applications from this and other laboratories, see, for example: Dorofeeva OV, Vishnevskiy YV, Vogt N, Vogt J, Khristenko LV, Krasnoshchekov SV, Shishkov IF, Hargittai I, Vilkov LV. Struct. Chem. 2007;18:739–753. b) Ref. [15b].
- 25.See, for example: Levine IN. Quantum Chemistry. Englewood Cliffs: Prentice Hall; 1999.
- 26.See, for example: Ruan C-Y, Lobastov VA, Srinivasan R, Goodson BM, Ihee H, Zewail AH. Proc. Natl. Acad. Sci. U.S.A. 2001;98:7117–7122. doi: 10.1073/pnas.131192898. Geiser JD, Weber PM. J. Chem. Phys. 1998;108:8004–8011. See also: Ref. [18a].
- 27.Finkelstein AV, Ptitsyn OB. Protein Physics: A Course of Lectures. New York: Academic Press; 2002. [Google Scholar]
- 28.a) Seidel MT, Chen S, Zewail AH. J. Phys. Chem. C. 2007;111:4920–4938. [Google Scholar]; b) Chen S, Seidel MT, Zewail AH. Proc. Natl. Acad. Sci. U.S.A. 2005;102:8854–8859. doi: 10.1073/pnas.0504022102. [DOI] [PMC free article] [PubMed] [Google Scholar]
- 29.a) Bonham RA, Bartell LS. J. Am. Chem. Soc. 1959;81:3491–3496. [Google Scholar]; b) Bartell LS, Kohl DA. J. Chem. Phys. 1963;39:3097–3105. [Google Scholar]; c) Bradford WF, Fitzwater S, Bartell LS. J. Mol. Struct. 1977;38:185–194. [Google Scholar]; d) Heenan RK, Bartell LS. J. Chem. Phys. 1983;78:1265–1269. [Google Scholar]; e) Heenan RK, Bartell LS. J. Chem. Phys. 1983;78:1270–1274. [Google Scholar]; f) Bartell LS, Barshad YZ. J . Phys. Chem. 1987;91:2890–2894. [Google Scholar]
- 30. See, for example: Ref. [29b].
- 31. See, for example: Vansteenkiste P, van Speybroeck V, Marin GB, Waroquier M. J. Phys. Chem. A. 2003;107:3139–3145.
- 32.Wang F. J. Phys. Chem. A. 2003;107:10199–10207. doi: 10.1021/jp0363904. [DOI] [PubMed] [Google Scholar]
- 33.Frisch MJ, Trucks GW, Schlegel HB, Scuseria GE, Robb MA, Cheeseman JR, Zakrzewski VG, Montgomery JA, Stratmann RE, Burant JC, Dapprich S, Millam JM, Daniels AD, Kudin KN, Strain MC, Farkas O, Tomasi J, Barone V, Cossi M, Cammi R, Mennucci B, Pomelli C, Adamo C, Clifford S, Ochterski J, Petersson GA, Ayala PY, Cui Q, Morokuma K, Malick DK, Rabuck AD, Raghavachari K, Foresman JB, Cioslowski J, Ortiz JV, Stefanov BB, Liu G, Liashenko A, Piskorz P, Komaromi I, Gomperts R, Martin RL, Fox DJ, Keith T, Al-Laham MA, Peng CY, Nanayakkara A, Gonzalez C, Challacombe M, Gill PMW, Johnson BG, Chen W, Wong MW, Andres JL, Head-Gordon M, Replogle ES, Pople JA. GAUSSIAN 98, Revision A.7. Pittsburgh, PA USA: Gaussian, Inc.; 1998. [Google Scholar]
- 34.Bondi A. J. Phys. Chem. 1964;68:441–451. [Google Scholar]
- 35.Piatek A, Chapuis C, Jurczak J. Helv. Chim. Acta. 2002;85:1973–1987. [Google Scholar]
- 36. Weinhold F. Nature. 2001;411:539–541. doi: 10.1038/35079225. Pophristic V, Goodman L. Nature. 2001;411:565–568. doi: 10.1038/35079036. For criticism, see: Bickelhaupt FM, Baerends EJ. Angew. Chem. Int. Ed. 2003;42:4183–4188. doi: 10.1002/anie.200350947. Weinhold F. Angew. Chem. Int. Ed. 2003;42:4188–4194.
- 37.Mo Y, Gao J. Acc. Chem. Res. 2007;40:113–119. doi: 10.1021/ar068073w. [DOI] [PubMed] [Google Scholar]
- 38.Compton DAC, Montero S, Murphy WF. J. Phys. Chem. 1980;84:3587–3591. [Google Scholar]
- 39.See, for example: Wolfe S. Acc. Chem. Res. 1972;5:102–111.
- 40.See, for example: Quenneville J, Martinez TJ. J. Phys. Chem. A. 2003;107:829–837. and references therein; Traetteberg M, Frantsen EB, Mijlhoff FC, Hoekstra A. J. Mol. Struct. 1975;26:57–68.
- 41.Grumadas AY. J. Struct. Chem. 1990;31:19–24. [Google Scholar]
- 42.Tsuji T, Takashima H, Takeuchi H, Egawa T, Konaka S. J. Phys. Chem. A. 2001;105:9347–9353. [Google Scholar]
- 43.Chiang W-Y, Laane J. J. Chem. Phys. 1994;100:8755–8767. [Google Scholar]
- 44.See, for example: Almenningen A, Bastiansen O, Munthe-Kaas T. Acta Chem. Scand. 1956;10:261–264. Morino Y. Acta Crystallogr. 1960;13:1107. Cyvin SJ. Molecular Vibrations and Mean Square Amplitudes. Amsterdam: Universitetsforlaget i Oslo, Elsevier; 1968.
- 45.Tang J, Yang D-S, Zewail AH. J. Phys. Chem. C. 2007;111:8957–8970. [Google Scholar]
- 46.a) Ref. [28]; Chen S, Seidel MT, Zewail AH. Angew. Chem., Int. Ed. 2006;45:5154–5158. doi: 10.1002/anie.200601778.
- 47.Kitaigorodskii AI. Organic Chemical Crystallography. New York: Consultants Bureau; 1961. [Google Scholar]
- 48.We consider a conformation to be "unphysical" if it violates the self-avoidance conditions formulated above.
- 49.a) McNaught AD, Wilkinson A. IUPAC Compendium of Chemical Terminology. Cambridge: Royal Society of Chemistry; 1997. [Google Scholar]; b) Yamakawa H. Theory of Polymer Solutions. New York: Harper and Row; 1971. [Google Scholar]
- 50.See, for example: Refs. [45,46]
- 51.A molecule of Tβ9 consists of 667 atoms, see Refs. [9,53].
- 52.For a detailed description of the approach, see Section 3 in Ref. [9].
- 53.Stoll R, Voelter W, Holak TA. Biopolymers. 1997;41:623–634. doi: 10.1002/(SICI)1097-0282(199705)41:6<623::AID-BIP3>3.0.CO;2-S. [DOI] [PubMed] [Google Scholar]
- 54.Wales DJ, Bogdan TV. J. Phys. Chem. B. 2006;110:20765–20776. doi: 10.1021/jp0680544. [DOI] [PubMed] [Google Scholar]
- 55.Strodel B, Wales DJ. Chem. Phys. Lett. 2008;466:105–115. [Google Scholar]
- 56.Watson JD, Crick FHC. Nature. 1953;171:737–738. doi: 10.1038/171737a0. [DOI] [PubMed] [Google Scholar]
- 57.a) Wang AH-J, Quigley GJ, Kolpak FJ, Crawford JL, van Boom JH, van der Marel G, Rich A. Nature. 1979;282:680–686. doi: 10.1038/282680a0. [DOI] [PubMed] [Google Scholar]; b) Wing R, Drew H, Takano T, Broka C, Tanaka S, Itakura K, Dickerson RE. Nature. 1980;287:755–758. doi: 10.1038/287755a0. [DOI] [PubMed] [Google Scholar]


