

Abstract
Purpose
Cancer stem cells (CSC) have been isolated from human tumors, including glioblastoma multiforme (GBM). The aims of this study were the immunobiological characterization of GBM CSCs and the assessment of whether these cells represent suitable targets for immunotherapy.
Experimental Design
GBM CSC lines and their fetal bovine serum (FBS)–cultured non-CSC pair lines were generated and examined by flow cytometry for expression of known tumor antigens, MHC-I and MHC-II molecules, antigen-processing machinery components, and NKG2D ligands. In addition, immunogenicity and immunosuppression of such cell lines for autologous or allogeneic T lymphocytes were tested by cytokine secretion (ELISPOT) or proliferation (carboxyfluorescein diacetate succinimidyl ester) assays, respectively.
Results
Both GBM CSC and FBS lines were weakly positive and negative for MHC-I, MHC-II, and NKG2D ligand molecules, respectively. Antigen-processing machinery molecules were also defective in both cell types. Upregulation of most molecules was induced by IFNs or 5-Aza deoxycytidine, although more efficiently in FBS than in CSCs. Patient T-cell responses, mediated by both TH1 and the TH2 subsets, against autologous CSC could be induced in vitro. In addition, CSC but not their paired FBS tumor lines inhibited T-cell proliferation of healthy donors. Notably, a differential gene signature that was confirmed at the protein levels for some immunologic-related molecules was also found between CSC and FBS lines.
Conclusions
These results indicate lower immunogenicity and higher suppressive activity of GBM CSC compared with FBS lines. The immunogenicity, however, could be rescued by immune modulation leading to anti-GBM T cell–mediated immune response.
Glioblastoma multiforme (GBM) is the most aggressive malignant astrocytic glioma due to the high degree of cellularity and the dissemination of tumor cells within the brain (1). The median survival of GBM patients is ∼14 months despite aggressive surgery, radiation, and chemotherapy (2). Thus, new treatments are necessary to improve the survival of these patients.
Among new potential treatments, immunotherapy has been proposed as a promising one as it can induce tumor cell killing by T lymphocytes recognizing tumor-associated antigens (TAA) of GBM cells that remain after surgery and that are resistant to standard therapies.
In fact, human GBMs express a variety of TAAs frequently detected in other tumors, such as MAGE, GP100, TRP-2, survivin, and SOX-2 (3–6), or whose expression is restricted to GBM, such as the interleukin (IL)-13 receptor α2 (IL-13Rα2; ref. 7). Several animal models suggested that GBM may be amenable to immune therapy (8) and the identification of both humoral and cellular immune responses in brain tumor patients triggered efforts to further enhance them (9–11). In addition, CTLs were detected in patients treated with dendritic cell vaccines (12). Therefore, immunotherapeutic strategies need to be designed to target the cell subpopulation responsible for GBM resistance to immune attack and endowed with tumor renewal and progression properties.
Cells with “stem cell” properties have been isolated from different malignancies (13–15) including GBM (16–19). A panel of GBM lines has been recently isolated in our laboratories from surgical specimens of patients either by exposure of tumor cells to specific mitogens (epidermal growth factor and fibroblast growth factor-2; ref. 17)7 or to fetal bovine serum (FBS). The mitogen-dependent GBM cell lines hold essential characteristics of cancer stem cells (CSC), as they can be grown in vitro, with the form of neurospheres(17–20). Upon differentiation, these cells appear multipotent and can generate new tumors following transplantation in immunodeficient mice (21, 22), and therefore, they are considered as GBM CSCs.
Translational Relevance.
Glioblastoma multiforme (GBM) is one of the most malignant brain tumors and its infiltrative tissue pattern leads to the inability to achieve a complete surgical resection of the tumor. Recently, cancer stem cells (CSC) have been isolated from surgical specimens of human GBMs. These peculiar stem cells are believed to be responsible for tumor initiation, progression, and resistance to therapeutic agents. Thus, the identification of CSC-targeted therapeutic interventions, such as immunotherapy, is desirable to achieve complete eradication of tumors. Our study represents a detailed immunobiological characterization of a large panel of GBM CSCs compared with their FBS tumor cell pairs. We have assessed the MHC, tumor antigen, antigen presentation, and suppressive molecule profile of both types of cells, which display a weak immunogenicity and, limited to CSC, even an immune suppressive activity. Thus, this study provides several implications for immunotherapy that will help to identify GBM patients whose CSC can be targeted by immunotherapy.
We have exploited the availability of human GBM CSC lines and of their paired autologous tumor cells grown in the presence of FBS (FBS tumor cells) to characterize their immune profile with special emphasis on the analysis of their ability to elicit T cell–mediated responses against GBM.
The results of this study show lack or low expression of MHC, NKG2D ligands (NKG2DL), and antigen-processing machinery (APM) molecules in both GBM CSC and FBS tumor lines. However, in vitro IFN (both α and γ) treatment of CSCs could partially restore their immunogenicity because we could isolate both CD4+ and CD8+ tumor–specific T cells from four GBM patients by in vitro stimulation of peripheral blood mononuclear cells (PBMC) with autologous CSCs. Moreover, a differential transcriptional pattern distinguishing CSCs from FBS tumor cells was observed corroborating our immune findings. This report is the first characterization of autologous T cell–mediated responses against GBM CSCs and its results have several implications for the immunotherapy of GBM patients.
Materials and Methods
Tissues and cells
Tumor lesions and PBMCs were obtained from patients with a diagnosis of primary or recurrent GBM admitted for clinical treatment to the San Raffaele Hospital, Milan, Italy. The study has been approved by the Institutional Review Board and the Ethics Committee of the San Raffaele Hospital, and an informed consent was obtained from participating subjects.
The MHC class I and class II typing of the PBMCs and tumor lines used in this study was done by single-stranded oligonucleotide probe-PCR typing (23).
CSCs were in vitro isolated in the presence of stem cell–specific medium and were propagated in the form of neurospheres as described in Galli et al. (17). Briefly, primary cells were plated in 25-cm2 tissue culture flasks at clonal density (2,500-5,000 cells/cm2) in DMEM/F12 medium containing 20 ng/mL of both epidermal growth factor and fibroblast growth factor-2 (FGF; Peprotech). When enough tumor tissue was available (patient #071011, 080125, 080201, 080325, and 080418), part of the primary cells obtained after dissociation was plated in the presence of RPMI 1640 supplemented with 10% (FBS; Biowittaker, Lonza), hereafter denominated FBS tumor cells, and these established cell lines were used in parallel with CSCs for all the experiments.
U87 glioma cells (ATCC-LGC, LGC Standards) were cultured under the same culture conditions.
CSC tumorigenicity was determined by injecting either GBM-derived CSCs or FBS tumor cells intracranially into adult nu/nu mice (17). Two microliters of a 1 × 10⁸ cells/mL cell suspension in PBS were delivered into the right striatum (0.2 μL/min) by stereotactic injection through a Hamilton syringe. The coordinates used were as follows: AV = 0, ML = +2.5 mm, and DV = −3.5 mm. Animals were sacrificed between 6 to 10 wk following intracranial transplantation, depending on the CSC line under analysis. The brain-derived tissues were processed for histologic and immunohistochemical examination as previously described (17).
Others cell lines used in this study were the 1869 B cells immortalized with EBV (1869 EBV-B; ref. 24), the melanoma lines 501 mel (kindly provided by Dr. P.F. Robbins National Cancer Institute, NIH, Bethesda, MD) and 1061 mel (established in our laboratories), and the colorectal cancer line SW480 (American Type Culture Collection); these cell lines were cultured in vitro with RPMI 1640 plus 10% FBS.
Flow cytometry analysis
The expression of class I and class II HLA by CSC and FBS tumor cell lines was determined by flow cytometry and fluorescence-activated cell sorting (FACS CANTO HTS, Becton Dickinson) analysis using the monoclonal antibodies (mAb) W6/32 and L243 (BD Pharmingen), respectively. The expression of APM and MICA, MICB, and ULBPs molecules by these cell lines was determined by using the previously described purified antibodies provided by one of us (S.F.) or by Amgen, respectively (25–27). Moreover, the following mAbs have been used for CSC immunophenotyping: anti-Myc 3C118 (Santa Cruz Biothechnology, Inc.), anti-CD133 293C3 (Milteny Biotech), anti-Nanog M55-312 (Becton Dickinson), anti-Nestin 3k1 (Novus Biologicals), anti-S100A4 1F12-1G7 and anti-S100A6 6D1 (Abnova), and anti-SOX2 245610 (R&D Systems, Inc.); anti–SALL4 EE-30 (Santa Cruz Biothechnology, Inc.); HMB45 sc-59305 (Santa Cruz Biothechnology, Inc.) and anti–CTLA-4 BN13 (Becton Dickinson); anti–PD-1 MIH4 (Becton Dickinson); anti–PD-L1 MIH1 (Becton Dickinson); anti–PD-L2 MIH18 (Becton Dickinson); anti–B7-1 L307.4 (Becton Dickinson); anti–B7-2 2331 (FUN-1) mAb (Becton Dickinson); anti-Survivin 8E2 (Thermo Scientific), anti–NY-ESO-1 E978 (Zymed Laboratories, San Francisco, CA, USA), anti–IL-13Rα2 B-D13 (Santa Cruz Biothechnology, Inc.), anti-MAGE 57B, and 6C1 kindly provided by Dr. G. Spagnoli (Institute of Surgical Research and Hospital Management, Department of Biomedicine, University Hospital of Basel, Basel, Switzerland); and anti–COA-1 polyclonal antibody (ProteinExpert). The phycoerythrin-conjugated goat anti-mouse IgGs (DAKO Corp.) were used for fluorochrome staining of the mAbs used.
To determine whether the epigenetic hypermethylation of promoters of genes encoding MHC, APM, and NKG2DLs occurred in GBM CSCs or FBS tumor cells, the demethylating agent 5-Aza-2′-deoxycytidine (5 μmol/L) was added to culture medium of these cells for 4 d, and immunofluorescence and cytofluorimetric analysis was then done as described above.
The phenotype characterization of T-cell lines was carried out by multicolor immunofluorescence and cytofluorimetric analysis with fluorochrome-conjugated anti-CD3, anti-CD4, anti-CD8, CD16, anti-CD56, anti-CD45RA, anti-CD45RO, anti-CCR7, anti-CD25, and anti-CD127 mAbs (BD Pharmingen). Results are expressed as mean of ratio of fluorescence intensity (MRFI), representing the ratio between the MRFI of cells stained with the selected mAb and that of cells stained with isotype-matched control mouse immunoglobulins (27), and as the % of positive cells.
Confocal microscopy analysis
GBM CSCs and FBS tumor cells were cultured (3 × 10⁴ cells per well) onto cover glasses precoated with Matrigel in 24-well plates in culture medium. Cells were fixed onto glasses either with methanol for 10 min at −20°C or with 4% paraformaldeide for 20 min at room temperature (RT), washed with PBS, and then treated with PBS plus 0.1% Triton for 10 min. Afterward cells were incubated for 30 min at 25°C with primary antibodies. The bound antibodies were visualized with goat anti-mouse IgG Alexa Fluor-594 (Molecular Probes) or the Alexa Fluor-488–conjugated goat anti-mouse IgG F(ab′)2 fragment (Molecular Probes). Glasses were extensively rinsed with PBS and then mounted on microscope slides with Vectashield antifade medium containing 4′,6-diamidino-2-phenylindole (Vector Laboratories, Inc.). Confocal Laser-Scanning Microscopy analysis was done using Zeiss AXIOSK0P2 MOT PLUS (Carl Zeiss) and LASER SHARP 2000 software (Bio-Rad Laboratories SrL). Multiple cells were analyzed for each staining condition with ×20, ×40, and ×100 magnifications.
Immunohistochemical analysis
Surgical specimens of four GBM patients (#070105, 080125, 080325, and 080418) were fixed in buffered formalin and were embedded in paraffin. Immunohistochemistry was done on 5-μm tissue sections. All cases were immunostained with a sensitive nonbiotin detection system (NovoLink polymer; Novocastra), with diaminobenzidine development. Heat-induced Ag retrieval was done using Tris-EDTA (pH 9.0) in a water bath for 30 min. The antibodies used are indicated above. All stainings were done with an automatic immunostainer (Autostainer 480, Thermofisher) and evaluated by a pathologist (CD).
Detection of cytokine and soluble factors released by GBM cells
GBM CSCs and FBS tumor cell lines (2 × 10⁵/mL) were cultured in DMEM (Biowittaker, Lonza) alone for 48 h at 37°C, then supernatants were collected, centrifuged at 3,000 rpm for 15 min, and stored at −80°C. Transforming growth factor β (TGFβ)-1 and TGFβ-2 released by GBM cells were detected by ELISA (DRG Instruments GmbH). Moreover, IL-6, IL-8, IL-10, IL-13 and tumor necrosis factor-α were detected in the supernatants of GBM lines by SearchLight Array Technology (Thermo Fisher Scientific Pierce Protein).
Isolation of GBM-reactive T lymphocytes
PBMCs from the peripheral blood of GBM patients were cultured in vitro in the presence of autologous irradiated (300 Gy) GBM CSCs or, when available, FBS tumor cells with 100 IU/mL of rh-IL-2 (Chiron Corp.) and 10 ng/mL rh-IL-7 (PEPROTECH) in X-VIVO-15 (Cambrex Corp., Lonza) plus 10% human serum. In some cases, PBMCs in vitro stimulated with autologous GBM CSCs or FBS tumor cells were cultured with rh-IL-2 plus 10 ng/mL of rh-IL-15 or of rh-IL-21 (PEPROTECH). Cell cultures were weekly restimulated with irradiated autologous GBM CSCs or FBS tumor cells; starting from the 3rd week of culture, the reactivity of the T lymphocytes against GBM CSC or FBS tumor cell lines was determined by cytokine (IFN-γ, granulocyte macrophage colony-stimulating factor, IL-4, IL-5, and Granzyme B) secretion measured by ELISPOT assay following a previously described protocol (28). The T cells (1 × 10⁴-4 × 10⁴ cells per well) were incubated in flat-bottomed 96-well plates in the presence of 1.5 × 10⁴ cells per well of GBM cell lines, or K562 or EBV-B cells.
The specificity of T lymphocyte recognition was assessed by the inhibition of cytokine or Granzyme B release after the preincubation of the target cells with 10 μg/mL each of the anti-HLA class I mAb W6/32 and the anti-HLA class II (DR) mAb L243. T lymphocytes incubated with mitogens, such as CON-A or phytohemagglutinin (PHA), or with pools of cytomegalovirus, EBV, and influenza peptides served as positive controls. T lymphocytes without any stimulation represented the negative control. Statistical analysis of differences between means for cytokine release assays was done using two-tailed t test (P < 0.05).
The cytotoxic activity of T lymphocytes was determined by the CD107a mobilization assay, as previously described (28), by the usage of the specific antibody in immunofluorescence and cytofluorimetric analysis following stimulation of T cells with target cells as described above. Two-tailed Student's test was done to determine differences between the percentage of CD107a-mobilizing T cells in tumor-stimulated wells (P < 0.05) and in unstimulated wells, or in the presence of anti-HLA class I (W6/32) or class II (L243) mAbs.
Cell division analysis by carboxyfluorescein diacetate succinimidyl ester staining
PBMCs isolted from healthy donors were labeled with 5-carboxyfluorescein diacetate succinimidyl ester (CFSE; and 6-CFSE) (Molecular Probe, Invitrogen). Ten million cells were suspended in PBS and were labeled for 8 min with 1 μmol/L CFSE at 37°C. The labeled cells were cultured with RPMI plus 5% human serum and stimulated with PHA plus Con-A (Sigma-Aldrich) in the presence or absence of irradiated (300 Gy) allogeneic HLA-mismatched GBM CSC or FBS tumor cells (080125 or 080418) or with OKT3. Before their usage as stimulators both, CSCs and FBS tumor cells were washed thrice with RPMI alone to eliminate any factors present in the basal growth medium. The homeostatic cytokine rh-IL-7 (5 ng/mL) was added to all culture conditions. After 72 and 120 h of stimulation, cells were stained with CD3-Pacific Blue (Becton Dickinson) and were acquired with LSR II cytofluorimeter (Becton Dickinson); data of CD3+-gated cells were analyzed with the FlowJo 8.8.6 software (Tree Star, Inc.).
Gene profile analysis
Total RNA (2-3 μg) isolated from 11 GBM CSC or 4 FBS tumor cells (0.5 × 10⁶ to 107) was amplified into anti-sense (a)RNA (29, 30). RNA isolated from a pool of six donor PBMC was amplified using identical method and was used as universal reference sample (29). Both reference and test aRNA samples were directly labeled using the ULS aRNA Fluorescent Labeling kit (Kreatech) with Cy3 for reference and Cy5 for test samples, and were hybridized on whole-genome human 36 K oligo arrays, representing 25,100 unique genes. The arrays were printed at the Infectious Disease and Immunogenetics Section of Transfusion Medicine, Clinical Center, NIH (Bethesda, MD) using the Human Genome Array-Ready Oligo Set version 4.0 (Operon). Hybridization was carried out in a water bath at +42°C for 18 h and the arrays were then washed and scanned on an Agilent Microarray Scanner. Resulting data files were analyzed using BRBArray Tools developed by the Biometric Research Branch,8 National Cancer Institute, NIH. Raw data sets were normalized using median over entire array to exclude genes with an intensity of <100 in both channel, and only gene presence in >80% across all experiments were used for further analysis. Hierarchical cluster analysis and TreeView (31) software were used for visualization (32).
Results
Isolation and characterization of GBM CSC lines
Tissue specimens were collected from patients with primary or recurrent GBM. GBM-derived CSC lines were isolated as previously described (17, 18). After tissue digestion, tumor cells were plated in the presence of either epidermal growth factor and fibroblast growth factor-2, or of 10% FBS (hereafter denominated FBS tumor cell lines). GBM CSCs could expand as neurospheres for several subculture passages, while retaining stable functional features (Supplementary Fig. S1A). For the experiments detailed below, GBM CSC lines were used from 30 to 50 in vitro passages because consistency in phenotype and functional features was observed along with the culture in vitro of GBM cell lines (data not shown).
All the CSC lines were validated for their multipotency by immunofluorescence analysis (a representative line is shown in Supplementary Fig. S1B-D). In fact, all of them were able to differentiate into the three cell lineages of the central nervous system, namely neurons, astrocytes (Supplementary Fig. S1B) and oligodendrocytes (Supplementary Fig. S1C).
Most importantly, CSC lines were endowed with the tumor-initiating ability, as shown by intracranial transplantation into nude mice (see Supplementary Fig. S1D). To improve the detection of in vivo invasion, GBM CSCs were infected with lentiviral vectors (VSV-pseudotyped third-generation lentiviral vector with the ubiquitously expressed human phosphoglycerate kinase promoter, phosphoglycerate kinase; ref. 33) coding for green fluorescent protein that allowed the visualization of tumor cells. Green fluorescent protein–tagged GBM CSC lines yielded experimental tumors closely resembling human disease. As previously described, the CSC-derived tumors were characterized by the extensive dissemination of tumor cells within the host's brain parenchyma, which was not observed in tumors induced by the FBS tumor cells or by the well-established U87 GBM line (17, 18).
To better characterize GBM CSCs and FBS tumor cells, the expression of neural stem cell–associated molecules, such as Nestin, S-100A4, and S100A6, transcription factors, such as c-Myc, and some pluripotent embryonic stem cell–associated transcription factors, such as Nanog, Oct4, Sox2, and Sall4, was determined (Table 1). Both CSCs and FBS tumor cells were positive for Nanog, S-100A4, S100A6, and Sall4; in addition, Nestin and Sox2 (Table 1) were expressed by all the GBM lines tested at higher levels (2- to 22-fold and 2- to 4-fold of MRFI, respectively) in CSC than the corresponding FBS-cultured cells. Lack of OCT4 and of CD133 expression (data not shown) was common in both CSC and FBS tumor lines. Only five of nine lines were positive for c-Myc, in line with the cell cycle dependence of its expression. EBV-B cells failed to stain for all the analyzed markers with the exception of Sox2 (Table 1).
Table 1. Expression of neural stem cell–associated molecules and of transcription factors by CSC and FBS tumor lines.
| Cell line | Molecule* | ||||||
|---|---|---|---|---|---|---|---|
| c-Myc | Nestin | Nanog | S100A4 | S100A6 | Sall4 | Sox2 | |
| 0627 CSC | 2 (70) | n.d. | 3 (97) | 3 (98) | 4 (97) | n.d. | 28 (100) |
| 080125 CSC | 2 (79) | n.d. | 2 (82) | 2 (92) | 2 (89) | 5 (100) | 7 (99) |
| 080125 FBS | 2 (88) | n.d. | 4 (99) | 2 (97) | 2 (84) | 8 (99) | 3 (99) |
| 080418 CSC | 2 (67) | 35 (99) | 2 (82) | 2 (92) | 4 (89) | 4 (100) | 38 (100) |
| 080418 FBS | 4 (89) | 15 (99) | 2 (99) | 1 (6) | 2 (43) | 3 (100) | 20 (100) |
| 080325 CSC | 1 (42) | n.d. | 3 (95) | 4 (97) | 2 (34) | 3 (99) | 15 (99) |
| 080325 FBS | 1 (3) | n.d. | 4 (99) | 1 (2) | 1 (1) | n.d. | 8 (79) |
| 071011 CSC | 1 (7) | 108 (99) | 2 (92) | 2 (61) | 3 (71) | n.d. | n.d. |
| 071011 FBS | 1 (1) | 5 (97) | 2 (85) | 2 (77) | 2 (57) | n.d. | n.d. |
| 070104 CSC | 2 (94) | 253 (75) | 4 (96) | 6 (97) | 5 (96) | 7 (78) | 35 (100) |
| EBV-B 1869 | 1 (2) | 1 (4) | 1 (6) | 1 (6) | 1 (3) | n.d. | 5 (98) |
Abbreviation: n.d., not done.
Note: Data are represented as MRFI that is the ratio between the mean of fluorescence intensity of cells stained with the selected mAb and that of the negative control; bold values indicate significant MRFI (≥ 2). The numbers in parenthesis represent the percentage of positive cells. The experiment has been repeated thrice; SD for each value ≥ 1 ≤ 4.
The expression of the indicated molecules was evaluated by intracellular staining with specific mAbs and cytofluorimetric analysis; see Materials and Methods.
These findings indicate that our GBM CSCs express phenotypic features of neural stem cells and that Nestin and SOX2 are differentially expressed by GBM CSC compared with FBS tumor cells.
Expression of MHC molecules and NKG2DLs by GBM CSCs and FBS tumor cell lines
The expression of MHC class I and class II molecules was evaluated by immunofluorescence and cytofluorimetric analysis in a panel of GBM CSCs. Table 2 shows the results of eight different primary CSC lines isolated in vitro from GBM lesions; CSC and FBS tumor cell line pairs from four GBM patients (#080125, 080418, 080201, and 071011) are also shown. MHC class I molecules were detectable both in CSCs and FBS tumor cells, although at relatively low levels (MRFI 2-7). Only two GBM lines (#071011 FBS and 080325 CSCs) expressed high level of these molecules (MRFI 26 and MRFI 30, respectively).
Table 2. Expression of MHC class I and class II, and NKG2DLs molecules and their modulation by IFN-γ by GBM CSCs and FBS tumor cell lines.
| Cell line | IFN-γ* | Molecule† | |||||||
|---|---|---|---|---|---|---|---|---|---|
| MHC I | MHC II | MICA | MICB | ULBP-1 | ULBP-2 | ULBP-3 | ULBP-4 | ||
| 0627 CSCs | − | 7 (94) | 6 (31) | 4 (41) | 1 (6) | 1 (1) | 1 (5) | 1 (1) | 1 (2) |
| + | 8 (100) | 7 (52) | 4 (55) | 1 (5) | 1 (1) | 1 (7) | 1 (1) | 1 (1) | |
| 0627 FBS | − | 4 (81) | 4 (51) | 1 (2) | 1 (1) | 1 (2) | 1 (1) | 1 (1) | 3 (32) |
| + | 8 (100) | 4 (80) | 1 (3) | 1 (1) | 1 (3) | 1 (1) | 1 (1) | 3 (45) | |
| 080125 CSCs | − | 2 (97) | 1 (2) | 1 (4) | 1 (2) | 1 (1) | 1 (4) | 1 (3) | 2 (24) |
| + | 14 (100) | 1 (6) | 1 (4) | 1 (2) | 1 (2) | 2 (20) | 2 (25) | 2 (33) | |
| 080125 FBS | − | 3 (94) | 1 (2) | 3 (95) | 1 (2) | 1 (1) | 2 (14) | 1 (3) | 2 (45) |
| + | 6 (100) | 1 (8) | 3 (98) | 1 (3) | 1 (3) | 2 (14) | 1 (4) | 2 (47) | |
| 080418 CSCs | − | 1 (8) | 1 (2) | 1 (4) | 1 (1) | 1 (2) | 2 (10) | 3 (20) | 3 (40) |
| + | 3 (95) | 1 (6) | 1 (4) | 1 (2) | 1 (2) | 2 (26) | 3 (31) | 3 (55) | |
| 080418 FBS | − | 3 (96) | 1 (3) | 3 (95) | 1 (2) | 1 (3) | 1 (4) | 3 (15) | 1 (4) |
| + | 15 (96) | 1 (8) | 3 (98) | 1 (2) | 1 (3) | 1 (3) | 3 (45) | 1 (6) | |
| 080201 CSCs | − | 2 (65) | 1 (2) | 2 (27) | 2 (20) | 2 (15) | 2 (12) | 1 (3) | 2 (18) |
| + | n.d. | n.d. | n.d. | n.d. | n.d. | n.d. | n.d. | n.d. | |
| 080201 FBS | − | 4 (99) | 1 (1) | 1 (6) | 1 (4) | 1 (4) | 2 (22) | 1 (3) | 2 (18) |
| + | n.d. | n.d. | n.d. | n.d. | n.d. | n.d. | n.d. | n.d. | |
| 071011 CSCs | − | 6 (98) | 1 (1) | 1 (5) | 1 (4) | 1 (5) | 2 (2) | 1 (4) | 2 (21) |
| + | n.d. | n.d. | n.d. | n.d. | n.d. | n.d. | n.d. | n.d. | |
| 071011 FBS | − | 26 (99) | 2 (76) | 2 (96) | 2 (93) | 2 (94) | 3 (95) | 4 (96) | 4 (98) |
| + | n.d. | n.d. | n.d. | n.d. | n.d. | n.d. | n.d. | n.d. | |
| 080325 CSCs | − | 30 (99) | 1 (4) | 1 (5) | 2 (67) | 1 (3) | 2 (81) | 3 (80) | 2 (77) |
| + | n.d. | n.d. | n.d. | n.d. | n.d. | n.d. | n.d. | n.d. | |
| 070104 CSCs | − | 3 (20) | 2 (18) | 1 (2) | 1 (2) | 1 (3) | 1 (2) | 1 (2) | 1 (2) |
| + | 12 (98) | 4 (67) | 1 (3) | 1 (4) | 1 (4) | 1 (3) | 1 (2) | 1 (2) | |
Abbreviation: n.d., not done.
Note: Values are indicated as MRFI that is the ratio between the mean of fluorescence intensity of cells stained with the selected mAb and that of the negative control; bold values indicate significant MRFI (≥ 2). The numbers in parenthesis represent the percentage of positive cells. The experiment has been repeated thrice; SD for each value ≥ 1.2 ≤ 4.
Cells were treated or not (±) for 48 h with 500 IU/mL of IFN-γ
Expression of MHC molecules and NKG2DLs was evaluated by immunofluorescence and cytofluorimetric analysis.
Nevertheless, MHC class I molecule expression was 2- to 7-fold upmodulated by treatment of cells for 48 hours with 500 IU/mL of IFN-γ. In addition, only the 080418 CSC line was completely negative at the basal level for MHC class I molecules, although significant expression was achieved following IFN-γ treatment. Notably, four of four FBS tumor cells (#080125, 080418, 080201, and 071011) expressed MHC class I molecules at higher levels than their CSCs counterparts (3 versus 2, 3 versus 1, 4 versus 2, and 26 versus 6 MRFI, respectively). To exclude that culture conditions, in particular the presence of FBS or growth factors, could affect the expression of MHC molecules, 0627 CSCs were temporarily (4 weeks) cultured with FBS (0627 FBS) with no appreciable changes in MHC class I molecule expression (Table 2). Low or negative expression of MHC class II molecules was observed in both GBM CSC and FBS tumor cell lines (MRFI 1-6), and furthermore, in 3 of 4 CSC and FBS tumor line pairs, no upregulation was found following IFN-γ treatment. MHC class II expression was instead detected in 070104 CSC, 071011 FBS, and both 0627 CSC and FBS cell lines (2, 2, 6, and 4 MRFI, respectively). The expression of these molecules was significantly increased, although at low level (2- to 3-fold; 2-3 MRFI) by the IFN-γ preincubation of 070104 but not for 0627 cell lines. Similar results were obtained by treatment of cancer cells with IFN-α. Supplementary Figure S2 shows representative results of IFN-α treatment (1,000 IU/mL for 48 or 72 hours) of two GBM CSC and FBS tumor cell line pairs (#080125 and 080418). Modulation of MHC class I by IFN-α was more efficiently achieved in FBS than in CSC lines. Of note, IFN-α and IFN-γ treatment failed to modulate the expression of MHC class II molecules (see Supplementary Fig. S2 and Table 2). No changes in the morphology and expression of neural stem cell–associated molecules was detected following IFN treatment of both CSCs and FBS tumor cells. Notably, the expression of MHC and NKG2D molecules was also evaluated by multifluorochrome staining in relation to the expression of Nanog and SOX2 showing that, when detectable, these molecules were homogeneously expressed by both CSCs and FBS tumor cells (data not shown). Only for NKG2DLs did the percentage of positive cells vary (see Table 2), in line with previous reports of heterogeneous expression of these molecules by tumor cells (27). The expression by GBM CSCs or the FBS tumor cell lines of NKG2DLs (MICA/B, ULBP-1-4) was also evaluated. As shown in Table 2, these molecules were heterogeneously expressed by both CSC and FBS tumor cells, with MICA, ULBP-2, ULBP-3, and ULBP-4 more commonly detectable, although at low levels (2-4 MRFI). No clear increase of NKG2DLs by CSC or FBS tumor lines was observed following IFN-γ treatment (see Table 2). In only few cases, the incubation with IFN-α significantly modulated (2- to 3-fold increase of MRFI) the expression of NKG2DLs (Supplementary Fig. S2).
These data show that significant levels of MHC class I but not MHC class II or NKG2DL were detectable in both CSC and FBS tumor cell lines, although only few lines showed high expression of these molecules. In addition, significant modulation of the expression of MHC class I molecules could be induced by IFN (both α and γ), which in few cases induced also MHC class II molecules and NKG2DLs.
Defective expression of APM by both GBM CSCs and FBS tumor cell lines
Alterations of antigen processing and presentation are frequent events in cancer cells. To see whether this could occur in our GBM lines, the expression of an array of molecules belonging to the APM was examined by intracellular cytofluorimetric analysis. These molecules included MHC class I molecules and their heavy chains (i.e., A-HC), β2-microglobulin, constitutive proteasome subunits (delta, MB1, and Z), immunoproteasome (LMP2, LMP7, and LMP10), transporter molecules (TAP), and chaperon molecules (tapasin, calnexin, calreticulin, and ERp57; Table 3). Heterogeneous detection, with negative or low level of expression (1-2 MRFI) of HLA-A, HLA-B, and HLA-C molecules by most GBM CSC and FBS tumor cell lines was found, in most cases with higher levels in FBS tumor cells than in CSCs (Table 3). Similar results were obtained for the staining of A-HC and the β2-microglobulin (Table 3). The expression of all these molecules was significantly increased 2- to 7-fold by the pretreatment of GBM tumor cells with IFN-α (Supplementary Table S1).
Table 3. Expression of APM in GBM CSC and FBS tumor cell lines.
| Cell line | Molecule* | ||||||||
|---|---|---|---|---|---|---|---|---|---|
| HLA | β2-m† | HLA class II | LMP | TAP1 | TAP2 | ||||
| A | A HC‡ | 2 | 7 | 10 | |||||
| 0627 CSCs | 2 (76) | 4 (23) | 2 (49) | 1 (6) | 4 (100) | 2 (100) | 1 (6) | 1 (1) | 1 (4) |
| 0627 FBS | 2 (80) | 2 (33) | 2 (61) | 2 (45) | 3 (98) | 2 (99) | 1 (3) | 1 (3) | 3 (53) |
| 080125 CSCs | 1 (4) | 3 (94) | 2 (100) | 1 (8) | 6 (100) | 2 (98) | 1 (2) | 1 (6) | 1 (5) |
| 080125 FBS | 2 (81) | 4 (63) | 4 (98) | 1 (6) | 6 (100) | 3 (86) | 2 (87) | 1 (3) | 2 (87) |
| 080418 CSCs | 2 (78) | 1 (5) | 1 (3) | 2 (72) | 2 (98) | 2 (95) | 1 (3) | 1 (3) | 1 (3) |
| 080418 FBS | 1 (6) | 3 (24) | 2 (94) | 1 (2) | 3 (100) | 2 (100) | 1 (4) | 1 (1) | 1 (4) |
| 080201 CSCs | 14 (99) | 16 (99) | 7 (87) | 6 (71) | 14 (99) | 12 (100) | 3 (99) | 3 (98) | 6 (99) |
| 080201 FBS | 7 (98) | 37 (98) | 53 (98) | 6 (78) | 20 (100) | 12 (97) | 5 (96) | 4 (98) | 7 (99) |
| 071011 CSCs | 7 (80) | 26 (93) | 10 (43) | 6 (22) | 36 (99) | 15 (88) | 3 (45) | 2 (60) | 9 (88) |
| 071011 FBS | 5 (78) | 7 (98) | 20 (98) | 2 (98) | 8 (99) | 3 (95) | 1 (5) | 1 (6) | 2 (97) |
| 080325 CSCs | 10 (98) | 19 (99) | 9 (99) | 12 (99) | 24 (100) | 20 (100) | 4 (78) | 4 (89) | 7 (99) |
| 070104 CSCs | 1 (2) | 1 (3) | 2 (45) | 2 (76) | 1 (4) | 1 (3) | 1 (2) | 1 (3) | 1 (3) |
| 1869 EBV-B | 16 (96) | 19 (91) | 19 (98) | 10 (94) | 5 (82) | 6 (99) | 3 (89) | 4 (91) | 8 (94) |
Note: Values are indicated as ratio between the mean of fluorescence intensity of cells stained with the selected mAb and that of the negative control; bold values indicate significant MRFI (≥ 2). The numbers in parenthesis represent the percentage of positive cells. The experiment has been repeated thrice; SD for each value ≥ 0.6 ≤ 4.
Expression of APM molecules was evaluated by intracellular staining of permeabilized cells and cytofluorimetric analysis.
β-2 Microglobulin.
β-2 Microglobulin–free HLA-A heavy chain.
The 1869 EBV-B line that represents professional Antigen presenting cells (APCs) was used as positive control for antigen-presenting cell staining (Supplementary Table S1; Table 3).
Expression of immunoproteasome components LMP2 and LMP7 by both GBM CSCs and FBS tumor cells was commonly detected, although at low MRFI (2–8), whereas lack of the expression of LMP10 was observed in most lines (6 of 8 CSCs and 2 of 2 FBS tumor cell lines). TAP1 and TAP2 were weakly detected and a variable upregulation of their expression was induced by IFN-α (Supplementary Table S1). Similar results were observed for the other APM molecules analyzed as reported in Supplementary Tables S2 and S3. Calnexin was the only APM molecule widely (13-100 MRFI) detected in all CSC and FBS tumor cell lines (Supplementary Table S2 and S3), although these cell lines lacked or showed a low expression of chaperon molecules calreticulin, ERp5, and Tapasin (Supplementary Table S2); only in few cases did weak augmentation of the expression of these molecules followed in vitro incubation with IFN-α occur (Supplementary Table S3). The percentage of positive cells shown in Table 3 and Supplementary Table S1 to S3 indicates that when APM were detectable, homogeneous expression of these markers was observed, a result confirmed by multifluorochrome staining in relation with Nanog and SOX2 expression (data not shown). These results were confirmed by the treatment of GBM cell lines with IFN-γ (data not shown).
In addition, intracellular expression and/or modulation by IFN-α of MHC II molecules were detectable in three of seven CSC lines (#080201, 071011, and 080325) and in three of five FBS cell lines (2-12 MRFI; Supplementary S1; Table 3), although most of the lines lacked surface expression of these molecules (Supplementary Fig. S2; Table 2), suggesting defects in peptide loading and/or trafficking in GBM lines.
Taken together, these results show, with the exception of Delta and Calnexin, the lack or the low expression of APM molecules by GBM cells, although such expression could be occasionally rescued by IFN-α or IFN-γ treatment.
Interestingly, low or negative expression for most of the MHC, APM, and NKG2DL molecules was found by the immunohistochemical analysis of neoplastic tissues from four GBM patients whose tumors were used to generate some of the lines under study (#070104, 080125, 080418, and 080325). Representative results of the staining for some of these molecules (A-HC and HLA-DR) are shown in Supplementary Fig. S3 (E-H and I-N, respectively). The low or defective expression of APM and MHC molecules observed in vitro established CSC and FBS tumor cells was consistent with the in vivo pattern of expression of these molecules by GBM lesions, thus indicating that these cell lines are representative of different GBM cell subpopulations.
To determine whether cellular epigenetic modifications, such as hypermethylation of gene promoter regions, could affect expression of MHC, MHC-related molecules, and APM molecules, both CSCs and FBS tumor cell lines were cultured in vitro in the presence of the DNA methyltransferase inhibitor 5-Aza-2′-deoxycytidine. Immunofluorescence and flow cytometry analysis were then done (Supplementary Table S4), resulting in a variable upregulation (2- to 3-fold increase of MRFI) of MIB, LMP10, and TAP1 preferentially in FBS tumor cell lines. Only in 080125 CSCs the modulation of MIB was observed, whereas no modification of the expression of LMP10 and TAP1 was found in CSCs. The demethylating treatment of CSCs and FBS tumor cells did not affect the morphology or the expression of neural stem cell associated markers (data not shown).
The surface expression of MHC class II and MICA was not altered in both GBM CSC and FBS tumor lines, with the exception of a 2.5-fold increase of MHC II expression in 070104 CSCs (Supplementary Table S4). Treatment of control EBV-B cells resulted in the upregulation of all the analyzed molecules except NKG2DLs.
Hitherto, molecules that were not upregulated by IFN treatment such as MIB, LMP10, and TAP1 (see Supplementary Tables S2-3 and Table 2), were significantly modulated by 5-Aza-2′-deoxycytidine preferentially in FBS tumor cells, suggesting that differential mechanisms of deregulation of MHC and APM molecules can occur in CSC and FBS tumor cells (Supplementary Table S4).
Isolation of anti-GBM T lymphocytes by in vitro stimulation with autologous CSC or FBS tumor cells
To assess whether GBM CSCs represent targets for T cell–mediated immune reactions, PBMCs isolated from four GBM patients (#070104, 080125, 080325, and 080418) were stimulated in vitro with autologous irradiated CSC or, when available, FBS tumor cells, and after 4 to 6 weeks of restimulation, the specific reactivity of T lymphocytes was evaluated by cytokine release assays (IFN-γ and IL-5; ELISPOT). As shown in Fig. 1, three independent T-cell lines (#2, 3, and 10) with anti-GBM activity (IFN-γ secretion) were isolated in vitro following incubation of T lymphocytes with IFN-γ–pretreated autologous CSC cells. Moreover, cytokine secretion by T-cell lines #2, 3, and 10 was inhibited following pretreatment of target cells with anti-HLA class I (W6/32) or anti–HLA-DR (L243) mAbs, respectively (Fig. 1). These data are in line with the CD3+CD8+ T-cell phenotype of lymphocytes from cultures #2 and 10, whereas T-cell line #3 homogeneously expressed CD3 and CD4 (Table 4). Furthermore, all T-cell lines expressed CD45RO, CD62L, and CD127 and were negative for CD27 and CCR7 (data not shown), indicating that these lymphocytes belong to the effector memory T-cell subset.
Fig. 1.
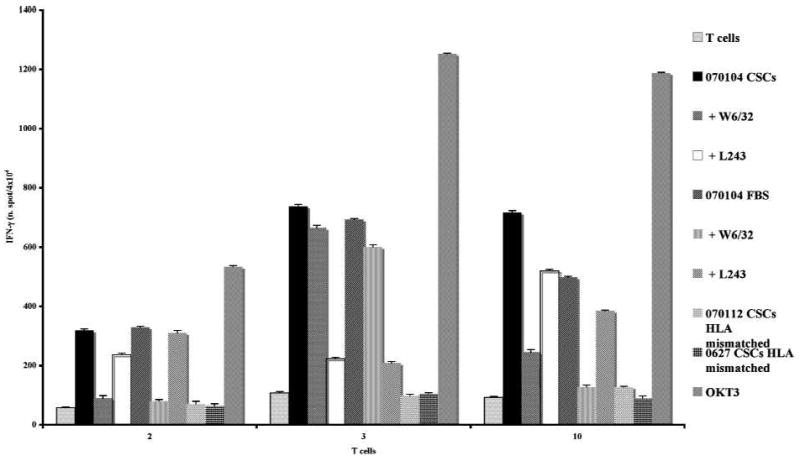
Reactivity of 070104 T lymphocytes against autologous GBM CSCs. PBMCs isolated from GBM patient 070104 were stimulated in vitro with autologous irradiated CSCs and, following 3 wk of culture, the reactivity against autologous or allogeneic GBM CSCs was assessed by IFN-γ release (ELISPOT assay). Cytokine secretion was determined following stimulation of T cells with autologous CSCs (black columns), autologous CSCs pretreated with anti-MHC class I (W6/32) or anti-MHC class II (L243) mAbs (gray and dotted white columns, respectively), autologous CSC in vitro cultured for a few weeks in the presence of FBS (gray dotted bar), autologous FBS-cultured CSCs pretreated with anti-MHC class I (W6/32) or anti-MHC class II (L243) mAbs (small grid and gray bars, respectively), allogeneic HLA-mismatched CSCs (0627 and 070112; black squared bars, respectively) and, as positive control with OKT3 mAb (dark gray bar). As shown in the figure, three independent T-cell lines with specific recognition of autologous CSCs were in vitro isolated (#2, 3, and 10). Data are expressed as number of spot per 4 × 10⁴ cells. Results represent averages of triplicates with an SD of ≤10%; statistical analysis of differences between means of IFN-γ released by T cells was done by two-tailed t test.
Table 4. Cytotoxic activity, determined as CD107a mobilization of T lymphocytes cell lines against autologous CSCs.
| T cells | CD4/CD8 | Target cells | |||||
|---|---|---|---|---|---|---|---|
| Ly alone | 070104 CSCs | +W6/32 | +L243 | 0627 CSCs HLA mismatched | QKT3 | ||
| 2 | 5/95* | 1† | 20 | 9 | 17 | 7 | 56 |
| 3 | 96/4 | 1 | 2 | 1 | 1 | 1 | 8 |
| 10 | 20/76 | 2 | 13 | ND | ND | 1 | 24 |
NOTE: OKT3 stimulation of T cells was used as positive control of CD107a mobilization. Data are expressed as % of positive and represent averages of duplicates with an SD of ≤10.
Abbreviation: ND, not determined.
Results represent the percentage of CD4- and CD8-positive T cells.
Results represent the percentage of CD107a-positive T cells.
These T-cell lines recognized specifically (inhibition of IFN-γ release in the presence of anti-HLA class I or class II mAbs) the 070104 CSCs cultured in vitro for at least 1 month in the presence of FBS, suggesting that anti-GBM reactivity was not affected by culture conditions of target cells. In addition, the T-cell lines #2, 3, and 10 did not recognize allogeneic HLA-mismatched CSCs (070112 and 0627; Fig. 1), although the cell lines reacted to the positive control mAb OKT3.
The CD8+ T-cell lines #2 and 10 (patient 070104) exerted HLA class I–restricted [inhibition of molecule mobilization with anti-HLA class I mAb (W6/32), 20% versus 9% of positive cells] cytotoxic activity, measured by CD107a mobilization, against autologous CSCs in line with the evidence that CD8+ enrichment occurred in these T-cell cultures (Table 4). No CD107a mobilization was found in these cells following incubation with HLA-mismatched CSCs (0627 CSCs) in spite of good mobilization in response to OKT3 (56% and 24% of positive cells for T cells #2 and 10, respectively; Table 4). Along this line, specific secretion of Granzyme B (ELISPOT assay) was observed following incubation of T-cell lines #2 and 10 with autologous CSCs and, as positive control, with OKT3 mAb, indicating that cytotoxic functions were done by these T-cell lines (Supplementary Fig. S4). CD107a mobilization assay and Granzyme B have been shown to fully correlate with the lysis of target cells, as determined by the 51Cr release assay (34–36). No cytotoxic activity (determined both by CD107a mobilization and Granzyme B secretion) was observed for T-cell line #3, expressing homogeneously CD4 (96% of positive cells; Table 4), suggesting that the anti-GBM activity by these lymphocytes was mainly mediated by cytokine release (IFN-γ).
In vitro culture of PBMCs with autologous CSC or FBS tumor cells was done in three additional GBM patients (#080325, 080125, and 080418) and the tumor-specific reactivity of T lymphocytes (Table 5). Most T-cell lines isolated from these GBM patients (T-cell cultures #1 and 4 from 080325, #4 from 080125, and #1 from 080418 patients) released IL-5 and not IFN-γ following stimulation with autologous tumor cells (Table 5). In addition, the reactivity, except for T cells #1 of patient 080418, was MHC class II restricted, as shown by the inhibition of cytokine secretion in the presence of L243 mAb (data not shown). These results together with phenotype analysis of these T lymphocytes that showed the homogeneous expression of CD3, CD4, CD45RO, and CD62L, and lack of expression of CCR7 indicate that in two of four GBM patients (#080125 and 080325), the in vitro stimulation of PBMCs with autologous irradiated CSCs led to the development of TH2 lymphocyte subset–mediated anti-GBM immune responses.
Table 5. Summary of the reactivity against CSC or FBS tumor cell lines by T lymphocytes isolated from GBM patients.
| Patient no. | T-cell line no. | Autologous CSC recognition | Autologous FBS tumor cell recognition | MHC restriction* | Cytokine release | TH type subset |
|---|---|---|---|---|---|---|
| 070104 | 2 | +++† | NA | MHC I | IFN-γ | TH1 |
| 3 | +++ | NA | MHC II | IFN-γ | TH1 | |
| 10 | +++ | NA | MHC I | IFN-γ | TH1 | |
| 080325 | 1 | + | +++ | MHC II | IL-5 | TH2 |
| 2 | + | ++ | MHC I | IFN-γ | TH1 | |
| 4 | + | ++ | MHC II | IL-5 | TH2 | |
| 080125 | 4 | + | ++ | MHC II | IL-5 | TH2 |
| 080418 | 1 | + | + | - | IL-5 | TH2 |
NOTE: +, ≥ 50 < 100 spots/4 × 104 T cells; ++, ≥ 100 < 200 spots/4 × 104 T cells; +++, ≥ 200 < 800 spots/4 × 104 T cells; -, no inhibition was observed following preincubation of target cells with anti-HLA class I (W6/32) or HLA class II (L243) mAbs. These results have been obtained by thrice repeated ELISOPT assays, starting from the 3rd until the 6th week of culture. These were consistent throughout the repeated experiments, and the means of cytokine release and SD (≤10%) have been calculated; moreover, statistical analysis of differences between means of IFN-γ or IL-5 released by T cells was performed by two-tailed t test (data not shown).
Abbreviation: NA, FBS tumor cells were not available.
MHC restriction was evaluated by assessment of inhibition of cytokine release by T cells following coculture with either autologous GBM CSC or FBS tumor cells preincubated with anti-HLA class I (W6/32) or HLA class II (L243) mAbs.
Recognition by T lymphocytes of autologous CSC or FBS tumor cells was assessed by cytokine release (IFN-γ or IL-5) using ELISPOT.
Only one of three T-cell lines (#2) isolated from 080325 GBM patient exerted antiautologous tumor recognition mediated by IFN-γ secretion, and showed CD3+CD8+ T-cell enrichment, in line with TH1 subset–mediated reactivity against GBM cells (Table 5). Although no cytotoxic activity, as evaluated by 51Cr release assay, against autologous CSCs or FBS tumor cells was observed (data not shown).
T-cell cultures isolated from patients 080325 and 080125 showed higher reactivity against autologous FBS tumor cells than against CSCs (100-800 versus 50-100 spots/4 × 104 cells; see Table 5); these results were confirmed when autologous FBS tumor cells were used as source of TAAs for in vitro stimulation of PBMC from 080325, 080125, and 80418 GBM patients (data not shown).
To assess whether the low efficiency in eliciting in vitro T cell–mediated immune responses by GBM CSCs and FBS tumor cells depends on the expression by these cells of immune regulatory molecules, such as CTLA-4 and PD-1, or their ligands, B7-1 and B7-2, and PDL-1 and PDL-2, respectively, phenotype analysis with the respective mAb was done. All CSC and FBS cell lines were homogeneously positive for CTL-4, PD-1, and, although at higher levels, PD-L1 (Supplementary Table S5). These cell lines were mostly negative for PD-L2, with the exception of 080125 and 080201 FBS tumor cell lines (Supplementary Table S5). Furthermore, both B7-1 and B7-2 molecules that represent ligands of either the T cell–associated costimulatory molecule CD28 or the inhibitory CTLA-4 molecule were not detected in GBM cell lines (data not shown).
Thus, GBM CSC and FBS tumor cells expressed significant levels of negative regulators of T-cell responses (e.g., CTLA-4 and PD-1) and their ligands (e.g. PD-L1), suggesting that the engagement of these molecules may contribute to the inefficient induction in vitro of T cell–mediated responses by both GBM CSC and FBS tumor cells and, thus to the possible impairment of in vivo anti-GBM immune reactions.
Therefore, the low level of expression of APM components and/or NKG2DLs, the lack of the expression of costimulatory molecule ligands, such as B7-1 and B7-2, and the expression of immune regulatory molecules by GBM CSCs render these cells weakly immunogenic. Notably, efficient GBM-specific stimulation of T lymphocytes by GBM CSCs could be achieved for the patient expressing detectable level of surface MHC class II molecules (#070104; see Table 2 and Fig. 1).
GBM CSC can suppress the proliferation of allogeneic-stimulated PBMCs
PBMCs from one healthy donor were stimulated in vitro with PHA/concanavalin A in the presence or absence of allogeneic GBM CSCs or FBS tumor cells isolated from patients 080125 and 080418. After 120 hours in culture, the proliferative activity of the gated CD3+ T lymphocytes was determined by CFSE labeling and flow cytometry. OKT3 was used as positive control. Inhibition (50% reduction of the percentage of divided cells and of the proliferation index, and 3-fold reduction of the division index) of mitogen-induced (PHA + concanavalin A) proliferation of CD3+ T cells was observed following incubation with either allogeneic 080125 or080418 CSCs, but not with allogeneic FBS tumor cells isolated from these same patients (Table 6), indicating that GBM CSCs can play a role in the suppression of T lymphocyte proliferation and can also interfere with mitogen-mediated proliferative signaling (Table 6). Similar results were obtained when T-cell proliferation was evaluated following 72 hours of culture (data not shown). No significant enrichment of T cells with regulatory functions (Tregs), determined by phenotype analysis of CD3+CD4+CD25highCD127dim cells, was observed in all the culture conditions used for proliferation assay (data not shown). Thus, suggesting that the suppression of T-cell proliferation caused by CSCs was not mediated by this lymphocyte subset. Further studies are needed to determine whether CSC exert suppression functions by cell-to-cell contact or by the secretion of soluble factors or of exosomes with immunomodulating functions (37).
Table 6. Suppression of T-cell proliferation by CSCs but not by their paired FBS tumor cells.
| Patient | Mitogen | Tumor cells | % Divided cells* | Division index† | Proliferation index‡ |
|---|---|---|---|---|---|
| 080125 | No | No | 14 | 0.2 | 1 |
| PHA/ConA | No | 44 | 1 | 2 | |
| PHA/ConA | CSCs | 27 | 0.3 | 1 | |
| PHA/ConA | FBS tumor cells | 46 | 1 | 2 | |
| OKT3 | No | 57 | 1.5 | 3 | |
| 080418 | No | No | 12 | 0.1 | 1 |
| PHA/ConA | No | 54 | 1 | 2 | |
| PHA/ConA | CSCs | 30 | 0.4 | 1 | |
| PHA/ConA | FBS tumor cells | 46 | 1 | 2 | |
| OKT3 | No | 57 | 1.5 | 3 |
NOTE: PBMCs (1 × 10⁷) of healthy donor were stained with 1 mmol/L CSFE and stimulated with PHA/concanavalin A in the presence or not of 5-d cultured CSCs or FBS tumor cell lines isolated from 080125 or 080418 GBM patients. After 5 d of incubation, cells were harvested and the CFSE profile was assessed by flow cytometry. The experiment was repeated twice for each time point (72 and 120 h) and data were consistent throughout the experiments with an SD of ≥ 1.4 ≤ 2.3 for each value. Statistical analysis of differences between means of the % divided cells, of the division index, or of the proliferation index was done by two-tailed t test. Data are referred to CD3+-gated cells.
Abbreviation: ConA, concanavalin A.
% Divided cells, the percentage of cells of the original sample that divided.
Division index, the average number of divisions that a cell has undergone.
Proliferation index, the average number of divisions that the divided cells underwent.
Gene profile analysis of GBM CSCs and FBS tumor cells
To further assess the differences between GBM CSCs and FBS tumor cells, we applied whole transcriptome gene expression analysis. As shown in Supplementary Fig. S5, significant differences at the transcript level were found between CSCs and FBS tumor cell lines leading to the identification of 469 genes (fold change, >1.5; P < 0.005 and permutation < 0.017) that were differentially expressed between CSCs and FBS tumor cells (Supplementary Table S6). Strikingly, among differentially expressed genes, mitochondrial dysfunction– and cholesterol biosynthesis–related genes were mostly downregulated or up-regulated, respectively. Nevertheless, we found that genes with immunologic function were differentially expressed in CSCs versus FBS tumor cells. In particular, the proteasome maturation protein and the proteasome activator subunit 1 were downmodulated (−1.8- and −2.4-fold change, respectively) in CSCs compared with FBS tumor cells correlating with alterations we found at the protein level of APM molecule (i.e., MB1) expression. In addition, genes related to IFN signaling, such as IFN regulatory factor-binding 2 protein (2.7-fold), Tax1 (3.2-fold), IFNGR1 (1.7-fold), and the tumor necrosis factor receptor–associated factor 2 (1.8-fold) were also underexpressed in CSCs in comparison with FBS tumor cells. Notably, IL-6 and IL-8 were also found downmodulated in CSCs versus FBS tumor cells, and these findings correlated with protein secretion levels (detected by SearchLight Array Technology) in the supernatants of these cell lines (Supplementary Fig. S6C and D). The secretion of these cytokines by tumor cells, including GBM, and, in some cases, in association with tumor-mediated angiogenesis has been detailed in ref. (38). The profile of downmodulation of proinflammatory factors in GBM CSCs could be the results of a general silencing that may facilitate the escape of these cells from immune surveillance. In addition, both TGF-β1 and TGF-β2 were detected in the supernatants of all these lines, although at higher levels in FBS tumor cells (131-304 versus <50 pg/mL for TGF-β1 and 327-3499 versus 48-127 pg/mL for TGF-β2, respectively; Supplementary Fig. S6A and B).
No differential gene expression of IFN-β, IFN-α, tumor necrosis factor receptor, and IL-1 was detected between CSCs and FBS tumor cells. Conversely, genes involved in Janus-activated kinase–signal transducers and activators of transcription signal pathway were found upregulated (2-fold) in CSCs compared with FBS tumor cells, in line with the previously reported evidence that members of this protein family were aberrantly activated in a variety of tumors including GBM (38, 39).
Taken together, these results indicate that high throughput analysis can identify a differential gene signature between GBM CSCs and FBS tumor cells and, moreover, that some of these differentially expressed genes are related to immunologic pathways.
Discussion
In this study, we exploited the availability of a panel of CSCs and, in some cases, of autologous FBS tumor cells isolated from GBM patients to characterize their immune profile and to explore the possibility of targeting CSCs by raising specific T cell–mediated immune responses. Our results show that GBM-derived CSCs expressed MHC class I molecules, although at lower level than FBS tumor cells (Supplementary Fig. S2; Table 2). These molecules were significantly upregulated by IFN-α or IFN-γ treatment; the increase of MHC class I being higher in FBS tumor cells than in their CSC pairs. Conversely, lack or the negligible expression of MHC class II molecules was found for both CSCs and FBS tumor cells that could not be restored, except for one CSC line (070104), by IFNs (Supplementary Fig. S2; Table 2). In addition, CSCs and FBS tumor cells lacked or expressed low level of NKG2DLs, and only in few cases, these ligands could be upmodulated by treatment with IFN-α (Supplementary Fig. S2). Furthermore, defective expression of an array of APM molecules, except for γ, Calreticulin, and LMP2/7, was commonly found in both CSC and FBS tumor cells, and the IFN treatment could modulate the expression of some but not other molecules (e.g., LMP10, TAP1, MB1, ERp75, and Tapasin). These results are in line with the previously reported defective expression of MHC and APM molecules in a variety of human tumors (25, 40–42), indicating that low efficiency in antigen processing and presentation occur also in GBM and, interestingly, in CSC isolated from this tumor type.
Hitherto, these results confirm the low immunogenicity of both GBM-derived CSCs and FBS tumor cells, which may render them resistant to the T cell–mediated immune reactions. Nevertheless, incubation of these cells with IFNs or the demethylating agent 5-Aza-2′-deoxycytidine can partially restore the expression of MHC, APM, and NKG2DLs, although to a higher level in FBS tumor cells than in CSCs, thus suggesting, as shown in a large number of melanoma cell lines (43), that different mechanisms can affect alterations in antigen processing and presentation by GBM CSCs and FBS tumor cells. These results are in line with previous observations showing that GBM CSC, isolated on the basis of the expression of CD133 molecule, as well as CD133− cells, failed to express detectable level of MHC class I and natural killer (NK) cell activatory ligands, leading to resistance by these cells to NK-mediated lysis and showing that IFN-γ treatment of these cells could increase their susceptibility to NK cell activity (44). Notably, we found no or weak in vivo expression of MHC, APM, and NKG2DLs by GBM tissues, thus confirming the results obtained for GBM cell lines and indicating that these cell lines are indeed representative of the original neoplastic lesions.
Furthermore, among the 469 genes that resulted, by the gene profile analysis, differentially expressed in GBM CSCs versus FBS tumor cells, the downmodulation of some immunologic-related genes, such as proteasome components (proteasome maturation protein and the proteasome activator subunit 1) IFN-γ and IFN-γR1, correlate with our observations that the defective expression of MHC and APM molecules can be more pronounced in GBM CSCs. Moreover, reduced 26S proteasome activity has been found as a general feature of CSCs isolated from GBM and breast cancer (45).
Interestingly, IL-6 and IL-8 were also found downmodulated in CSCs versus FBS tumor lines, correlating with the results obtained at protein level (Supplementary Fig. S6).
One key finding from our study is that T-cell responses, both CD4+– and CD8+–mediated, against GBM could be raised in one GBM patient by stimulating in vitro PBMCs with autologous CSCs pretreated with IFN-γ (Fig. 1). In addition, CD8+ T cell–mediated cytotoxic activity, evaluated by CD107 mobilization and Granzyme B secretion, against autologous CSCs could be elicited, although the TAA recognized by these T cells still need to be defined. Of note, this anti-CSC T cell–mediated activity correlated with the expression of MHC class II molecules by IFN-treated CSCs (Table 2). Notably, it was recently shown that CMV-specific CTLs could exert cytotoxic activity, showing consistent results with both CD107a and 51Cr-release assays, against CSC-like cells isolated from GBM (46). However, most TH2-mediated (detected by IL-5 release) responses against both CSCs and FBS tumor cells could be found in additional three GBM patients, and these CD4+ T cells were more efficient in recognizing FBS tumor cell than CSC (Table 6). Of note, an expansion and recruitment of CD4+CD56+ T cells subset with TH2 cytokine profile in tumor-infiltrating lymphocytes of GBM patients has been reported as a result of local tumor suppression of cell-mediated immune responses (47). Furthermore, we found that both CSCs and FBS tumor cells expressed immune response inhibitory molecules, such as CTLA-4, PD-1, and PDL-1, which could inhibit T-cell activation and proliferation following their encountering with GBM cells. The expression of B7 family members have been described in brain tumor cells, including their CSCs, with implications for the T cell–mediated immunesurveillance (48, 49). In addition, CTLA-4 blockade reversed glioma-induced changes to the T-cell compartment and enhanced antitumor immunity in an experimental brain tumor model (50).
Interestingly, we could show that CSC but not FBS cells inhibit allogeneic T-cell proliferation (Table 6). This suggests that CSCs can exert immunomodulating functions similarly to neural stem cells as shown by Kim et al. (51). Our results showed that this immune-inhibitory activity mediated by GBM CSCs was not dependent on the secretion of some immunosuppressive factors such as TGFβ-1 or TGFβ-2, which were preferentially downmodulated in CSC lines (Supplementary Fig. S6), or IL-10 and IL1-3, which was lacking in the supernatant of these cell lines (data not shown). Therefore, CSCs could secrete factors or express negative regulatory molecules that need to be identified and that could result in immunosuppressive effects on T-cell responses against GBM.
Our study represents the first detailed analysis of the immunologic features of GBM-derived CSCs and their autologous FBS tumor cells. Although we found a lack or weak expression of molecules involved in APM and antigen presentation on CSCs, immunogenicity of these cells could be rescued by either IFNs or demethylating agent treatment more efficiently in FBS than CSC cells. Interestingly, both GBM-derived CSCs and FBS tumor cells can elicit autologous antigen-specific T cell–mediated immune responses.
Our findings are supported by the results of two different groups showing that the CSCs isolated from GBM can represent a useful source of TAAs in dendritic cell (DC) vaccination–based immunotherapy, including human and mouse models (52, 53), suggesting that the usage of efficient APCs is needed to elicit anti-GBM CSC T cell–mediated immune responses.
Altogether, immunobiological differences between GBM CSC and autologous FBS tumor lines emerge for several phenotypic and functional aspects. A general explanation for such differences may lie in the less differentiated stage of CSC compared with the more differentiated FBS tumor cells as can be seen from differences in the expression of neural stemness–related markers (e.g., nestin, SOX2, and S100A4/A6). Such a lower differentiation stage of CSC appears to be associated with a weaker expression of molecules (MHC-I, NKG2D) that are crucial for T-cell and NK cell recognition of antigens and to a more accentuated immunosuppressive activity.
Both GBM CSC and FBS tumor cell lines homogeneously displayed, by confocal microscopy, high levels of the colorectal cancer–associated antigen COA-1 (24) and of survivin (Supplementary Fig. S7A and C, and B and D, respectively). Surprisingly, all these cells failed to express some of the known TAAs, such as gp100, MAGE, NY-ESO-1, and IL-13 receptor α2 previously described in GBM (data not shown; refs. 3, 6, 7), possibly resulting from immune escape and/or in vitro culture selection of these GBM cell subpopulations. Therefore, suggesting that survivin, COA-1 and SOX2 (see Supplementary Fig. S7 and Table 1) are candidate GBM CSC–associated target molecules recognizable by patient T cells because each of these antigens has been shown to contain epitopes recognized by T lymphocytes (5, 24, 28, 54).
Notably, the high throughput gene profile analysis showed that differentially expressed genes in CSC versus FBS tumor cells occurred and the further functional analysis of these results will contribute in dissecting the involvement of some of these gene products in CSC proliferation and/or therapeutic resistance as well as in determining whether they can represent candidate TAAs and targets for immunesurveillance. Of note, a recently published study showed that genomic and mRNA profiling of GBM CSCs allowed the identification of CSC-associated candidate molecules that can play a role in the pathogenesis of this tumor and in the clinical outcome of GBM patients (19).
Hitherto, our results have implications for immunotherapy of GBM patients and indicate the need to identify agents that can efficiently rescue the immunogenicity of CSCs to be targeted with immunobase therapeutc interventions.
Supplementary Material
Acknowledgments
We thank Drs. C. Lombardo and A. Falanga (Unit of Transfusion Medicine, Istituto Nazionale Tumori Foundation, Milan, Italy) for the HLA typing analysis of cancer patients and the Dr. G.C. Spagnoli Institute of Surgical Research and Hospital Management, University Hospital Basel, Switzerland for providing the anti-MAGE 57B and 6C1 mAbs.
Grant Support: Associazione Italiana per la Ricerca sul Cancro (Milan) grant (G. Parmiani) and Compagnia S. Paolo (CSP-2002.0735 and CSP-2005.0153), Oncology Research Programme, and Fondazione Cariplo grants (R. Galli) and PHS grants PO1 CA109688 (S. Ferrone), RO1 CA110249 (S. Ferrone) and RO1 CA113861 (S. Ferrone) awarded by the National Cancer Institute (S. Ferrone).
Footnotes
Note: Supplementary data for this article are available at Clinical Cancer Research Online (http://clincancerres.aacrjournals.org/).
S. Mazzoleni and R. Galli, unpublished data.
Disclosure of Potential Conflicts of Interest
No potential conflicts of interest were disclosed.
References
- 1.Behin A, Hoang-Xuan K, Carpentier AF, Delattre JY. Primary brain tumours in adults. Lancet. 2003;361:323–31. doi: 10.1016/S0140-6736(03)12328-8. [DOI] [PubMed] [Google Scholar]
- 2.Davis FG, Malmer BS, Aldape K, et al. Issues of diagnostic review in brain tumor studies: from the Brain Tumor Epidemiology Consortium. Cancer Epidemiol Biomarkers Prev. 2008;17:484–9. doi: 10.1158/1055-9965.EPI-07-0725. [DOI] [PubMed] [Google Scholar]
- 3.Zhang JG, Eguchi J, Kruse CA, et al. Antigenic profiling of glioma cells to generate allogeneic vaccines or dendritic cell-based therapeutics. Clin Cancer Res. 2007;13:566–75. doi: 10.1158/1078-0432.CCR-06-1576. [DOI] [PMC free article] [PubMed] [Google Scholar]
- 4.Saikali S, Avril T, Collet B, et al. Expression of nine antigens in a series of human glioblastoma multiforme: interest of EGFRvIII, IL-13Ra2, gp100 and TRP-2 for immunotherapy. J Neuroncol. 2007;81:139–48. doi: 10.1007/s11060-006-9220-3. [DOI] [PubMed] [Google Scholar]
- 5.Schmitz M, Temme A, Senner V, et al. Identification of SOX2 as a novel glioma-associated antigen and potential target for T cell-based immunotherapy. Br J Cancer. 2007;96:1293–301. doi: 10.1038/sj.bjc.6603696. [DOI] [PMC free article] [PubMed] [Google Scholar]
- 6.Yamanaka R, Itoh K. Cell and peptide-based immunotherapeutic approaches for glioma. Trends Mol Med. 2008;14:228–35. doi: 10.1016/j.molmed.2008.03.003. [DOI] [PubMed] [Google Scholar]
- 7.Okano F, Storkus WJ, Chambers WH, Pollack IF, Okada H. Identification of a novel HLA-A*0201-restricted, cytotoxic T lymphocyte epitope in a human glioma-associated antigen, interleukin 13 receptor α2 chain. Clin Cancer Res. 2002;8:2851–5. [PubMed] [Google Scholar]
- 8.Yu JS, Wheeler CJ, Zelter PM, et al. Vaccination of malignant glioma patients with peptide-pulsed dendritic cells elicits systemic cytotoxicity and intracranial T-cell infiltration. Cancer Res. 2001;61:842–7. [PubMed] [Google Scholar]
- 9.Parney IF, Hao C, Petruk KC. Glioma immunology and immunotherapy. Neurosurgery. 2000;46:778–91. doi: 10.1097/00006123-200004000-00002. [DOI] [PubMed] [Google Scholar]
- 10.Tang J, Flomenberg P, Harshyne L, Kenyon L, Andrews DA. Glioblastoma patients exhibit circulating tumor-specific CD8+ T cells. Clin Cancer Res. 2005;11:5292–9. doi: 10.1158/1078-0432.CCR-05-0545. [DOI] [PubMed] [Google Scholar]
- 11.Ueda R, Low KL, Zhu X, et al. Spontaneous responses against glioma-associated antigens in a long term survivor with malignant glioma. J Tansl Med. 2007;5:68–79. doi: 10.1186/1479-5876-5-68. [DOI] [PMC free article] [PubMed] [Google Scholar]
- 12.Liau LM, Prins RM, Kiertscher SM, et al. Dendritic cell vaccination in glioblastoma patients induces systemic and intracranial T-cell responses modulated by the local central nervous system tumor microenvironment. Clin Cancer Res. 2005;11:5515–25. doi: 10.1158/1078-0432.CCR-05-0464. [DOI] [PubMed] [Google Scholar]
- 13.Al-Hajj M. Cancer stem cells and oncology therapeutics. Curr Opin Ocol. 2007;19:61–4. doi: 10.1097/CCO.0b013e328011a8d6. [DOI] [PubMed] [Google Scholar]
- 14.Ricci-Vitiani L, Lombardi DG, Pilozzi E, et al. Identification and expansion of human colon-cancer-initiating cells. Nature. 2007;445:111–5. doi: 10.1038/nature05384. [DOI] [PubMed] [Google Scholar]
- 15.Li C, Heidt DG, Dalerba P, et al. Identification of Pancreatic Cancer Stem Cells. Cancer Res. 2007;67:1030–7. doi: 10.1158/0008-5472.CAN-06-2030. [DOI] [PubMed] [Google Scholar]
- 16.Singh SK, Clarke ID, Terasaki M, et al. Identification of a cancer stem cell in human brain tumors. Cancer Res. 2003;63:5821–8. [PubMed] [Google Scholar]
- 17.Galli R, Binda E, Orfanelli U, et al. Isolation and characterization of tumorigenic, stem-like neural precursors from human glioblastoma. Cancer Res. 2004;64:7011–21. doi: 10.1158/0008-5472.CAN-04-1364. [DOI] [PubMed] [Google Scholar]
- 18.Lee J, Kotiarova S, Kotliarov Y, et al. Tumor stem cells derived from glioblastomas cultured in bFGF and EGF more closely mirror the phenotype and genotype of primary tumors than do serum-cultured cell lines. Cancer Cell. 2006;9:391–403. doi: 10.1016/j.ccr.2006.03.030. [DOI] [PubMed] [Google Scholar]
- 19.Ernst A, Hofman S, Ahmadi R, et al. Genomic and Expression profiling of glioblastoma stem cell-like spheroid cultures identifies novel tumor-relevant genes associated with survival. Clin Cancer Res. 2009;15:6541–50. doi: 10.1158/1078-0432.CCR-09-0695. [DOI] [PubMed] [Google Scholar]
- 20.Reynolds BA, Rietze RL. Neural stem cells and neurospheres-reevaluating the relationship. Nat Methods. 2005;2:333–6. doi: 10.1038/nmeth758. [DOI] [PubMed] [Google Scholar]
- 21.Vescovi AL, Galli R, Reynolds BA. Brain tumour stem cells. Nat Rev Cancer. 2006;6:425–36. doi: 10.1038/nrc1889. [DOI] [PubMed] [Google Scholar]
- 22.Polyak K, Hahn WC. Roots and stems: stem cells in cancer. Nat Med. 2006;12:296–300. doi: 10.1038/nm1379. [DOI] [PubMed] [Google Scholar]
- 23.Tiercy JM, Djavad N, Rufer N, Speiser DE, Jeannet M, Roosnek E. Oligotyping of HLA-A2, -A3 and B44 subtypes. Detection of subtypes incompatibilities between patients and their serologically matched unrelated bone marrow donors. Hum Immunol. 1994;41:207–15. doi: 10.1016/0198-8859(94)90038-8. [DOI] [PubMed] [Google Scholar]
- 24.Maccalli C, Li YF, El-Gamil M, Rosenberg SA, Robbins PF. Identification of a colorectal tumor-associated antigen (COA-1) recognized by CD4(+) T lymphocytes. Cancer Res. 2003;63:6735–43. [PMC free article] [PubMed] [Google Scholar]
- 25.Ogino T, Wang X, Kato S, Miyokawa N, Harabuchi Y, Ferrone S. Endoplasmic reticulum chaperone-specific monoclonal antibodies for flow cytometry and immunohistochemical staining. Tissue Antigens. 2003;62:385–93. doi: 10.1034/j.1399-0039.2003.00114.x. [DOI] [PubMed] [Google Scholar]
- 26.Bandoh N, Ogino T, Cho HS, et al. Development and characterization of human constitutive proteasome and immunoproteasome subunit-specific monoclonal antibodies. Tissue Antigens. 2005;66:185–94. doi: 10.1111/j.1399-0039.2005.00462.x. [DOI] [PubMed] [Google Scholar]
- 27.Maccalli C, Nonaka D, Piris A, et al. NKG2D-mediated antitumor activity by tumor-infiltrating lymphocytes and antigen-specific T-cell clones isolated from melanoma patients. Clin Cancer Res. 2007;13:7459–68. doi: 10.1158/1078-0432.CCR-07-1166. [DOI] [PubMed] [Google Scholar]
- 28.Maccalli C, Di Cristanziano V, Fodale V, et al. Induction of both CD8+ and CD4+ T-cell mediated responses in colorectal cancer patients by colon antigen-1. Clin Cancer Res. 2008;14:7292–303. doi: 10.1158/1078-0432.CCR-08-0832. [DOI] [PubMed] [Google Scholar]
- 29.Wang E, Miller LD, Ohnmacht GA, Liu ET, Marincola FM. High fidelity mRNA amplification for gene profiling. Nat Biotechnol. 2000;18:457–9. doi: 10.1038/74546. [DOI] [PubMed] [Google Scholar]
- 30.Wang E. RNA amplification for successful gene profiling analysis. J Transl Med. 2005;3:28–39. doi: 10.1186/1479-5876-3-28. [DOI] [PMC free article] [PubMed] [Google Scholar]
- 31.Eisen MB, Spellman PT, Brown PO, Botsein D. Cluster analysis and display of genome-wide expression patterns. Proc Natl Acad Sci U S A. 1998;95:1483–8. doi: 10.1073/pnas.95.25.14863. [DOI] [PMC free article] [PubMed] [Google Scholar]
- 32.Dennis G, Jr, Sherman BT, Hosack DA, et al. DAVID: database for annotation, visualization and integrated discovery. Genome Biol. 2003;4:3–7. [PubMed] [Google Scholar]
- 33.Amendola M, Venneri MA, Biffi A, Vigna E, Naldini L. Coordinate dual-gene transgenesis by lentiviral vectors carrying synthetic bidirectional promoters. Nat Biotech. 2004;23:108–16. doi: 10.1038/nbt1049. [DOI] [PubMed] [Google Scholar]
- 34.Aktas E, Kucuksezer UC, Bilgic S, Erten G, Deniz G. Relationship between CD107a expression and cytotoxic activity. Cell Immunol. 2009;254:149–54. doi: 10.1016/j.cellimm.2008.08.007. [DOI] [PubMed] [Google Scholar]
- 35.Zaritskaya L, Shafer-Weaver KA, Gregory MK, Stobl SL, Baseler M, Malyguine A. Application of a flow cytometric cytotoxicity assay for monitoring cancer vaccine trials. J Immunother. 2009;32:186–94. doi: 10.1097/CJI.0b013e318197b1b2. [DOI] [PubMed] [Google Scholar]
- 36.Shafer-Weaver K, Rosenberg S, Stobl S, Gregory AW, Baseler M, Malyguine A. Application of the granzyme B ELISPOT assay for monitoring cancer vaccine trials. J Immunother. 2006;29:328–35. doi: 10.1097/01.cji.0000203079.35612.c8. [DOI] [PubMed] [Google Scholar]
- 37.Graner MW, Alzate O, Dechkovskaia AM, et al. Proteomic and immunologic analyses of brain tumor exosomes. FASEB J. 2009;23:1541–57. doi: 10.1096/fj.08-122184. [DOI] [PMC free article] [PubMed] [Google Scholar]
- 38.Atkinson GP, Nozell SE, Harrison DK, Stonecypher MS, Chen D, Benveniste EN. The prolyl isomerase Pin1 regulates the NF-kB signaling pathway and interleukin-8 expression in glioblastoma. Oncogene. 2009;28:3735–45. doi: 10.1038/onc.2009.232. [DOI] [PMC free article] [PubMed] [Google Scholar]
- 39.Bromberg JF. Stat proteins and oncogenesis. J Clin Invest. 2002;109:1139–42. doi: 10.1172/JCI15617. [DOI] [PMC free article] [PubMed] [Google Scholar]
- 40.Brantley EC, Burton L, Nabors G, et al. Loss of protein inhibitors of activated STAT-3 expression in glioblastoma multiforme tumors: implications for STAT-3 activation and gene expression. Clin Cancer Res. 2008;14:4694–704. doi: 10.1158/1078-0432.CCR-08-0618. [DOI] [PMC free article] [PubMed] [Google Scholar]
- 41.Pandha A, Rigg A, Jhon J, Lemoine N. Loss of expression of antigen-presenting molecules in human pancreatic cancer and pancreatic cell lines. Clin Exp Immmunol. 2007;148:127–35. doi: 10.1111/j.1365-2249.2006.03289.x. [DOI] [PMC free article] [PubMed] [Google Scholar]
- 42.Johnsen A, France J, Sy MS, Harding CV. Down-regulation of the transporter for antigen presentation, proteasome subunits, and class I major histocompatibility complex tumor cell lines. Cancer Res. 1998;58:3660–7. [PubMed] [Google Scholar]
- 43.Mendez R, Aptsiauri N, Del Campo A, et al. HLA and melanoma: multiple alterations in HLA class I and II expression in human melanoma cell lines from ESTDAB cell bank. Cancer Immunol Immunother. 2009;58:1507–15. doi: 10.1007/s00262-009-0701-z. [DOI] [PMC free article] [PubMed] [Google Scholar]
- 44.Wu A, Wiesner S, Xiao J, et al. Expression of MHC I and NK ligands on human CD133+ glioma cells: possible targets of immunotherapy. J Neurooncol. 2007;83:121–31. doi: 10.1007/s11060-006-9265-3. [DOI] [PubMed] [Google Scholar]
- 45.Vlashi E, Kim K, Lagadec C, et al. In vivo imaging, tracking, and targeting of cancer stem cells. J Natl Cancer Inst. 2009;101:350–9. doi: 10.1093/jnci/djn509. [DOI] [PMC free article] [PubMed] [Google Scholar]
- 46.Brown CE, Starr R, Martinez C, et al. Recognition and killing of brain tumor stem-like initiating cells by CD8+ cytolytic T cells. Cancer Res. 2009;69:8886–93. doi: 10.1158/0008-5472.CAN-09-2687. [DOI] [PMC free article] [PubMed] [Google Scholar]
- 47.Waziri A, Killory B, Ogden AT, III, et al. Preferential in situ CD4+CD56+ T cell activation and expansion within human glioblastoma. J Immunol. 2008;180:7673–80. doi: 10.4049/jimmunol.180.11.7673. [DOI] [PubMed] [Google Scholar]
- 48.Parsa AT, Waldron JS, Panner A, et al. Loss of tumor suppressor PTEN function increases B7-1 expression and immunoresistance in glioma. Nat Med. 2007;13:84–8. doi: 10.1038/nm1517. [DOI] [PubMed] [Google Scholar]
- 49.Yao Y, Wang X, Jin K, et al. B7-4 is preferentially expressed in non-dividing brain tumor cells and in a subset of brain tumor stem-like cells. J Neurocol. 2008;89:121–9. doi: 10.1007/s11060-008-9601-x. [DOI] [PubMed] [Google Scholar]
- 50.Fecci PE, Ochiai H, Mitchell DA, et al. Systemic CTLA-4 blockade ameliorates glioma-induced changes to the CD4+ T cell compartment without affecting regulatory T-cell function. Clin Cancer Res. 2007;13:2158–67. doi: 10.1158/1078-0432.CCR-06-2070. [DOI] [PubMed] [Google Scholar]
- 51.Kim SY, Cho HS, Yang SH, et al. Soluble mediators from human neural stem cells play a critical role in suppression of T-cell activation and proliferation. J Neurosc Res. 2009;87:2264–72. doi: 10.1002/jnr.22050. [DOI] [PubMed] [Google Scholar]
- 52.Pellegatta S, Poliani PL, Corno D, et al. Neurospheres enriched in cancer stem-like cells are highly effective in eliciting a dendritic cell-mediated immune response against malignant gliomas. Cancer Res. 2006;66:10247–52. doi: 10.1158/0008-5472.CAN-06-2048. [DOI] [PubMed] [Google Scholar]
- 53.Xu Q, Liu G, Yuan X, et al. Antigen-specific T cell response from dendritic cell vaccination using cancer stem-like cell associated antigen. Stem Cells. 2009;27:1734–40. doi: 10.1002/stem.102. [DOI] [PMC free article] [PubMed] [Google Scholar]
- 54.Andersen MH, Pedersen LO, Capeller B, Bröcker EB, Becker JC, thor Straten P. Spontaneous cytotoxic T-cell responses against survivin-derived MHC class I-restricted T-cell epitopes in situ as well as ex vivo in cancer patients. Cancer Res. 2001;61:5964–8. [PubMed] [Google Scholar]
Associated Data
This section collects any data citations, data availability statements, or supplementary materials included in this article.