

Abstract
In order to explore neural activity that accompanies cognitive bias in mood disorders, clinically depressed and non-depressed controls completed a self-evaluation procedure in which they indicated whether trait words were self-descriptive or not. Dense array (256-channel) electroencephalography (EEG) was recorded. Greater depression and low Positive Affect were associated with decreased endorsement of favorable (Good) traits, and greater anxiety and high Negative Affect with increased endorsement of unfavorable (Bad) traits. For controls, the event related potential (ERP) showed an enhanced visual N1 for trials in which Bad traits were endorsed. For depressed participants, this N1 was attenuated, specifically for these endorsed-Bad trials. A similar pattern was observed in the medial frontal P2-MFN complex, with controls showing an enhanced medial-frontal negativity to the endorsed Bad words, while depressed participants showed an attenuated or absent medial-frontal response on these items specifically. Distributed linear-inverse source analysis of the ERP localized the N1 effect to inferotemporal-occipital cortex, and the medial-frontal effect to dorsal anterior cingulate cortex. The altered ERP responses in depressed participants may provide clues to the neurophysiological processes associated with negatively biased cognition and self-evaluation in clinical depression.
Keywords: depression, anxiety, self-evaluation, limbic system, affective cognition
A basic issue in research on mood disorders is how mood may constrain cognition. It is well recognized that depressed people perceive the world negatively, but that negative cognitive bias is primarily apparent only while the person is in the depressed state (Lewinsohn, Steinmetz, Larson, & Franklin, 1981). Negative bias can be manifested either as a bias toward negative expectancies, or a bias away from positive expectancies. As measured by the Positive and Negative Affect Schedule (PANAS; Tellegen, 1985; Watson & Tellegen, 1985), the general theoretical model is that high negative affect, most strongly associated with anxiety, biases attention toward negative expectancies, whereas low positive affect, most strongly associated with anhedonic aspects of depression, biases attention away from positive expectancies (Tucker & Luu, 2007). The observation that pharmacotherapy may be as effective as cognitive therapy in short-term reversal of both depressive mood and negative cognitive bias (Curry et al., 2006; A. D. Simons, Garfield, & Murphy, 1984) provides evidence for a possible neural basis of mood constraint on psychological expectancy. Cognitive psychology has traditionally emphasized thought and behavior as guided by cognitive appraisals, rather than affective states. However, cognitive neuroscience research is providing new theoretical insight into the integral role of affect and mood in shaping the cognitive process, both in everyday cognition and in cognitive therapy (Tucker & Luu, 2007).
The neural circuits implicated in mood states engage multiple levels of the neuraxis, including brainstem arousal systems, limbic emotional networks, and neocortical networks for cognitive representation (Tucker, Derryberry, & Luu, 2000). Integration of these multiple levels may depend on control exerted by the frontal lobe (Flor-Henry, 1979; Nauta, 1971, 1972) involving both ventrolateral (extended amygdala and orbital) and mediodorsal (extended anterior cingulate cortex) frontolimbic pathways (Pandya & Yeterian, 1996; Phillips, Drevets, Rauch, & Lane, 2003a). Chronic dysregulation of these frontolimbic pathways in emotional disorders may constrain experience, cognition, and behavior (Phillips, Drevets, Rauch, & Lane, 2003b). Exaggerated resting-state activity in the anterior cingulate cortex (ACC) has been observed in depression (Mayberg et al., 1999) and in normal induced sad mood (Liotti et al., 2000).
These frontolimbic regions have also been implicated in the dynamic self-regulation of cognition and emotion and its dysfunction in psychopathology. Using dense array EEG, Pizzagalli and colleagues (Pizzagalli, Peccoralo, Davidson, & Cohen, 2006) found that, for non-depressed participants, greater resting gamma (~ 40 Hz) activity in the rostroventral ACC predicted improved adjustment of performance following errors; for depressed participants the reversed relation approached significance (greater ACC gamma predicted worse error correction). Consistent with a dysfunction in the frontolimbic networks regulating self-monitoring, the depressed participants were poor in error correction overall, although they were not impaired in other aspects of task performance. Tucker and colleagues (Tucker, Luu, Frishkoff, Quiring, & Poulsen, 2003) examined the dynamics of frontolimbic activity during cognitive appraisal using a task in which feedback on performance varied from positive to negative. In response to negative feedback (an “F” grade on performance), non-depressed participants showed an enhanced medial frontal negativity (MFN), not unlike the error-related negativity (ERN) that accompanies errors in performance (Luu, Tucker, Derryberry, Reed, & Poulsen, 2003; see also Falkenstein, Hoormann, Christ & Hohnsbein, 2000; Gehring, Goss, Coles, Meyer, & Donchin, 1993). This MFN to negative feedback was significantly stronger overall in depressed participants than non-depressed controls. Importantly, however, when individual responses were examined in relation to depressive symptomatology, the more severely depressed participants showed a reduction of the MFN to negative feedback in comparison to those who were mildly depressed. Neural source analysis localized this scalp-measured emotional response to anterior temporal and insular regions, as well as the ACC, consistent with neuroimaging literature on the dysregulation of these regions in depression.
In clinical depression, the negative bias in cognitive appraisal is often most marked in self-evaluation. To characterize the neural correlates of normal self-evaluation, Tucker, Luu, Desmond et al. (2003) asked participants to rate whether trait words were self-descriptive or not. Consistent with findings related to negative feedback (Tucker, Luu, Frishkoff et al., 2003), a greater MFN was observed at about 300 ms to bad (socially undesirable) than to good (socially desirable) trait words. Shortly after, this effect was further differentiated by the participant’s endorsement; that is, greater MFN was associated with negative self-appraisal (i.e., the endorsement of bad words and rejection of good words) than with positive self-appraisal. These effects were source-localized to the ACC and mid-cingulate cortex, respectively. A main effect of endorsement, which localized to the medial frontal pole (BA10), also obtained at about 450 ms. Here, endorsed (self-relevant) words were associated with greater positivity than unendorsed words. These findings suggest that electrical activity in frontolimbic networks may reflect the dynamics of self-evaluation, integrating both affective and cognitive components of the decision process. Moran and colleagues (Moran, Macrae, Heatherton, Wyland, & Kelley, 2006) obtained a comparable pattern of results employing a similar paradigm with functional magnetic resonance imaging (fMRI). In that study, the ACC (along with lateral frontal regions and the supplementary motor area) was sensitive to both valence and endorsement (self-relevance), with the dorsal ACC showing greater positive BOLD response to negative appraisal categories, and the ventral ACC showing a greater negative BOLD (‘deactivation’) response to endorsed bad words (both results were in contrast to baseline activity measured during presentation of a fixation cross). The medial prefrontal cortex (BA 10), along with posterior cingulate cortex, was sensitive to self-relevance, with endorsed words showing less deactivation relative to baseline than unendorsed words.
Both of the aforementioned studies examined the brain response to self-evaluation in non-depressed individuals, using dense array EEG (Tucker, Luu, Desmond et al., 2003) and fMRI (Moran et al., 2006), respectively. In the present research, the dense array EEG measures were extended to examine self-evaluation in a community sample of clinically depressed persons, contrasted with matched controls. As is typical for community samples, many depressed persons reported high anxiety as well. It was hypothesized that the negative cognitive bias in depression would be accompanied by altered frontolimbic responses reflecting their expectancies for negative outcomes. Enhanced MFNs have been observed when predictions are violated (Chung et al., 1996; Tucker, Hartry-Speiser, McDougal, Luu, & deGrandpre, 1999; Tucker & Luu, 2007). For non-depressed persons with a positive self-appraisal bias, a negative self-appraisal is an unexpected event and is associated with a greater MFN (Tucker, Luu, Desmond, et al., 2003). However, for depressed persons who do not have this positive self-appraisal bias, these negative appraisal events are not unexpected, and therefore should produce a smaller MFN. Finally, in addition to the MFN, the ERP was examined for two other ERP components: the N1 response, a negative peak associated with visual processing and attention, and the P3/late positive complex, associated with memory updating.
METHOD
Participants
A total of 152 participants were recruited from the Eugene and Springfield, Oregon, communities. Participants completed standardized self-administered symptom reports of depression at the time of the experiment, including the Beck Depression Inventory (BDI) and Hamilton Depression Inventory (HDI). Depressed participants were identified by the presence and severity of their depressed symptoms as indicated in these self-report measures. Depressed participants met at least 5 of the 9 symptom criteria for a DSM-IV diagnosis of primary, nonpsychotic, major depressive disorder, and had a Beck Depression Inventory (BDI) score of 14 or greater (range = 14 to 40, M = 21.4, SD = 7.8) at the time of the experiment. As assessed by self-report questionnaire, exclusion criteria were the presence of schizophrenia or schizoaffective disorder. Self-report of bipolar disorder (depressive phase; 5 participants) or secondary anxiety disorders (11 participants) were not excluded, but were classified for separate analysis. Additional exclusion criteria were active substance abuse or dependence, open head wounds (which present an infection risk), and the presence of concurrent medical disorders that could cause depression (e.g., epilepsy, history of head trauma). Four depressed participants were currently taking medication (Escitalopram, Bupropion, Lamictal, Propanolol, and Lorazepam) for the treatment of depression or anxiety. These participants were not excluded, but their medications were recorded. After exclusion of one depressed participant (reported diagnosis of schizophrenia), 39 depressed participants (19 male, 32 right handed, mean age = 25.5 years, mean education = 14.6 years) were retained for analysis.
Non-depressed, control participants were matched with participants in the depressed sample in terms of sex, age, and education level. Control participants fell within 5 years in terms of age, and within 2 years in terms of education level. Control participants had a BDI score of 13 or less (range = 0 to 13, M = 6.0, SD = 3.4) at the time of the experiment. Non-depressed participants who had recovered from reported prior episodes of depression (12 participants) were not excluded from the control group. Asymptomatic participants who were currently taking antidepressant medications, however, were excluded, as were control participants with a history of bipolar disorder All other exclusion criteria were otherwise identical to the depressed sample. A total of fifteen control participants were excluded due to a history of head trauma (1), schizophrenia or episodes of hallucination (3), bipolar disorder (3), current depression medication (5), incomplete data (1), or technical difficulties during testing (2). The remaining 97 control participants (41 male, 88 right handed, mean age = 24.2 years, mean education = 15.4 years) were retained for analysis.
All participants gave informed consent prior to participation and received $30 in remuneration. The study was approved by the institutional review boards at Electrical Geodesics, Inc., and the University of Oregon.
Materials
Questionnaires
Participants completed five questionnaires prior to the experimental task. These were the 1) Oregon Self Concept Inventory (OSCI-2; Tucker, Luu, Desmond et al., 2003), 2) Positive and Negative Affect Scale (PANAS-X; Watson & Clark, 1994), 3) Beck Anxiety Inventory (BAI-R; Beck, Epstein, Brown, & Steer, 1988), 4) Beck Depression Inventory (BDI-2-R; Beck, Steer, & Garbin, 1988), and 5) Hamilton Depression Inventory (HDI; Reynolds & Kobak, 1995a, 1995b; Dozois, 2003). The HDI and BDI served to assess depression; the PANAS, BAI, and BDI were further employed in psychometric data analyses.
Stimuli
Stimuli for the experimental task consisted of 209 trait descriptor words drawn primarily from a subset of the Oregon Self-Concept Inventory-2 (OSCI-2) word list (Tucker, Luu, Desmond et al., 2003), and supplemented by additional words from the Big Five inventory (Goldberg, 1992). The OSCI-2 is a list of 192 positive and negative trait descriptor words rated by young adults in a separate norming study for high comprehensibility and social desirability (greater than 3.5 and less than 1.75 for positive and negative words, respectively, on a scale from 1 = very undesirable, to 5 = very desirable). Stimulus words were presented in black on a white computer screen. From the total of 209 trait words, responses to a subset of 81 “good” trait words (i.e., high social desirability; e.g., brave) and 78 “bad” trait words (i.e., low social desirability; e.g., sulky) were selected for the present report. The remaining 50 words tapped other aspects of personality and were excluded from the present analysis.
Procedure
After completion of the questionnaire booklet, participants were fitted with a 256-channel HydroCel Geodesic Sensor Net for EEG recording and seated in front of a computer monitor. A chin rest was used to maintain a fixed distance from the monitor and minimize head movement. As each word was displayed, participants were asked to indicate yes or no, with a left or right button response and as quickly as possible, whether the word applied to them. Hand of response was counterbalanced across participants. Stimulus presentation was controlled by E-Prime Software, Version 1.2.1.795, (Psychology Software Tools, Inc., Pittsburgh, PA) and synchronized with EEG acquisition via the E-Prime Extension for Net Station. Each trial lasted 3.5 seconds. Trials began with a central fixation point (“+”) for 2,000 ms, followed by the word for 500 ms, and then a blank screen for an additional 1000 ms to allow for a response. A practice block of 10 trials allowed the participant to become accustomed to the pace of the experiment. Stimuli were then presented across four blocks of 53, 52, 52, and 52 trials each. Each block lasted approximately three minutes. Participants were allowed to rest between blocks. The total session, including questionnaire completion, EEG set up, and debriefing, lasted approximately two hours.
EEG Recording and Preprocessing
The EEG was acquired using a 256-channel HydroCel Geodesic Sensor Net, Net Amps 200 amplifier, and Net Station, Version 4.2, software (Electrical Geodesics, Inc., Eugene, OR). Electrode impedances were maintained below 70 kΩ (Ferree, Luu, Russell, & Tucker, 2001). All channels were referenced to Cz during acquisition. The EEG was recorded with a 0.1 Hz to 100 Hz band-pass filter (3 dB attenuation), amplified at a gain of 1000, sampled at a rate of 250 Hz, and digitized with a 16-bit A/D converter.
After acquisition, the continuous EEG was filtered with a 30-Hz lowpass filter, segmented into 1000-ms stimulus-locked epochs from 100 ms prestimulus to 900 ms poststimulus. Epochs contaminated with eye or movement artifact, as identified by computerized algorithm and verified by visual inspection, were eliminated, and individual bad channels were replaced on a segment-by-segment basis with spherical spline interpolation. Individual ERP averages were computed for each of four experimental categories: endorsed good words (YesGood), endorsed bad words (YesBad), unendorsed good words (NoGood), and unendorsed bad words (NoBad). The averaged ERPs were re-referenced to an average reference, using the PARE correction to estimate the zero surface potential integral (Junghofer, Elbert, Tucker, & Braun, 1999), and adjusted to a 100-ms prestimulus baseline. Participants contributing fewer than 10 trials per category average after artifact rejection were eliminated from subsequent ERP analyses.
Source Analysis
Estimated neural sources of the scalp ERP effects were computed using the distributed linear inverse minimum norm method with LAURA (local autoregressive average) constraints (Grave de Peralta Menendez, Murray, Michel, Martuzzi, & Gonzalez Andino, 2004). The LAURA solution was implemented using GeoSource, Version 1.0, electrical source imaging software (Electrical Geodesics, Inc., Eugene, OR). The forward model within GeoSource applies a finite difference model (FDM) for accurate computation of the lead field in relation to head tissues. The head model for the FDM requires a high-resolution T1-weighted MRI image and whole-head CT scan for tissue segmentation. Tissue compartments for the default FDM used in this study were constructed from the Colin27 MRI average (Holmes et al., 1998) and a whole-head CT scan of this same individual, whose Talairach-transformed head closely matches the Montreal Neurological Institute average MRI (MNI305). Conductivity values used in the FDM model were: 0.25 S/m (Siemens/meter) for brain, 1.8 S/m for cerebral spinal fluid, 0.018 S/m for skull, and 0.44 S/m for scalp (see Ferree, Eriksen, & Tucker, 2000). Placement of the distributed dipoles was based on the probabilistic map of the MNI305 average brain. Cortical gray matter of this probabilistic atlas was parceled into 7 mm voxels, each serving as a dipole source location with three orthogonal orientations. This resulted in a total of 2,447 source dipole triplets.
The resulting estimated source activation voxel intensities and orientations were displayed superimposed on MRI slice views of the Talairach-transformed Colin27 brain. Source regions corresponding to the scalp ERP effects were identified through visual inspection of these source activation maps. The time courses of the combined root mean square (RMS) magnitude of the three vector orientations for each of these dipole regions per condition per participant were then computed. This yielded, within each identified source region, an RMS source waveform indicating changes in current source magnitude over time.
Statistical Analysis Strategy
The statistical analysis began with behavioral data, specifically with analysis of endorsement frequency and reaction time. These analyses examined the hypothesis of dimensional-specific mood bias on cognition; specifically, that Positive Affect would predict endorsement of favorable (good) traits and Negative Affect would predict endorsement of unfavorable (bad) traits, and that these dimensional mood effects would be similar for non-depressed and clinically depressed participants.
A-priori hypotheses on the evaluative functions of medial brain regions were examined in analyses of the medial frontal P2-MFN complex (150 to 400 ms), and the centroparietal P3/late positive complex (300 to 600 ms). In addition, initial examination of the scalp data showed that depressed participants had attenuated ERP responses for several components (particularly the right-lateralized N1 and P3/LPC, as described below). Consequently, statistical analysis of the N1 amplitude was also conducted to assess these observed patterns quantitatively.
Time windows and electrode groups were based on typical latencies and scalp regions associated with the ERP components. These windows and regions were then fine-tuned through visual inspection of the grand-average scalp topographies in order to capture accurately the time and location of maximal amplitude for each ERP component (see Figure 1 for electrode groups). The medial frontal P2-MFN complex was examined with a peak-to-peak MFN-P2 amplitude difference measure. This approach treats these peaks as a complex, and at the same time helps to control for possible medial-frontal contingent negative variation (CNV) release differences between conditions. For ease of reading, the resulting measure is henceforth simply referred to as the MFN (as referenced to the preceding P2 peak). Individual P2 and MFN peaks were identified for each participant across an average of eight electrode sites in the mediofrontal scalp region within windows surrounding the grand-average P2 (positive peak between 131 and 291 ms) and MFN (negative peak between 260 and 480 ms). For each participant and condition, the mean amplitudes of the P2 and MFN peaks +/− 20 ms were computed, and the amplitude difference between these two peaks served as the dependent variable. Given the very slow nature of the P3/LPC wave and the absence of a single, clearly identifiable peak, individual P3/LPC amplitude values were computed for all participants as the mean amplitude from 300–600 ms across 13 electrodes in the centroparietal scalp region. Finally, individual N1 peaks were identified in a window from 120 – 250 ms over left and right lateral inferior occipitotemporal regions where the N1 was maximal in the grand average (note that this captured the known asymmetry between left and right temporal lobes, with the left focal region slightly posterior to the right; see Figure 1). The mean amplitude at each individual N1 peak +/− 20 ms was computed. Group (Depressed, Control) x Endorsement (Yes, No) x Valence (Good, Bad) between-within ANOVAs were conducted on all measures. Interactions were followed up with post-hoc, independent or paired t-tests. Significance was set at p < 0.05 for all analyses, with post-hoc t-tests adjusted for multiple comparisons where appropriate.
Figure 1.

Topographic plot of 256-channel waveforms from −100 to 900 ms, average-referenced, grand-averaged for depressed and control participants, collapsed over endorsement and valence conditions. Anterior to posterior sites displayed from top to bottom of figure. Channel groupings used to compute scalp event-related-potential measures are indicated in color: left and right N1 (blue), P2-MFN complex (red), and P3/late positive complex (green).
Scalp effects were followed up with exploratory statistical analysis of current source magnitudes in relevant source regions identified by the linear inverse source analysis. Higher background EEG ‘noise’ (in particular, alpha contamination) in the low trial-count condition averages (NoGood and YesBad) resulted in spuriously higher RMS magnitude values in these two conditions versus the higher trial-count conditions (YesGood and NoBad). To control for this confound, a mean correction was applied prior to statistical analysis of all source data. Specifically, post-stimulus RMS magnitudes in each condition were computed relative to their mean baseline (−100 to 0 ms) RMS magnitudes. Peak-to-peak measurement of the P2-MFN complex was not possible in source space because current source densities do not have negative amplitude. Consequently, separate measures for the P2 and MFN windows were computed. For the adaptive peaks (P2, MFN, and N1), mean RMS current source magnitudes were computed within a relatively broad window (+/− 50 ms) of the individual scalp peaks in order to capture the full extent of the onset and offset of these ERP components in source space. For the P3/LPC, mean current source magnitude was computed from 300 to 600 ms.
RESULTS
Behavioral Data Analyses
In addition to higher BDI scores in the depressed versus non-depressed participants (see Participants), t = 13.4, p1-tail < 0.001, depressed participants scored significantly lower than non-depressed on positive affect (PA; M = 32.5, SD = 6.4 vs. M = 36.0, SD = 5.2, respectively), t = −3.3, p1-tail = 0.001, and higher on negative affect (NA; M = 25.3, SD = 7.4 vs. M = 19.4, SD = 5.6, respectively), t = 4.5, p1-tail < 0.001, and anxiety (BAI; M = 17.1, SD = 8.2 vs. M = 7.8, SD = 5.1, respectively), t = 6.6, p1-tail < 0.001). The incidence of anxiety among the depressed was high, with 19/39 depressed participants also scoring greater than 15 (at least moderate anxiety) on the BAI (Beck & Steer, 1990). Anxiety was proportionally much lower among the control participants, with only 13/97 scoring greater than 15 on the BAI. BDI scores correlated negatively with positive affect, and positively with negative affect and anxiety (see Table 1).
Table 1.
Pearson correlation matrix for proportion of endorsed good and bad words, and psychometric measures for control and depressed participants (N = 136).
| Measure1 | BDI | PA | NA | BAI | YesGood_Prop |
|---|---|---|---|---|---|
| BDI Score | |||||
| PA | −0.342** | ||||
| NA | 0.549** | −0.152 | |||
| BAI | 0.673** | −0.136 | 0.552** | ||
| YesGood_Prop | −0.410** | 0.548** | −0.286** | −0.276** | |
| YesBad_Prop | 0.505** | −0.177* | 0.523** | 0.393** | −0.250** |
BDI: Beck Depression Inventory; PA: positive affect score; NA: negative affect score; BAI: Beck Anxiety Inventory; YesGood_Prop: Proportion of endorsed good words; YesBad_Prop: Proportion of endorsed bad words.
Correlation is significant at the 0.01 level (2-tailed).
Correlation is significant at the 0.05 level (2-tailed).
Depressed and non-depressed participants also differed on proportion of good and bad trait words endorsed. A Group x Valence mixed ANOVA indicated a Group x Valence interaction, F(1, 134) = 40.8, p < 0.001. Specifically, depressed participants endorsed more bad trait words (M = 0.42, SD = 0.20), t(134) = 5.7, p1-tail < 0.001, and fewer good trait words (M = 0.68, SD = 0.18), t(134) = −3.5, p1-tail < 0.001, than did control participants (M = 0.23 and 0.79 and SD = 0.16 and 0.15, respectively).
Pearson correlation analyses revealed predicted relationships between psychometric measures and the proportion of good and bad items endorsed. As shown in Table 1, the proportion of good words endorsed correlated most strongly with PA, and had moderate negative correlations with BDI, NA, and BAI. In a stepwise multiple regression with BDI, PA, NA, and BAI as predictors of the proportion of good words endorsed, only PA and BDI were retained as predictors in the model, with standardized (beta) coefficients of 0.548 and −0.252, respectively, F(2, 133) = 36.9, p < 0.001. PA alone accounted for 30% of the variance in good items endorsed, with BDI increasing the proportion to 36%, ΔR2 = .056, F(1, 133) = 11.6, p = 0.001. In contrast to good words, the proportion of bad words endorsed had strong positive correlations with BDI, NA, and BAI, and only a small, though significant, negative correlation with PA. Stepwise multiple regression with BDI, PA, NA, and BAI as predictors of the proportion of bad words endorsed identified NA followed by BDI as significant unique predictors, with beta coefficients of 0.351 and 0.312, respectively, F(2, 133) = 34.4, p < 0.001. NA alone accounted for 27% of the variance in bad items endorsed, with BDI increasing the proportion to 34%, ΔR2 = .068, F(1, 133) = 13.7, p < 0.001.
Participants were retained for RT statistical analyses if they had a minimum of 15 trials per Endorsement x Valence category. Of the 97 control participants, all met this criterion for NoBad and YesGood cells (both positive appraisals), but only 52% had a minimum of 15 trials for YesBad (51/97) or NoGood (49/97) cells (both negative appraisals). Thus, many control participants, specifically those with the fewest negative self-appraisals, could not be included in the RT analyses. Of the 39 depressed participants, 95% (37/39) and 100% (39/39) met the criterion for positive appraisal cells (NoBad and YesGood, respectively), but many more than in the control group met this minimum for the negative appraisal categories; specifically, 87% (34/39) for YesBad, and 74% (29/39) for NoGood. In summary, from the sample of 136 participants retained for Endorsement analysis, 28 control (13 male, 27 right-handed, mean age = 23.2 years, mean education = 15.4 years) and 24 depressed (12 male, 21 right-handed, mean age = 25.8 years, mean education = 14.6 years) participants had a sufficient number of trials per category for use in the RT statistical analyses. Despite the disproportionate loss of highly positive non-depressed participants, group differences on the Beck Depression Inventory remained large (M = 23.4 vs. 7.4) and significant, t(50) = 9.8, p1-tail < 0.001. Differences on the other psychometric measures also remained significant (BAI, p1-tail < 0.001; NA, p1-tail = 0.019; PA, p1-tail = 0.011). As expected from the trial count balancing adjustment, however, the group differences in the proportion of endorsed good and bad words obtained in the full sample were no longer significant in the reduced sample of 52 participants, t(50) = −1.6, p1-tail = 0.058, and t(50) = 1.2, p1-tail = 0.12, respectively.
A Group x Valence x Endorsement between-within ANOVA conducted on RTs indicated main effects for Group, F(1, 50) = 8.73, p = 0.005, and Endorsement, F(1, 50) = 16.2, p < 0.001, and a Valence x Endorsement interaction, F(1, 50) = 22.6, p < 0.001. Depressed participants were overall slower to respond (M = 871 ms, SD = 110 ms) than control participants (M = 734 ms, SD = 203 ms). In addition, paired t-tests revealed that participants overall were faster to reject bad words (M = 794 ms, SD = 175 ms) than good words (M = 830 ms, SD = 204 ms), t(51) = −3.7, p < 0.001, and fastest overall to endorse good words (M = 757 ms, SD = 171 ms), t(51) = −4.7, p < 0.001.
EEG Data Analyses
From the sample of 52 participants retained for RT analysis, a total of 26 participants had a sufficient number of segments per category after rejection of artifact-contaminated trials for use in the EEG statistical analyses. Specifically, 13 depressed participants (7 male, 11 right-handed, mean age = 26.6 years, mean education = 15.4 years), and 13 control participants (9 male, 12 right-handed, mean age = 23.7, mean education = 15.2 years) were included in the EEG analyses. The number of retained trials by category was similar for both groups. For the depressed group these were: NoBad, M = 32, SD = 10; NoGood, M = 23, SD = 11; YesBad, M = 23, SD = 8; YesGood, M = 33, SD = 14. For the control group these were: NoBad, M = 41, SD = 13; NoGood, M = 22, SD = 11; YesBad, M = 22, SD = 8; YesGood, M = 43, SD = 12. Only the between-group difference in the number of retained YesGood trials reached significance, t(24) = 2.15, p = 0.04. These trial-count differences were not considered large enough to affect measurement of the ERP components of interest.
As in the RT sample, the proportion of endorsed good and bad words did not differ significantly between groups in this restricted EEG sample. Importantly, the depressed and control groups still showed large differences on the BDI (M = 24.1 and 7.5, respectively), t(24) = 6.7, p1-tail < 0.001. Among other psychometric measures, they also differed on the BAI, t(24) = 3.60, p1-tail < 0.001. Differences on the PA and NA scales were in the predicted directions, but failed to reach significance, p1-tail = 0.08 and 0.09, respectively. Pearson correlations among the psychometric measures were also weaker, but all retained significance with one-tailed tests except for PA, which, as in the restricted RT sample, no longer correlated significantly with NA or BAI.
The EEG indicated considerable differences in the brain responses of depressed versus control participants during self-evaluation. Inspection of the 256-channel topographic waveform plots collapsed across endorsement and valence conditions (see Figure 1), shows the expected global pattern of visual stimulus processing by both groups. The visual P1 and N1 responses are clearly visible in the electrodes over the left and right visual areas, followed by a centroparietal P3/LPC that resolves toward the end of the epoch at about 850 ms. Consistent with the linguistic nature of the stimuli, one can observe left lateralized activity that moves over the several hundred milliseconds of the epoch from posterior to anterior regions along the left ventral stream. Also striking is the sustained positive shift in frontopolar regions beginning shortly after stimulus onset, along with a concurrent negative shift at electrodes overlying temporal lobe regions. Comparison of the control and depressed waveforms suggests an attenuation of brain electrical activity in depressed versus control participants, particularly evident in the N1 (see Figure 2, top) over the right hemisphere (e.g., electrodes 169, 177, 178), and in the P3/LPC from about 300–600 ms over the mid to left-lateralized centroparietal region (e.g., electrodes 101 and 119).
Figure 2.
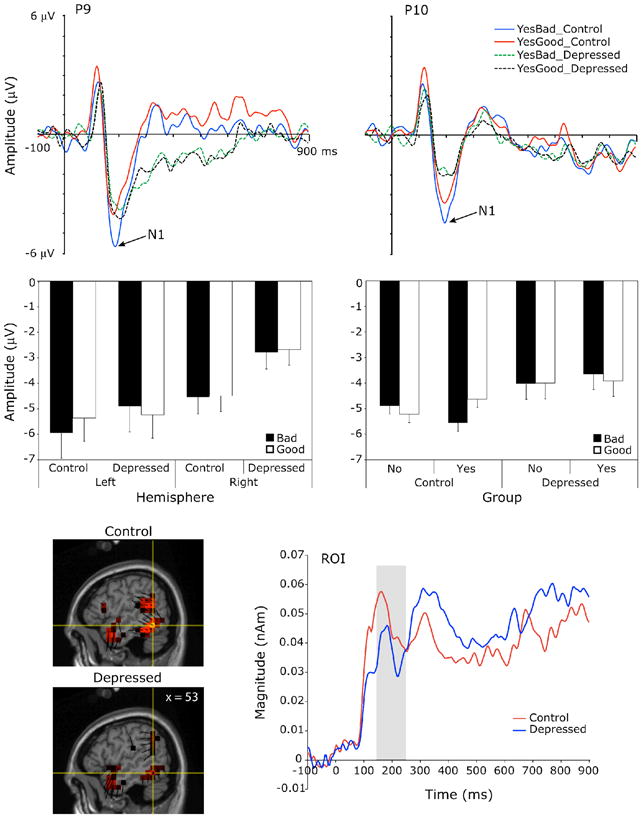
Top panel: Grand-average scalp waveform plots from representative channels of the left and right N1 to endorsed good (YesGood) and bad (YesBad) trait words for the depressed and control groups. Middle panel, left: Mean N1 amplitude by hemisphere and valence for the depressed and control groups. Error bars indicate the standard error of the means. Middle panel, right: Mean N1 amplitude by endorsement and valence for the control and depressed groups. Error bars represent confidence intervals for the Endorsement x Valence interactions of the within-group simple effects analyses. Bottom panel, left: Voxel intensity and vector orientation of the right posterior-occipital source region at the left N1 peak (196 ms), as modeled from the control and depressed group grand-averages, collapsed across experimental conditions. This region comprised 24 dipole voxels within BA37, BA19 and BA39. Bottom panel, right: Mean source waveforms indicating changes in current source magnitude over time in this source region for the control and depressed groups. Gray shading indicates the scalp N1 window.
N1 peak
Group x Endorsement x Valence x Hemisphere ANOVAs testing the significance of the N1 observations showed two three-way interactions for N1 amplitude, both involving group and valence (Figure 2, middle). First, a Group x Hemisphere x Valence interaction, F(1,24) = 6.14, p = 0.02, followed by Group x Valence within Hemisphere simple effects analyses indicated only a main effect of Group on the right. That is, the depressed had a smaller N1 than control participants to both good and bad words on the right, F(1, 24) = 4.69, p = 0.04. On the left, a Group x Valence interaction, F(1, 24) = 4.29, p = 0.049, obtained due to a smaller N1 for depressed than controls to bad words only, but this group difference for bad words on the left did not reach significance in posthoc t-tests, t(24) = 0.74, p = 0.47. Second, a Group x Endorsement x Valence interaction, F(1,24) = 6.18, p = 0.02, followed up by Endorsement x Valence within Group simple effects analyses, revealed a significant Endorsement x Valence interaction for control participants, F(1,12) = 18.69, p = 0.001), but not for the depressed, F(1,12) = 0.29, p = 0.6). Specifically, control participants had a larger N1 to endorsed bad words and to unendorsed good words (negative self-appraisal trials) than to endorsed good words, t(12) = −2.6, p = 0.025, and t(12) = −3.7, p = 0.003, respectively.
Source analysis located generators of the N1 in bilateral posterior occipitotemporal regions (Figure 2, bottom left). An Endorsement x Valence within-group ANOVA was conducted on the source waveforms of the left N1 source region (Figure 2, bottom right) as a follow-up exploration of the left-lateralized scalp N1 endorsement by valence interaction effect for the control group. This effect for the control group, however, did not reach significance in the source waveform analysis, F(1, 12) = 2.3, p = 0.16. An independent groups t-test was also conducted on the right N1 source region in follow-up exploration of the scalp main effect for Group on the right. This contrast did not reach significance in source space, t(24) = 0.63, p = 0.5.
P2-MFN complex
In the next interval of the epoch, between 200 and 400 ms after word onset, the strong left-lateralized negativity for bad words for the control group extended medially, at which point the neural response interacted with endorsement differently for control and depressed participants. Specifically, a Group x Endorsement x Valence interaction was significant for the MFN-P2 difference, F(1, 24) = 5.04, p = 0.034. Post-hoc t-test contrasts indicated greater negativity to endorsed versus unendorsed bad words (YesBad vs. NoBad) for the control group, t(12) = −2.7, p = 0.018, whereas the depressed group showed less negativity to endorsed versus unendorsed bad words, t(12) = 3.0, p = 0.011 (Figure 3). To test directly the control versus depressed contrast for the YesBad category, Group x Valence ANOVAs were conducted within Yes and No endorsements. Obviously, the No differences were not significant. The Group x Valence within Yes interaction was significant, F(1, 24) = 9.6, p = 0.005. For controls, the MFN-P2 difference was significantly larger for YesBad than YesGood, t(12) = −3.0, p = 0.011, Cohen’s d = −0.42, whereas the depressed exhibited a non-significant difference in the opposite direction, t(12) = 1.3, p = 0.2, Cohen’s d = 0.26. Thus, control participants, but not the depressed, exhibited the strongest MFN response to self-relevant bad trait words.
Figure 3.

Top panel, left: Grand-average scalp waveform plots from a representative channel of the P2/MFN complex for endorsed good (YesGood) and bad (YesBad) trait words for the depressed and control groups. Top panel, right: Mean MFN-P2 difference amplitude by endorsement and valence for the depressed and control groups. Error bars represent confidence intervals for the Endorsement x Valence interactions of the within-group simple effects analyses. Bottom panel, left: Voxel intensity and vector orientation for the dorsal anterior cingulate cortex/supplementary motor area source region at the P2 peak (205 ms), as modeled from the control-group grand-average for endorsed bad and good traits. This region comprised 15 dipole voxels within BA32 and BA24, also extending into BA6 and BA8. Bottom panel, right: Mean source waveforms indicating changes in current source magnitude over time for the control group across each experimental condition. Gray shading indicates the scalp P2 and MFN windows.
Source analysis localized the P2-MFN complex to a dorsal mediofrontal region comprising the dorsal anterior cingulate cortex and supplementary motor area (Figure 3, bottom). Endorsement x Valence within-group ANOVAs on both the P2 and MFN windows were conducted in follow up to scalp effects. In the P2 window, a significant Endorsement x Valence interaction obtained for the control group, F(1. 12) = 7.2, p = 0.020, but not the depressed, F(1, 12) < 0.01, p = 0.98. Post-hoc t-tests of the control-group effect revealed greater current source density in this region for negative appraisal trials (NoGood, M = 0.039 nAm; YesBad, M = 0.037 nAm) than positive appraisal trials (YesGood, M = 0.028 nAm; NoBad, M = 0.029 nAm), t(12) = 2.68, p = 0.02. Neither group showed significant differences in this region within the MFN window, all Fs < 2.
P3/late positive complex
During the window of the centroparietal P3/LPC, from 300 to 600 ms, a main effect of Endorsement obtained, F(1, 24) = 4.94, p = 0.036, indicating greater positivity for endorsed versus unendorsed words. There was also a trend toward a Group main effect, F(1, 24) = 3.49, p = 0.074, with control participants exhibiting a larger P3/LPC (M = 1.78) than depressed participants (M = 0.30). This difference was significant with a one-tailed test, t(24) = 1.87, p = 0.037 (Figure 4, top).
Figure 4.

Top panel, left: Grand-average scalp waveform plots from a representative channel of the P3/LPC for endorsed (Yes) and unendorsed (No) trait words for the depressed and control groups. Top panel, right: Mean P3/LPC amplitude by endorsement and valence for the depressed and control groups. Error bars indicate the standard error of the means. Middle panel: Voxel intensity and vector orientation for three source regions (ROIs 1–3) contributing to the scalp P3/LPC (450 ms), grand-averaged across all conditions for the control and depressed groups (left) and for the endorsed (Yes) and unendorsed (No) categories for the control group alone (right). ROI 1 comprised 13 dipole voxels within BA7 and BA31. ROI 2 comprised 13 dipole voxels within BA31, BA30, and BA23. ROI 3 comprised 23 dipole voxels within BA20, BA28, BA35, and BA36. Bottom panel, left: Mean source waveforms for ROI 1 indicating changes in current source magnitude over time for the control and depressed groups (Group main effect, p < 0.041). Bottom panel, middle and right: Mean source waveforms for ROI 2 and ROI 3 for endorsed (Yes) and unendorsed (No) trait words for control and depressed groups (Endorsement main effect for the control group only in both regions). Gray shading in scalp and source waveform plots indicates the scalp P3/LPC window.
Visual inspection of the source model during the P3/LPC window identified several contributing source regions, including a dorsal mid-to-posterior cingulate region (ROI_1), a posterior-cingulate-to medial-occipital region (ROI_2), and bilateral-medial-temporal regions (ROI_3 & ROI_4; Figure 4, middle). Group x Endorsement x Valence within-group ANOVAs on the mean source magnitudes from 300 – 600 ms revealed a significant main effect of Group for ROI_1, F(1, 24) = 4.64, p = 0.041, due to greater current source magnitude for the control group versus the depressed (Figure 4, bottom left). Group x Endorsement effects also obtained in ROI_2, F(1, 24) = 11.47, p = 0.002, and ROI_3, F(1, 24) = 5.80, p = 0.024. Posthoc paired-samples t-tests revealed greater current source magnitude on Yes than No trials for the control group in both ROI_2, t(12) = 3.26, p = 0.007, and ROI_3, t(12) = 3.23, p = 0.007 (Figure 4, bottom right). No significant differences obtained for the depressed group for these regions, ts(12) < −1.4, n.s.
DISCUSSION
Previous research has suggested that dimensionally-specific mood states apply fundamental and specific constraints on cognitive processing (e.g., MacLeod & Byrne, 1996; Clark, Watson, & Mineka, 1994). The psychometric results of this study likewise revealed a dimensionally-specific relationship between affect and cognition. Positive Affect was correlated preferentially with the endorsement of Good (socially desirable) traits, and Negative Affect was correlated preferentially with the endorsement of Bad (undesirable) traits. The event-related potential (ERP) analyses of the EEG also revealed differences in brain response related to word valence and self-evaluation that may provide clues to the neural mechanisms associated with the interplay between affect and cognition. Most notably, a stronger MFN was observed in controls in response to endorsed bad traits, and this pattern was attenuated in depressed participants. Given the evidence that MFN enhancement in a decision task may reflect recognition of a discrepant outcome (Botvinick, Cohen, & Carter, 2004), and is enhanced as non-depressed participants evaluate negative trait items (Tucker, Luu, Desmond, et al., 2003), these results are consistent with the interpretation that depressed participants do not hold the positive or self-affirming bias shown by non-depressed persons, and therefore fail to respond to aversive self-evaluation events as discrepant from expectancy. Finally, and unexpectedly, non-depressed participants showed a differentiation of brain response to the trait words as early as the visual N1 response (~ 200 ms), with enhanced negativity to self-relevant bad traits particularly, whereas this effect was absent in the depressed participants.
Mood and Self-Evaluation
The psychometric results suggest that bias in semantic evaluation is mood-specific in that Positive Affect is distinguished by greater endorsement of good traits, rather than fewer endorsements of bad traits, and Negative Affect is distinguished by greater endorsement of bad traits, rather than fewer endorsements of good traits. These trait endorsement patterns parallel the mood state dimensionality suggested by psychometric research, in which mood and current affect cannot be collapsed into a single “positive vs. negative” dimension, but must be understood as two separate dimensions (Tellegen, 1985; Watson & Clark, 1994). Although these mood state biases were exaggerated in the clinically depressed, they were qualitatively similar in their relation to self-appraisal in non-depressed participants. It is interesting to view these results in terms of the theoretical model that the cognitive biases observed in depression (associated with low Positive Affect) and anxiety (associated with high Negative Affect) reflect pathological exaggerations of normal mood state influences, and that these normal influences are self-regulatory mechanisms in that they shift cognitive expectancies, and self-appraisal, from optimism to pessimism. Moods can be characterized as motive-memories (Freud, 1895; Tucker Luu, & Pribram, 1995) that respond to events, store the personal evaluation of those events, and then shape ongoing cognitive appraisals through dimensional mood-congruent (anxiety and elation) priming.
Clues to Neural Activity in Self-Relevant Perception
Overall group differences in ERP responses were consistent with previous reports in the literature. Depressed participants showed smaller P3/LPC responses, as has often been reported (e.g., Bruder et al., 1995; R. F. Simons, 1982). Furthermore, the depressed participants showed attenuated N1 responses over the right hemisphere, also consistent with previous reports of right hemisphere dysfunction in depression (Keller et al., 2000; Figures 1 & 2). Importantly, the depressed participants’ attenuated N1 interacted with trait valence even at this early (~ 200 ms) time, showing a markedly different response from controls. Whereas controls showed enhanced N1s to negative appraisals (Yes Bad and No Good), the depressed participants did not.
Although early ERP effects, in the 100 to 200 ms interval, have been observed both in prepared target discrimination (Hillyard, 1985) and in response to affectively arousing visual stimuli (Junghöfer, Bradley, Elbert, & Lan, 2001), the N1 interval at 170 to 250 ms is typically the earliest period that cognitive processing of the visual stimulus (rather than pre-stimulus preparation) alters the brain electrical response to that stimulus. It is therefore striking that the non-depressed participants showed a significant discrimination of the semantic content of the words during the N1 interval, not only in relation to valence of the trait, but in relation to the self-relevance that would then determine their endorsement of the trait. In non-depressed controls, it was specifically the negative appraisal trials (i.e., those most threatening to a positive self-image) that showed exaggerated response in the N1. As revealed by source analysis, the N1 localized to the posterior inferior occipitotemporal lobe. Follow-up exploration of additional source ROIs during the N1 window revealed parallel increases in activity to Bad trait words in the temporal pole and medial temporal lobe (ps < 0.04). Increased fMRI BOLD response in the amygdala and inferotemporal cortex to arousing pictures has also been observed (Sabatinelli, Bradley, Fitzsimmons, & Lang, 2005). The implication is that activity in the occipitotemporal visual processing stream is modulated by personal semantic evaluation early in the decision process. Anatomically, this evaluation would likely be applied by “back-projections” from limbic (semantic-evaluative) networks at the core of the hemisphere (Tucker & Luu, 2007). Indeed, anterograde tracing of projections from the amygdala in monkeys by Amaral and Price (1984) revealed strong projections along the inferotemporal cortex and occipital cortex, as well as extensive projections to medial and orbital frontal regions.
Frontolimbic Mechanisms in Self-Evaluation
Immediately after (and possibly developing in parallel with) the N1 response in the posterior brain, there was a semantic discrimination observed in medial frontal networks. In terms of the sequence of processing, inspection of the surface maps suggests that, as is typical of dense array EEG studies of language processing (Frishkoff, Tucker, Davey, & Scherg, 2004), the negativity of the N1 traveled up the inferior temporal lobe, with greater amplitude on the left side, before engaging medial frontal (anterior cingulate cortex) and temporal limbic networks. Although the activity appears sequential in the head surface maps, the medial frontal responses overlap with the N1 interval, such that there is a significant semantic discrimination for the Yes Bad trait response in the P2-MFN complex beginning around 200 ms (the approximate timing of the N1 in most participants). As with the posterior N1, the MFN-P2 difference amplitude for the Yes Bad evaluation was enhanced for non-depressed controls (Figure 3). In contrast, an opposite trend was seen for the depressed, with an attenuated negativity in medial frontal networks as a unique response to the Yes Bad trait endorsement. In source space, this effect localized to the dorsal anterior cingulate and supplementary motor regions, where it was significant for controls in the P2 interval of the P2-MFN complex.
Thus, the neural discrimination in self-evaluation first seen in the posterior N1 visual system response appeared to be continued, and perhaps elaborated, within frontal networks that are important to the motivation and decision control of the behavioral self-report response. The role of medial frontal cortex in monitoring outcomes that are discrepant with expectancies may be particularly relevant to the greater MFN-P2 difference amplitude that non-depressed controls showed to unfavorable, self-relevant (Yes Bad) words. Judging from the overall bias to endorse favorable traits, the normal expectancy context or “psychological set” in the self-evaluation task is a positively valenced one. Therefore, when an unfavorable but characteristic trait is encountered, the medial frontal cortex appears to reflect neural activity related to response conflict, self-monitoring, or other neural mechanisms associated with resolving the discrepancy with prediction (Botvinick et al., 2004; Luu & Tucker, 2003; Tucker, Luu, Desmond et al., 2003).
This interpretation may also be applied to the depressed participants’ opposite response to the Yes Bad trait condition, suggesting an opposite semantic bias, toward expecting negative self-relevant events. It will be important in future research on cognition in depression to clarify the neuropsychological significance of depressed participants’ responses to Yes Bad items. It may be that depressed participants’ attenuated MFNs reflect the loss of a favorable self-report bias, which in the non-depressed causes a discrepancy response for the Yes Bad items. On the other hand, the appearance of the affective bias as early as the N1 suggests that perhaps these effects reflect a threat response in the non-depressed, and an active suppression of aversive information in the depressed. The fact that the non-depressed control group was selected because they had sufficient trials in the Yes Bad and No Good conditions means that the depressed participants’ differential responses are abnormal even when compared to non-depressed controls with a somewhat negative bias in self-evaluation.
Limitations of the Study
An important limitation of this study was the ERP design contrasting Yes and No responses for Good and Bad trait words, such that a sufficient number of ERP trials was required for averaging; this constraint eliminated many non-depressed participants with a more favorably biased self-appraisal. The trial average criteria also eliminated many of the depressed participants from the analyzed sample. In previous research (Tucker, Luu, Frishkoff et al., 2003), qualitative changes in MFN activity (a shift from higher to lower than normal levels) were observed in more severely depressed participants; whereas a reasonable range of depression severity was included in the present sample, the restriction for condition trial counts did not leave enough of this range to examine such effects. In addition, among the control and depressed participants retained for ERP analyses, trial counts per condition were relatively low, resulting in noisier averages. Together, the reduced participant samples and the low trial counts, therefore, decreased the signal-to-noise ratio and subsequent statistical power. Another limitation of ERP analyses is that they fail to show the origins of the observed average effects within the oscillatory dynamics of the ongoing EEG (Luu, Tucker, & Makeig, 2004; Makeig et al., 2002). These limitations could be addressed in further research by improving single trial analysis methodology to overcome the reliance on ERP averaging.
Finally, additional research is required to substantiate the relationship between frontolimbic activity and cognitive expectancy and discrepancy. In the meantime, neural evidence on differential frontolimbic responses, such as the MFN, can be considered only as indirect support for inferences about psychological processes, such as expectations for positive self-relevant events that differentiate normal from depressed persons. Continued efforts to relate biological mechanisms to psychological processes promise new insights into the understanding and treatment of this common and problematic psychiatric disorder.
Footnotes
Publisher's Disclaimer: The following manuscript is the final accepted manuscript. It has not been subjected to the final copyediting, fact-checking, and proofreading required for formal publication. It is not the definitive, publisher-authenticated version. The American Psychological Association and its Council of Editors disclaim any responsibility or liabilities for errors or omissions of this manuscript version, any version derived from this manuscript by NIH, or other third parties. The published version is available at www.apa.org/pubs/journals/abn.
References
- Amaral DG, Price JL. Amygdalo-cortical projections in the monkey (Macaca fascicularis) Journal of Comparative Neurology. 1984;230:465–496. doi: 10.1002/cne.902300402. [DOI] [PubMed] [Google Scholar]
- Beck AT, Epstein N, Brown G, Steer RA. An inventory for measuring clinical anxiety: Psychometric properties. Journal of Consulting and Clinical Psychology. 1988;56:893–897. doi: 10.1037//0022-006x.56.6.893. [DOI] [PubMed] [Google Scholar]
- Beck AT, Steer RA. Manual for the Beck Anxiety Inventory. San Antonio, TX: Psychological Corporation; 1990. [Google Scholar]
- Beck AT, Steer RA, Garbin MG. Psychometric properties of the Beck Depression Inventory: Twenty-five years of evaluation. Clinical Psychology Review. 1988;8:77–100. [Google Scholar]
- Botvinick MM, Cohen JD, Carter CS. Conflict monitoring and anterior cingulate cortex: An update. Trends in Cognitive Sciences. 2004;8:539–546. doi: 10.1016/j.tics.2004.10.003. [DOI] [PubMed] [Google Scholar]
- Bruder GE, Tenke CE, Stewart JW, Towey JP, Leite P, Voglmaier M, et al. Brain event-related potentials to complex tones in depressed patients: relations to perceptual asymmetry and clinical features. Psychophysiology. 1995;32:373–381. doi: 10.1111/j.1469-8986.1995.tb01220.x. [DOI] [PubMed] [Google Scholar]
- Chung G, Tucker DM, West P, Potts G, Liotti M, Luu P, et al. Emotional expectancy: Brain electrical activity associated with an emotional bias in interpreting life events. Psychophysiology. 1996;33:218–233. doi: 10.1111/j.1469-8986.1996.tb00419.x. [DOI] [PubMed] [Google Scholar]
- Clark LA, Watson D, Mineka S. Temperament, personality, and the mood and anxiety disorders. J Abnorm Psychol. 1994;103(1):103–116. [PubMed] [Google Scholar]
- Curry J, Rohde P, Simons A, Silva S, Vitiello B, Kratochvil C, et al. Predictors and moderators of acute outcome in the Treatment for Adolescents with Depression Study (TADS) Journal of the American Academy of Child & Adolescent Psychiatry. 2006;45:1427–1439. doi: 10.1097/01.chi.0000240838.78984.e2. [DOI] [PubMed] [Google Scholar]
- Dozois DJ. The psychometric characteristics of the Hamilton Depression Inventory. Journal of Personality Assessment. 2003;80:31–40. doi: 10.1207/S15327752JPA8001_11. [DOI] [PubMed] [Google Scholar]
- Ferree T, Eriksen KJ, Tucker DM. Region head tissue conductivity estimation for improved EEG analysis. IEEE Transactions on Biomedical Engineering. 2000;47:1584–1592. doi: 10.1109/10.887939. [DOI] [PubMed] [Google Scholar]
- Ferree T, Luu P, Russell GS, Tucker DM. Scalp electrode impedance, infection risk, and EEG data quality. Clinical Neurophysiology. 2001;112:536–544. doi: 10.1016/s1388-2457(00)00533-2. [DOI] [PubMed] [Google Scholar]
- Flor-Henry P. On certain aspects of the localization of the cerebral systems regulating and determining emotion. Biological Psychiatry. 1979;14:677–698. [PubMed] [Google Scholar]
- Freud S. Project for a scientific psychology. In: Stracehey J, editor. The standard edition of the complete psychological works of Sigmund Freud. Vol. 1. London: Hogarth Press; 1895. pp. 295–344. [Google Scholar]
- Falkenstein M, Hoormann J, Christ S, Hohnsbein J. ERP components on reaction errors and their functional significance: A tutorial. Biological Psychology. 2000;51:87–107. doi: 10.1016/s0301-0511(99)00031-9. [DOI] [PubMed] [Google Scholar]
- Frishkoff GA, Tucker DM, Davey C, Scherg M. Separation of anterior and posterior brain sources of event-related potentials in semantic comprehension. Cognitive Brain Research. 2004;20:329–354. doi: 10.1016/j.cogbrainres.2004.02.009. [DOI] [PubMed] [Google Scholar]
- Gehring WJ, Goss B, Coles MGH, Meyer DE, Donchin E. A neural system for error detection and compensation. Psychological Science. 1993;4:385–390. [Google Scholar]
- Goldberg LR. The development of markers for the Big-Five factor structure. Psychological Assessment. 1992;4:26–42. [Google Scholar]
- Grave de Peralta Menendez R, Murray MM, Michel CM, Martuzzi R, Gonzalez Andino SL. Electrical neuroimaging based on biophysical constraints. Neuroimage. 2004;21:527–539. doi: 10.1016/j.neuroimage.2003.09.051. [DOI] [PubMed] [Google Scholar]
- Hillyard SA. Electrophysiology of human selective attention. Trends in Neurosciences. 1985;8:400–405. [Google Scholar]
- Holmes CJ, Hoge R, Collins L, Woods R, Toga AW, Evans AC. Enhancement of MR images using registration for signal averaging. Journal of Computer Assisted Tomography. 1998;22:324–333. doi: 10.1097/00004728-199803000-00032. [DOI] [PubMed] [Google Scholar]
- Junghöfer M, Bradley M, Elbert T, Lan P. Fleeting images: A new look at early emotion discrimination. Psychophysiology. 2001;38:175–178. [PubMed] [Google Scholar]
- Junghofer M, Elbert T, Tucker DM, Braun C. The polar average reference effect: A bias in estimating the head surface integral in EEG recording. Clinical Neurophysiology. 1999;110:1149–1155. doi: 10.1016/s1388-2457(99)00044-9. [DOI] [PubMed] [Google Scholar]
- Keller J, Nitschke JB, Bhargava T, Deldin PJ, Gergen JA, Miller GA, et al. Neuropsychological differentiation of depression and anxiety. Journal of Abnormal Psychology. 2000;109:3–10. [PubMed] [Google Scholar]
- Lewinsohn PM, Steinmetz JL, Larson DW, Franklin JF. Depression-related cognitions: Antecedents or consequence? Journal of Abnormal Psychology. 1981;90:213–219. doi: 10.1037//0021-843x.90.3.213. [DOI] [PubMed] [Google Scholar]
- Liotti M, Mayberg HS, Brannan SK, McGinnis S, Jerabek PA, Fox PT. Differential limbic-cortical correlates of sadness and anxiety in healthy subjects: Implications for affective disorders. Biological Psychiatry. 2000;48:30–42. doi: 10.1016/s0006-3223(00)00874-x. [DOI] [PubMed] [Google Scholar]
- Luu P, Tucker DM. Self-regulation and the executive functions: Electrophysiological clues. In: Zani A, Preverbio AM, editors. The cognitive electrophysiology of mind and brain. San Diego: Academic Press; 2003. pp. 199–223. [Google Scholar]
- Luu P, Tucker DM, Derryberry D, Reed M, Poulsen C. Electrophysiological responses to errors and feedback in the process of action regulation. Psychological Science. 2003;14:47–53. doi: 10.1111/1467-9280.01417. [DOI] [PubMed] [Google Scholar]
- Luu P, Tucker DM, Makeig S. Frontal midline theta and the error-related negativity: Neurophysiological mechanisms of action regulation. Clinical Neurophysiology. 2004;115:1821–1835. doi: 10.1016/j.clinph.2004.03.031. [DOI] [PubMed] [Google Scholar]
- MacLeod AK, Byrne A. Anxiety, depression, and the anticipation of future positive and negative experiences. J Abnorm Psychol. 1996;105(2):286–289. doi: 10.1037//0021-843x.105.2.286. [DOI] [PubMed] [Google Scholar]
- Makeig S, Westerfield M, Jung TP, Enghoff S, Townsend J, Courchesne E, et al. Dynamic brain sources of visual evoked responses. Science. 2002;295:690–694. doi: 10.1126/science.1066168. [DOI] [PubMed] [Google Scholar]
- Mayberg HS, Liotti M, Brannan SK, McGinnis S, Mahurin RK, Jerabek PA, et al. Reciprocal limbic-cortical function and negative mood: Converging PET findings in depression and normal sadness. American Journal of Psychiatry. 1999;156:675–682. doi: 10.1176/ajp.156.5.675. [DOI] [PubMed] [Google Scholar]
- Moran JM, Macrae CN, Heatherton TF, Wyland CL, Kelley WM. Neuroanatomical evidence for distinct cognitive and affective components of self. Journal of Cognitive Neuroscience. 2006;18:1586–1594. doi: 10.1162/jocn.2006.18.9.1586. [DOI] [PubMed] [Google Scholar]
- Nauta WJ. The problem of the frontal lobe: A reinterpretation. Journal of Psychiatric Research. 1971;8:167–187. doi: 10.1016/0022-3956(71)90017-3. [DOI] [PubMed] [Google Scholar]
- Nauta WJ. Neural associations of the frontal cortex. Acta Neurobiologiae Experimentalis (Wars) 1972;32:125–140. [PubMed] [Google Scholar]
- Pandya DN, Yeterian EH. Morphological correlations of human and monkey frontal lobe. In: Damasio AR, Damasio H, Christen Y, editors. Neurobiology of decision making. Berlin, Germany: Springer-Verlag; 1996. pp. 13–46. [Google Scholar]
- Phillips ML, Drevets WC, Rauch SL, Lane R. Neurobiology of emotion perception I: The neural basis of normal emotion perception. Biological Psychiatry. 2003a;54:504–514. doi: 10.1016/s0006-3223(03)00168-9. [DOI] [PubMed] [Google Scholar]
- Phillips ML, Drevets WC, Rauch SL, Lane R. Neurobiology of emotion perception II: Implications for major psychiatric disorders. Biological Psychiatry. 2003b;54(5):515–528. doi: 10.1016/s0006-3223(03)00171-9. [DOI] [PubMed] [Google Scholar]
- Pizzagalli DA, Peccoralo LA, Davidson RJ, Cohen JD. Resting anterior cingulate activity and abnormal responses to errors in subjects with elevated depressive symptoms: A 128-channel EEG study. Human Brain Mapping. 2006;27:185–201. doi: 10.1002/hbm.20172. [DOI] [PMC free article] [PubMed] [Google Scholar]
- Reynolds WM, Kobak KA. Hamilton Depression Inventory. Odessa, FL: Psychological Assessment Resources; 1995a. [Google Scholar]
- Reynolds WM, Kobak KA. Reliability and validity of the Hamilton Depression Inventory: a paper-and-pencil version of the Hamilton Depression Rating Scale clinical interview. Psychological Assessment. 7:472–483. [Google Scholar]
- Sabatinelli D, Bradley MM, Fitzsimmons JR, Lang PJ. Parallel amygdala and inferotemporal activation reflect emotional intensity and fear relevance. Neuroimage. 2005;24:1265–1270. doi: 10.1016/j.neuroimage.2004.12.015. [DOI] [PubMed] [Google Scholar]
- Simons AD, Garfield SL, Murphy GE. The process of change in cognitive therapy and pharmacotherapy for depression: Changes in mood and cognition. Archives of General Psychiatry. 1984;41:45–51. doi: 10.1001/archpsyc.1984.01790120049007. [DOI] [PubMed] [Google Scholar]
- Simons RF. Physical anhedonia and future psychopathology: An electrocortical continuity? Psychophysiology. 1982;19:433–441. doi: 10.1111/j.1469-8986.1982.tb02500.x. [DOI] [PubMed] [Google Scholar]
- Talairach J, Tournoux P. Co-planar stereotaxic atlas of the human brain. New York, NY: Thieme Medical Publishers; 1988. [Google Scholar]
- Tellegen A. Structures of mood and personality and their relevance to assessing anxiety, with an emphasis on self-report. In: Tuma AH, Maser JD, editors. Anxiety and the anxiety related disorders. Hillsdale: Erlbaum; 1985. pp. 681–706. [Google Scholar]
- Tucker DM, Derryberry D, Luu P. Anatomy and physiology of human emotion: vertical integration of brain stem, limbic, and cortical systems. In: Borod JC, editor. The neuropsychology of emotion. New York: Oxford University Press; 2000. pp. 56–79. [Google Scholar]
- Tucker DM, Hartry-Speiser A, McDougal L, Luu P, deGrandpre D. Mood and spatial memory: Emotion and the right hemisphere contribution to spatial cognition. Biological Psychology. 1999;50:103–125. doi: 10.1016/s0301-0511(99)00005-8. [DOI] [PubMed] [Google Scholar]
- Tucker DM, Luu P. Neurophysiology of motivated learning: Adaptive mechanisms of cognitive bias in depression. Cognitive Therapy and Research. 2007;31:189–209. [Google Scholar]
- Tucker DM, Luu P, Desmond RE, Jr, Hartry-Speiser A, Davey C, Flaisch T. Corticolimbic mechanisms in emotional decisions. Emotion. 2003;3:127–149. doi: 10.1037/1528-3542.3.2.127. [DOI] [PubMed] [Google Scholar]
- Tucker DM, Luu P, Frishkoff G, Quiring J, Poulsen C. Frontolimbic response to negative feedback in clinical depression. Journal of Abnormal Psychology. 2003;112:667–678. doi: 10.1037/0021-843X.112.4.667. [DOI] [PubMed] [Google Scholar]
- Tucker DM, Luu P, Pribram KH. Social and emotional self-regulation. Annals of the New York Academy of Sciences. 1995;769:213–239. doi: 10.1111/j.1749-6632.1995.tb38141.x. [DOI] [PubMed] [Google Scholar]
- Watson D, Clark LA. The PANAS-X: Manual for the positive and negative affect schedule – expanded form. Department of Psycholgoy, University of Iowa; 1994. [Google Scholar]
- Watson D, Tellegen A. Toward a consensual structure of mood. Psychological Bulletin. 1985;98:219–235. doi: 10.1037//0033-2909.98.2.219. [DOI] [PubMed] [Google Scholar]