Abstract
Magnetic Resonance Imaging (MRI) has been widely used non-invasively for pediatric neuroimaging for more than a decade. More recently, with advances in computing, functional techniques for imaging water diffusion, cellular metabolite levels, and blood flow are becoming available. MR spectroscopy imaging (MRSI) offers a snapshot of the metabolic status in the tissue of interest. It is complementary to the more traditionally used anatomic imaging for diagnoses of various abnormalities. This review describes the physical basis of proton MRSI, summarizes currently available techniques and their applications, highlights challenges of performing MRSI in the pediatric population and previews the newest techniques currently on the horizon.
Introduction
Since the 1980s, Magnetic Resonance Imaging (MRI) has been used non-invasively for pediatric anatomic neuroimaging [1, 2], and much more widely over the past two decades as modern MRI scans became commercially available and affordable. More recently, advanced MR techniques that yield additional functional information, such as diffusion, angiography, and spectroscopy have become available in the clinical setting [3–9]. MR spectroscopic imaging (MRSI) offers the metabolic status in the tissue, which most often precedes other functional and anatomic changes. It is complementary to the more traditionally used anatomic imaging for diagnoses of various abnormalities [5, 7, 10–12]. This review describes the physical basis of proton MRSI, the currently available techniques and their applications, challenges of performing MRSI in the pediatric population, and ends with future developments and a preview of the newest techniques.
Background for MRSI
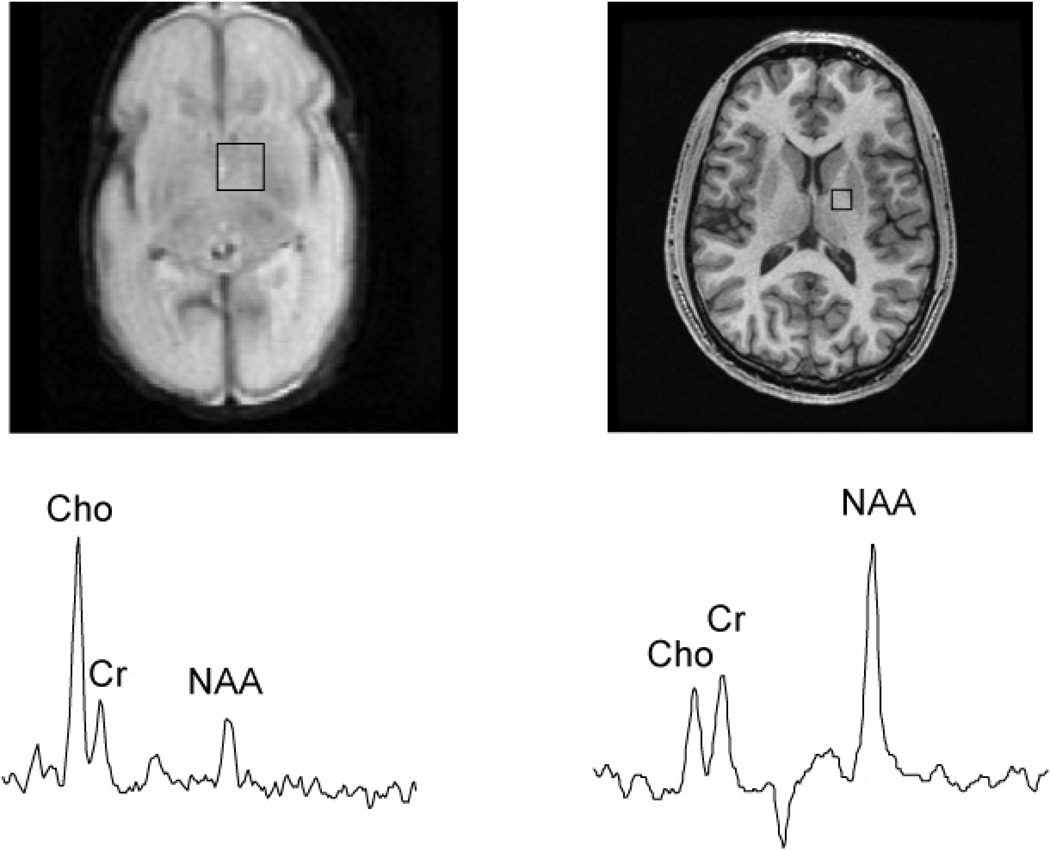
Magnetic resonance imaging utilizes the magnetization due to nuclear spins and their interactions with the surrounding environment. Images are acquired when externally applied radio-frequency (RF) waves to the field generate corresponding responses in terms of induced magnetic field changes as excited spins return to equilibrium and resulting in detected electric currents in the receiver coils [13]. Fourier transforms are used to convert the digitized electric signals into images. The physical locations are encoded by slightly varying frequencies. In MR spectroscopy, different metabolites have characteristic resonant frequencies that can be encoded and identified. Typical newborn and adult MR spectra are demonstrated in Figure 1. MRSI in comparison to regular imaging utilizes not only spatial frequency encoding but also spectral frequency encoding of chemical information [14]. This provides important metabolic information, but also contributes to the complexity of the data and processing that is needed. In addition, in vivo detection of metabolites, though difficult due to effects of concentration and limited signal to noise (SNR), can be accomplished through signal averaging and carefully planned acquisitions. Multiple measurements are taken for increased SNR using the principle of signal averaging, which increases SNR by , where n is the total number of averages.
Figure 1.
A 1cc voxel selected from a 3D PRESS MRSI long TE 144ms acquisition of a 29-week gestational age preterm infant and a healthy adult volunteer. Note the relative size of the head size to that of the 1cc MRS voxel selection.
Available MRSI Techniques
The two most widely used MR spectroscopy acquisition methods are Stimulated Echo Acquisition Mode (STEAM) [15] or Point RESolved Spectroscopy (PRESS) sequences [14]. In a STEAM acquisition, three 90° excitation RF pulses are used to select a voxel, and the resulting stimulated echo is acquired for measurement [15]. The echo time (TE) of the sequence is the time interval between the first two pulses and mixing time (TM) is the duration between the second and third RF pulse. 90° pulses are generally short in duration and have small peak power and lower power deposition and therefore are most suitable for short TE acquisitions of metabolites with shorter T2 and also for spectroscopic imaging at higher fields. The biggest drawback of a STEAM sequence is its relatively low SNR due to the use of the stimulated echo, in which half of the signal is not available for measurement.
The PRESS sequence, in comparison, uses a RF train of 90-180-180 pulses to select a voxel [14]. The resultant spin echo has full signal for data acquisition. However, due to the length of 180° pulses, PRESS is generally used for acquisitions with longer TE. Over the last decade, the development of spectral-spatial radio-frequency (SSRF) pulses has improved the PRESS acquisition. SSRF pulses are both spatially and spectrally selective. They provide excellent suppression of unwanted signals such as water and lipid and also provide improved spatial selection. Optimally designed SSRF pulses have minimal chemical shift misregistration (the metabolite resonant frequencies are offset from the carrier frequency, resulting in a mismatch in the data), which is essential in acquiring large volumes (whole brain metabolic maps).
Single voxel spectroscopy (SVS), 2D and 3D MRSI
The most commonly available spectroscopy method is the single voxel acquisition, in which one volume of interest is selected and measured. This method is simple to implement and use due to its simple acquisition and processing needs. A typical size of 2cm × 2cm × 2cm voxel is selected, resulting in an 8 cc volume. The relatively large size of the voxel is used for obtaining sufficient SNR in these spectroscopic acquisitions. A typical single voxel exam is around 2–3 minutes depending on the field strength and time of repetition (TR). TR is generally chosen to avoid T1 saturation of the interested metabolites species. Generally, three times the T1 is needed.
Two dimensional MRSI is an extension of the single voxel to a slice, in which the in-plane voxels are phased encoded, and 3D MRSI is further extended to 3D volume for increased coverage. The scan time of the exam is dependent on the number of voxels encoded due to the fact that total scan time is in spectroscopy the product of TR * Nx * Ny * Nz. Although they are time consuming, the coverage provided by 2D and 3D offer improved clinical diagnostics when neighboring and contralateral regions are also of interest. The spatial resolution in MRSI is generally much coarser than in anatomic imaging. But metabolite levels from specific regions denoted on the anatomic images can still be analyzed by performing voxel shifting [16–18], which is an advantage when acquiring data in 3D.
Spectral Editing
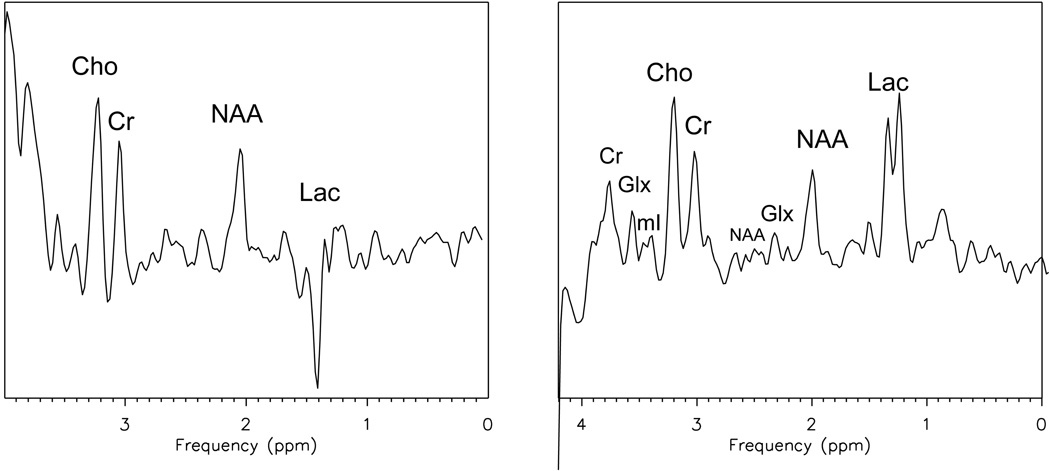
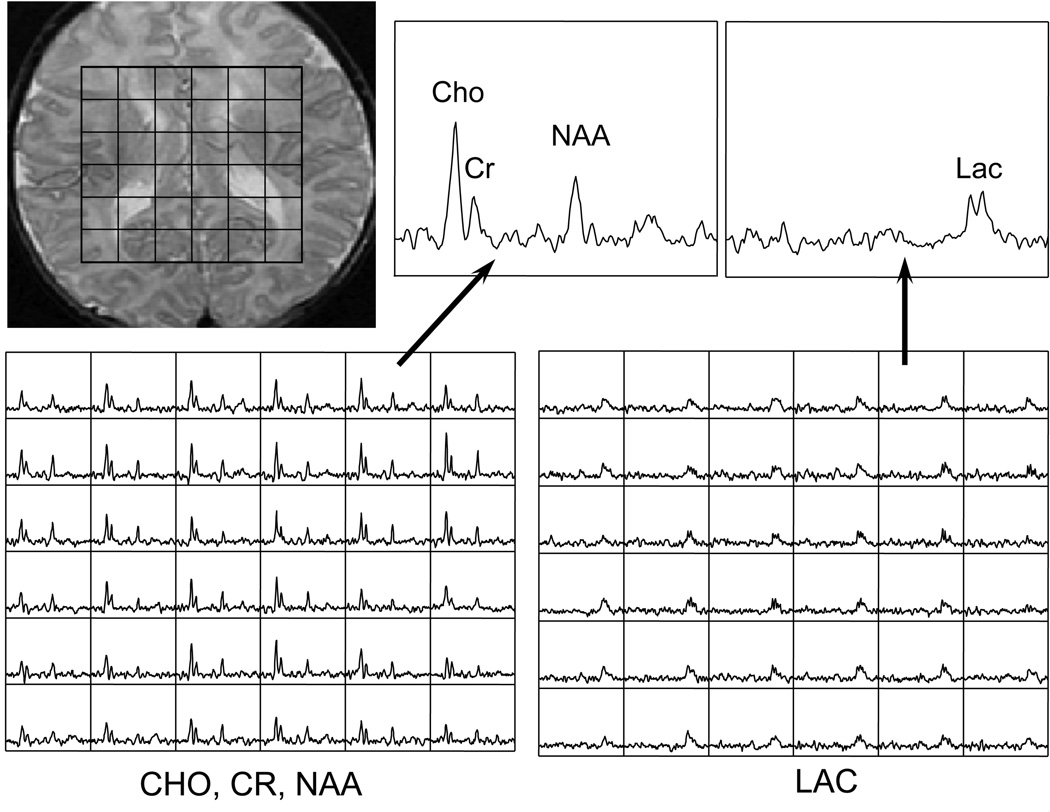
The hydrogen atoms in various biologically important compounds are coupled species (Jcoupled or J-modulation) and their spectral appearances evolve with TE. This property must be considered during acquisition and can be used for improved identification. For example, one such metabolite is lactate, which is of interest when diagnosing newborn patients with hypoxic ischemic encephalopathy. Lactate is completely inverted at TE of 144ms and fully upright at 288ms, demonstrated in Figure 2. Most of the SVS exams are done at 288ms to allow the evolution of lactate to its fully upright position and also reduce the amount of lipid contamination (lipid has a short T2 and decays rapidly). However in many cases, the spectrum is contaminated with a broad lipid resonance, which is either subcutaneous lipid folded into the desired ROI or lipid from cell turnover. Spectral editing is needed to obtain accurate lactate levels. One lactate editing method is called MEGA [19] or BASING [20], in which two spectra are collected sequentially at TE of 144 ms. In one cycle, the lactate methane quartet at 4.1ppm is excited, but not excited in the second cycle. The resultant spectra would have lactate inverted in one case and upright in the other. Then, the spectra are summed and subtracted to yield the desired results; in this case, the summed spectrum contains NAA, Choline, and Creatine (Figure 3 left), and the difference spectrum contains Lactate (Figure 3 right). The difference spectrum would have an accurate measurement of the lactate levels because the lipid resonance is not affected by the editing technique, and therefore, would be completely subtracted from the spectrum.
Figure 2.
Single voxel spectroscopy comparison between a TE 144ms (a) and TE 288ms (b) demonstrating modulation of lactate at 1.4ppm.
Figure 3.
A slice of a 3D MRSI lactate editing acquisition of a newborn with hypoxic ischemic encephalopathy.
Spectroscopic data processing
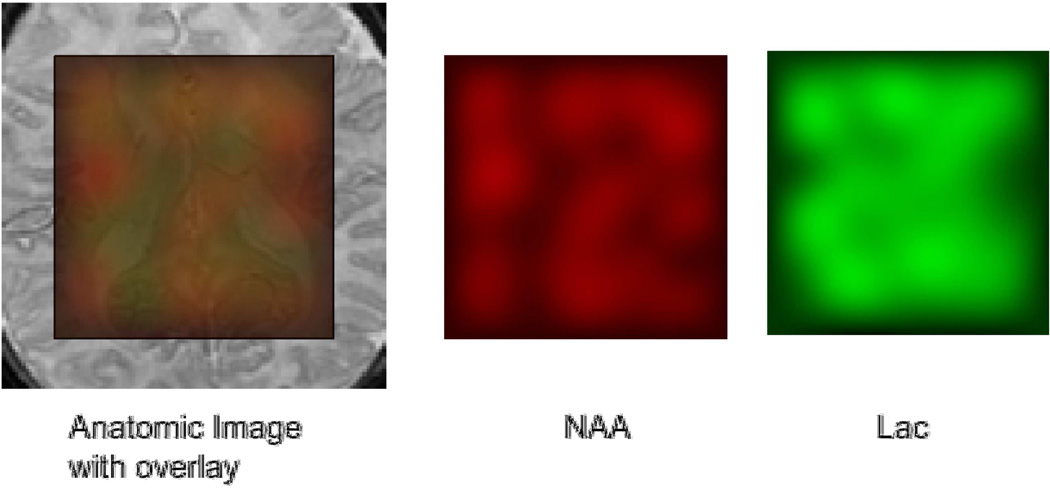
Various software packages have been developed to integrate and analyze the spectroscopy data according to the corresponding metabolite peak files [16, 18, 21–23]. The reconstruction usually starts with an apodization of the k-space data, followed by a Fourier transform to produce the spectral arrays. Then, the spectra are corrected for phase and frequency variations. The resultant spectra are also baseline corrected due to the incomplete water suppression and metabolite images were generated to depict the three-dimensional distribution of metabolite levels. The processed metabolite levels can be converted into images for easy visualization and further analysis using regions of interest (ROI’s). An example of the metabolite maps is shown in Figure 4. Color overlays can also be generated to help visualize the abnormal regions of the brain. ROI’s are then drawn on anatomic images and metabolite values are evaluated through the use of these ROI’s. A typical processing flow is demonstrated in Figure 5, in which the processing box denotes the analysis type (i.e. LC Model, peak integration, and other spectral or time domain fitting techniques).
Figure 4.
An anatomic image with colored overlay of NAA and Lac in red and green, respectively. This demonstrates the regional metabolic differences. In this HIE patient, there is widespread lactate buildup in the brain, demonstrated by the resultant orange color. Also, predominately green color in the ventricle is typical of lactate in the CSF.
Figure 5.
MRSI processing flow chart. MRSI data is acquired, processed, and converted to metabolite images using various methods. Then the ROI comparisons are done to yield regional metabolic variations and abnormalities.
Quantitation
Generally, quantitation of metabolites is done either by measuring the relative peak heights/areas or by calculating the absolute concentrations by fitting the spectral peaks. The relative peak heights/areas are normalized within the subject and changes can be monitored through the variations in those ratios. The peak height and area of the metabolite is proportional to the concentrations, so the ratios of peak heights or areas are proportional to the ratios of the concentrations [16]. In the other case, absolute concentrations are determined using a priori metabolite concentration profiles by measuring standards of varying chemical compounds; in vivo spectra are then fitted with the spectra from the predetermined concentrations of metabolites and corrected for relaxation times [21].
Neuronal Development
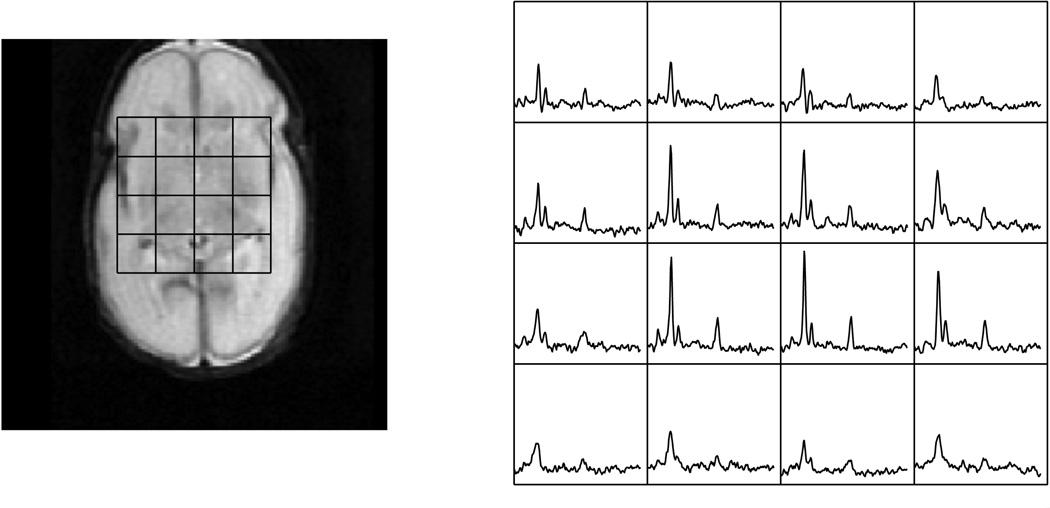
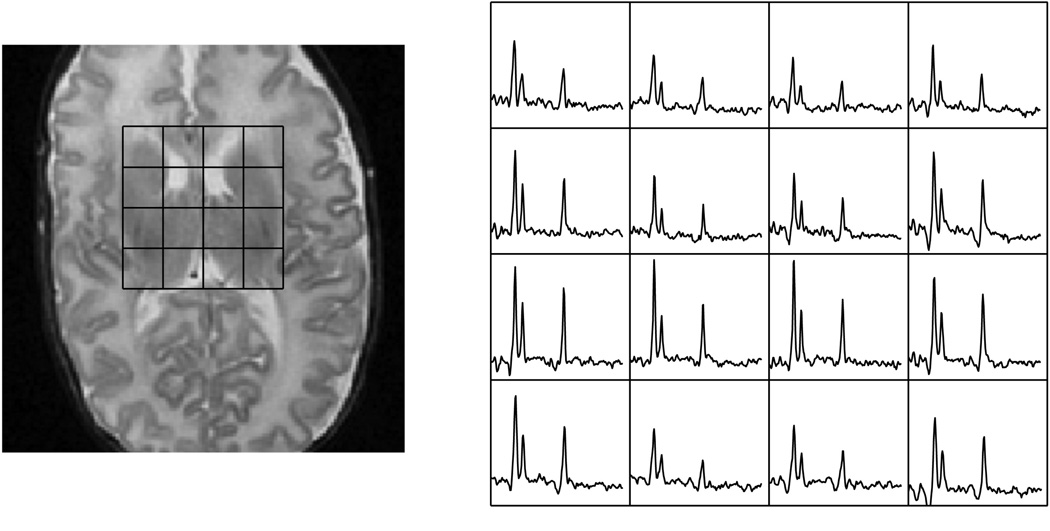
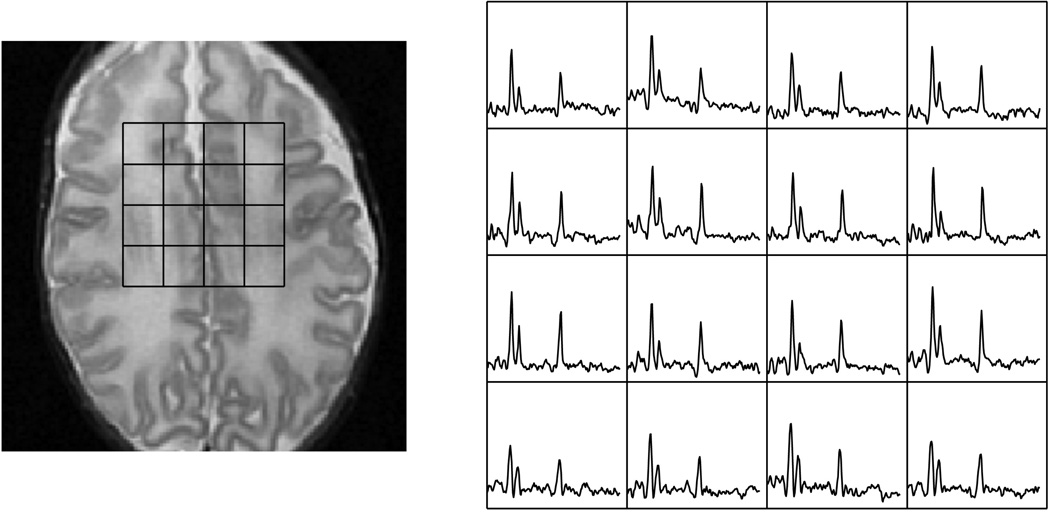
The metabolic profile changes as the brain matures, which can be quantified by MR spectroscopy. The rate of increase of NAA is related to the maturation process and can be quantified and correlated. Changes in metabolic ratios have been reported by various groups [24–26], and these investigations are still ongoing for whole brain metabolic profiling. For newborns, the brain is relatively immature and has much less neuronal activity in comparison to adults. This is reflected in the low quantity of NAA [27]. At the same time, the newborn brain is maturing at a rapid rate, undergoing not only major structural changes but also metabolic changes in the weeks after birth. This dramatic increase can be seen in premature mature newborns imaged at various corrected gestational age periods [25]. Figure 6 shows a neonate born at 24 weeks and imaged at 31 weeks, while Figure 7a shows a neonate born at 27 weeks and imaged at 48 weeks. Figure 7b is a slice superior to the spectra shown in Figure 7a demonstrating the regional metabolic variations. The basal ganglia and other deep gray structures mature earlier and have higher levels of Cho and NAA. Therefore, in evaluating newborn MRSI, the age of the newborn and anatomic location must both be considered. Kimura et al. noted that there is a rapid increase in NAA/Cho and NAA/Cr ratios in the first 3 months after birth followed by a period of gradual increase [24]. Vigneron et al. described metabolic difference between premature and term infants and several regional differences [25]. Kreis et al. further confirmed the variations and also described additional J-coupled metabolites and metabolites with short T2 relaxation [26]. Monitoring these metabolic changes may provide valuable information for the clinical management of premature and injured term neonates as well as monitoring the normal brain development process.
Figure 6.
Metabolites at the basal ganglia level of a premature infant born at 24 weeks gestational age and imaged at 29 weeks of gestational age.
Figure 7.
Figure 7a. Metabolites at the basal ganglia level of a premature newborn born at 27 weeks gestational age and imaged at 48 weeks of gestational age.
Figure 7b. Metabolites at the level above the ventricles of same premature newborn in the previous figure. The white matter and cortical voxels demonstrate lower levels of NAA and Cho in comparison to the basal ganglia, which matures earlier.
Another obvious difference in the metabolic profile of the newborn in comparison to the adult is the high choline and phosphocholine concentration. Normally, in adults, the choline peak is much smaller than that of NAA, and only becomes large in neurodegenerative [28] and brain tumor patients [18], when elevated choline becomes visible by MR spectroscopy. When choline is membrane-bound, it effectively becomes a macromolecule with a very short T2. This causes the MR signal to decay rapidly and is normally not seen on spectroscopy scans. In the case of the newborn brain, the rapid growth and turnover of the membranes are effectively similar to that of brain tumors and therefore, have a similar metabolic profile with large choline and small NAA peaks [25]. In many cases, NAA/Cho ratios are used to gauge whether the metabolic function is normal or abnormal.
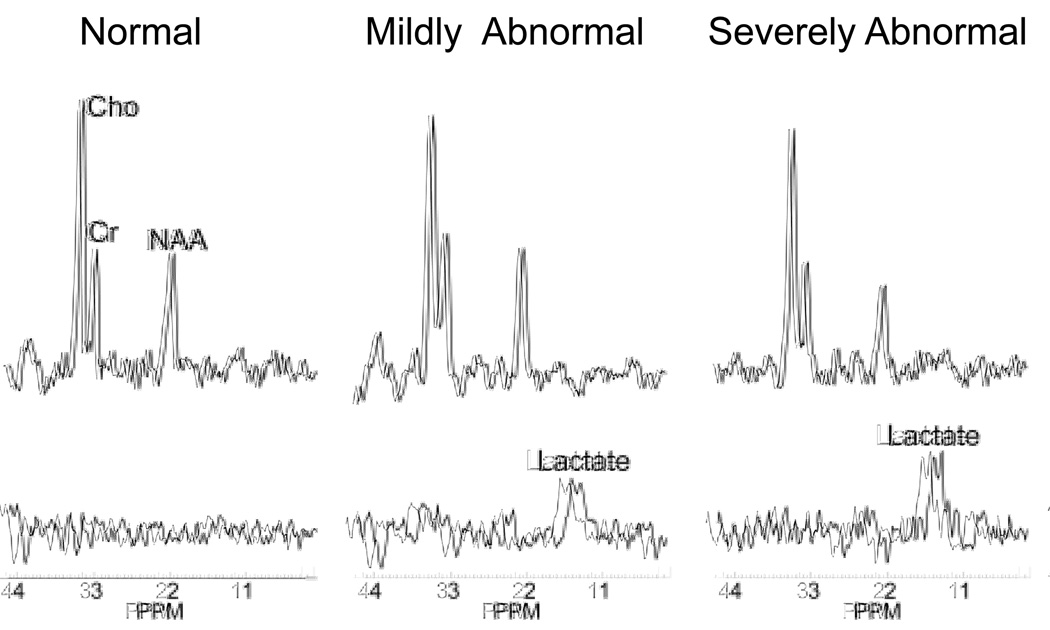
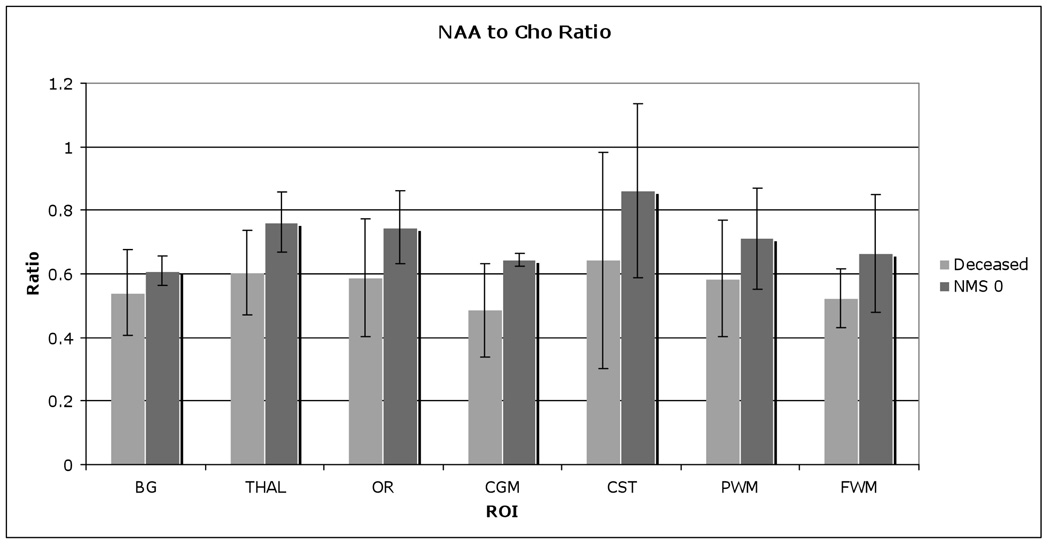
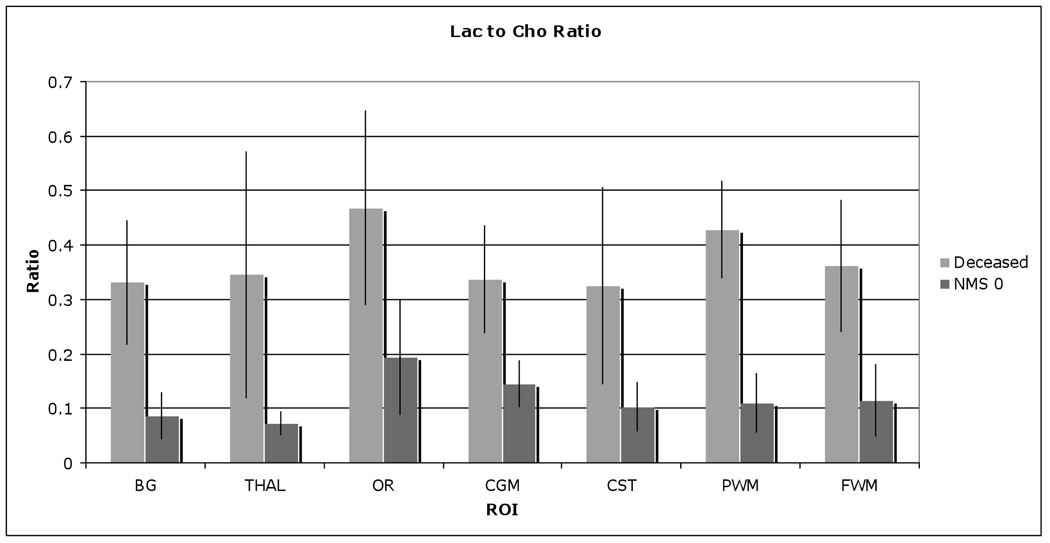
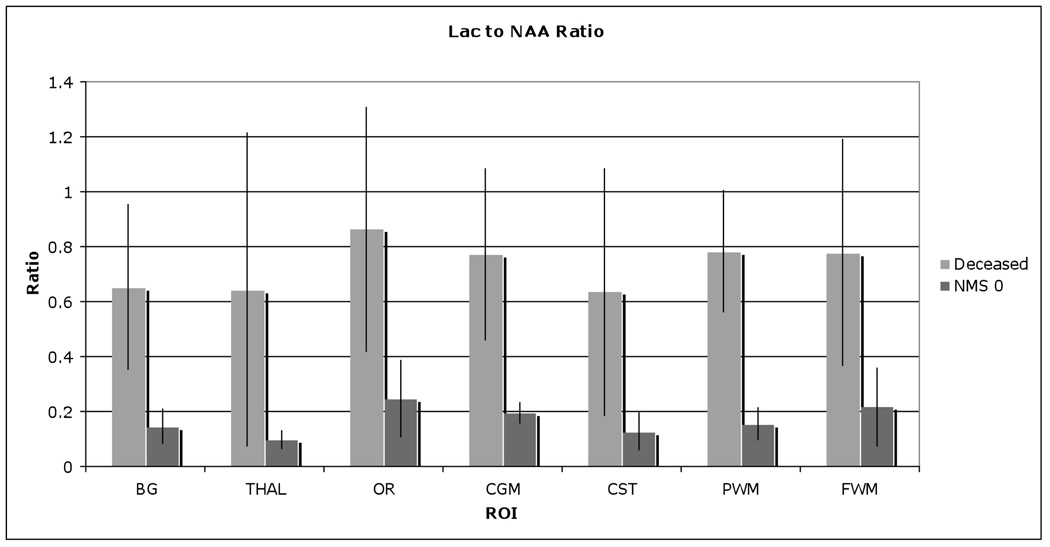
Lactate, the byproduct of anaerobic respiration, can be indicative of accelerated cell growth, in which the need of oxygen outpaces supply [10]. In normal development, the newborn brain would have a limited quantity of detectable lactate, caused by rapid maturation [29]. However, in injured newborns with hypoxic ischemic encephalopathy (HIE), a large quantity of lactate is typically present [6]. Figure 3 demonstrates a case of HIE patient born at term with elevated lactate levels across the brain. In HIE cases, anaerobic respiration causes build up of lactate levels and the low pH levels directly impact the tissue by affecting other cellular activities. The amount of lactate can be readily detected by MRS [10]. Current studies are ongoing to relate the amount of lactate to the degree of severity of brain damage and also to monitor patients undergoing cooling therapy. An example of lactate in varying degrees of injury is shown in Figure 8, in which the severely injured newborns generally have higher levels of lactate. High lactate levels are also accompanied by changes in other metabolic ratios. Figure 9, Figure 10, and Figure 11 demonstrate decreased NAA/Cho and increased Lac/NAA and Lac/Cho ratios in newborns with HIE who later expired as compared to normative newborns who were evaluated at 1 year of age with neuromotor score of 0 as defined by Barovich et al. [10]. Numerous studies have also demonstrated that elevated lactate is present in a variety of other brain injuries [30–32] or abnormalities [33] besides HIE [10, 34, 35]. In the study by Haseler et al. [30], subjects with shaken baby syndrome were studied serially. The MRS showed elevated lactate and lipid levels, accompanied by decreased NAA and Cr, at a much earlier stage than the anatomic MRI exams demonstrating tissue loss. The authors concluded that proton MRS appeared to show irreversible neurological damage when clinical and neurological exams were not conclusive. The same investigators demonstrated high specificity 89% and high sensitivity 89% of MRS relating to poor outcome in acute brain trauma in a later study [31]. Boddaert et al.’s study of cerebellar abnormality also indicated that high levels of lactate may be valuable to diagnose mitochondrial respiratory chain deficiency [33].
Figure 8.
Typical metabolic profile of newborns with different degrees of HIE injury, demonstrating significant increases in lactate levels and associated decrease in NAA with increasing degree of injury.
Figure 9.
NAA to Cho ratio comparison between subsequently deceased and normative newborn (neuromotor score of 0), showing significant higher NAA/Cho in normative newborns.
Figure 10.
Lac to Cho ratio comparison between subsequently deceased and normative newborn (neuromotor score of 0), showing significant higher Lac/Cho in deceased newborns.
Figure 11.
Lac to NAA ratio comparison between deceased and normative newborn (neuromotor score of 0), showing significant higher Lac/NAA in deceased newborns.
The majority of studies in pediatric MRS have investigated the changes in NAA, Cho, Cr, and Lac peaks due to their simplicity and robustness in detection. With the improvements of MR hardware and software, an increasing number of studies have started to evaluate coupled metabolic species such as glutamate/glutamine (glx) and myo-inositol (mI) [36, 37]. In a few recent studies, increased Glx/Cr [36] and higher mI [37] showed strong correlation to poor outcome.
Clinical application of MRSI in the newborn
Physiological changes induce metabolic changes, which can be detected by MRSI. At a later stage, other microstructural (diffusion) and macrostructual cellular (anatomic) changes occur. Therefore, by determining the metabolic status, earlier stages of the pathological events can often be visualized, permitting prompt intervention.
Haseler et al.’s study of shaken baby syndrome patients suggested that biochemical changes detected by MRS precede any anatomic changes detectable on MRI, which may play a significant role in management of SBS patients [30]. Other studies have also demonstrated the importance of using MRS to detect metabolic changes that have direct impact on the treatment strategies for individual patients. For example, Miller et al. [9] reported that combined MRSI and diffusion studies provided evidence indicating that the newborns studied with congenital heart disease developed brain abnormalities prior to open heart surgery. In comparison with the control population, the preoperative cohort had decreased NAA/Cho and elevated Lac/Cho, and associated increase in diffusivity and reduction in white matter anisotropy. The preoperative and postoperative groups did not show significant differences in metabolic ratios and diffusion measurements. The authors commented on the need to reassess treatment strategies and interventions that are needed to better serve these patients. The long-term predictive value of these acute MRSI findings is currently being examined.
In another study, Holshouser et al. [38] studied a variety of neonates, infants, and children with acute brain injury from accidental and non-accidental trauma, which included cardiac arrest, perinatal hypoxic-ischemic encephalopathy, seizures, stroke, hypoglycemia, and other injuries secondary to cardiac surgery. This study demonstrated reduced NAA and increased Lac in patients with poor outcome such as fatality and neurologic deficits. The investigators also noted that acquisition parameter optimization is needed in using short and long echo MRS acquisitions to study the various groups of patients to best detect the metabolites of interest.
Challenges and Future developments
Fast 3D MRSI
Single voxel MRS has been widely used in the clinical setting due to its simplicity and speed of acquisition. However, its limited coverage cannot assess regional metabolic differences across the brain. The large spatial coverage of 3D MRSI could effectively offer metabolic profiles throughout the brain. However, its application has been limited due to various reasons. One severe limitation of performing 3D whole brain MRSI in routine clinical exams is the total acquisition time in addition to the massive amounts of data collected and analyses needed. Computing power and storage have grown tremendously over the last decade, and most institutions have adequate resources to analyze and store MRSI data. The long exam time is not only difficult to tolerate for patients but also increases healthcare costs. The commonly used 3D MRSI sequence can easily take up to 30 minutes alone, which is in addition to the other imaging sequences, results in long MR exam times. To resolve this, various methods have been proposed and tested to speed up spectroscopic acquisitions. Using parallel imaging [39, 40], spatial readout gradients (echo-planar [41] and spiral [42, 43] trajectories), or a combination of both [44, 45], scan times can be dramatically reduced. However, the user needs to determine the minimal SNR needed for the accurate measurement of the metabolites. These fast 3D MRSI have been used in adult clinical studies [40, 46], but have not propagated for neonatal imaging due to limited SNR in the newborn brain. The recent availability of 3T scanners as well as optimized neonatal coils, these novel techniques will be available for newborn MRSI in the near future.
Editing Techniques
More recently, metabolites with short T2 and J-coupled species are gaining interest. Glutamate, a neurotransmitter, can be used to further evaluate the neuronal activity and offer more insights into the status of the brain tissue. Myo-inositol is involved in energy and osmotic regulation. These two metabolites can be detected using short TE spectroscopy; however, the large water and macromolecule resonances heavily distort the baseline at short TE, which makes the quantification extremely challenging. Recently, a TE-averaging method has been proposed and investigated in vivo [47], yielding a relatively robust method for detecting glutamate and myoinositol. Concurrently, Constant-Time PRESS (CTPRESS), another method for measuring J-coupled metabolites, offers an alternative method for quantitation [48]. Both methods were initially introduced as a single-voxel method, and have recently been extended to 3D for full brain coverage [49, 50].
Summary
MRSI, by providing a metabolic profile, is able to infer additional tissue information, offering complimentary diagnostic value to traditional anatomic imaging. Metabolic ratios can be used to diagnose a variety of newborn abnormalities as well as in assessing neuronal maturation. While long-term predicative value of MRSI has not been firmly established, evidences suggest that metabolic ratios are different among the normal and the abnormal populations. In addition to long-term clinical studies, basic MRSI technique developments have concentrated on fast 3D acquisitions that will offer whole brain information and short echo acquisitions that would gather additional metabolic information.
Footnotes
Publisher's Disclaimer: This is a PDF file of an unedited manuscript that has been accepted for publication. As a service to our customers we are providing this early version of the manuscript. The manuscript will undergo copyediting, typesetting, and review of the resulting proof before it is published in its final citable form. Please note that during the production process errors may be discovered which could affect the content, and all legal disclaimers that apply to the journal pertain.
References
- 1.Smith FW. The Value of Nmr Imaging in Pediatric Practice - a Preliminary-Report. Pediatric Radiology. 1983;13(3):141–147. doi: 10.1007/BF01624398. [DOI] [PubMed] [Google Scholar]
- 2.Johnson MA, et al. Clinical Nmr Imaging of the Brain in Children - Normal and Neurologic Disease. American Journal of Neuroradiology. 1983;4(5):1013–1026. doi: 10.2214/ajr.141.5.1005. [DOI] [PubMed] [Google Scholar]
- 3.Partridge SC, et al. Diffusion tensor imaging: serial quantitation of white matter tract maturity in premature newborns. Neuroimage. 2004;22(3):1302–1314. doi: 10.1016/j.neuroimage.2004.02.038. [DOI] [PubMed] [Google Scholar]
- 4.Ketonen LM, Valanne L. Neuroimaging of Pediatric Diseases. Seminars in Neurology. 2008;28(4):558–569. doi: 10.1055/s-0028-1083692. [DOI] [PubMed] [Google Scholar]
- 5.Barkovich AJ, et al. Proton spectroscopy and diffusion imaging on the first day of life after perinatal asphyxia: preliminary report. AJNR Am J Neuroradiol. 2001;22(9):1786–1794. [PMC free article] [PubMed] [Google Scholar]
- 6.Barkovich AJ, et al. MR imaging, MR spectroscopy, and diffusion tensor imaging of sequential studies in neonates with encephalopathy. AJNR Am J Neuroradiol. 2006;27(3):533–547. [PMC free article] [PubMed] [Google Scholar]
- 7.Huppi PS, Lazeyras F. Proton magnetic resonance spectroscopy ((1)H-MRS) in neonatal brain injury. Pediatr Res. 2001;49(3):317–320. doi: 10.1203/00006450-200103000-00003. [DOI] [PubMed] [Google Scholar]
- 8.Huppi PS, Dubois J. Diffusion tensor imaging of brain development. Semin Fetal Neonatal Med. 2006;11(6):489–497. doi: 10.1016/j.siny.2006.07.006. [DOI] [PubMed] [Google Scholar]
- 9.Miller SP, et al. Abnormal brain development in newborns with congenital heart disease. N Engl J Med. 2007;357(19):1928–1938. doi: 10.1056/NEJMoa067393. [DOI] [PubMed] [Google Scholar]
- 10.Barkovich AJ, et al. Proton MR spectroscopy for the evaluation of brain injury in asphyxiated, term neonates. AJNR Am J Neuroradiol. 1999;20(8):1399–1405. [PMC free article] [PubMed] [Google Scholar]
- 11.Peden CJ, et al. Proton MR spectroscopy of the brain in infants. J Comput Assist Tomogr. 1990;14(6):886–894. doi: 10.1097/00004728-199011000-00004. [DOI] [PubMed] [Google Scholar]
- 12.Hwang JH, et al. Proton MR spectroscopic characteristics of pediatric pilocytic astrocytomas. AJNR Am J Neuroradiol. 1998;19(3):535–540. [PMC free article] [PubMed] [Google Scholar]
- 13.Bloch F. Nuclear Induction. Physical Review. 1946;70(7):460–474. [Google Scholar]
- 14.Bottomley PA. Spatial localization in NMR spectroscopy in vivo. Ann N Y Acad Sci. 1987;508:333–348. doi: 10.1111/j.1749-6632.1987.tb32915.x. [DOI] [PubMed] [Google Scholar]
- 15.Frahm J, Merboldt KD, Hanicke W. Localized Proton Spectroscopy Using Stimulated Echoes. Journal of Magnetic Resonance. 1987;72(3):502–508. [Google Scholar]
- 16.Nelson SJ. Analysis of volume MRI and MR spectroscopic imaging data for the evaluation of patients with brain tumors. Magn Reson Med. 2001;46(2):228–239. doi: 10.1002/mrm.1183. [DOI] [PubMed] [Google Scholar]
- 17.Hajnal JV, et al. A Registration and Interpolation Procedure for Subvoxel Matching of Serially Acquired Mr-Images. Journal of Computer Assisted Tomography. 1995;19(2):289–296. doi: 10.1097/00004728-199503000-00022. [DOI] [PubMed] [Google Scholar]
- 18.Nelson SJ. Multivoxel magnetic resonance spectroscopy of brain tumors. Mol Cancer Ther. 2003;2(5):497–507. [PubMed] [Google Scholar]
- 19.Mescher M, et al. Simultaneous in vivo spectral editing and water suppression. NMR Biomed. 1998;11(6):266–272. doi: 10.1002/(sici)1099-1492(199810)11:6<266::aid-nbm530>3.0.co;2-j. [DOI] [PubMed] [Google Scholar]
- 20.Star-Lack J, et al. Improved water and lipid suppression for 3D PRESS CSI using RF band selective inversion with gradient dephasing (BASING) Magn Reson Med. 1997;38(2):311–321. doi: 10.1002/mrm.1910380222. [DOI] [PubMed] [Google Scholar]
- 21.Provencher SW. Estimation of Metabolite Concentrations from Localized in-Vivo Proton Nmr-Spectra. Magnetic Resonance in Medicine. 1993;30(6):672–679. doi: 10.1002/mrm.1910300604. [DOI] [PubMed] [Google Scholar]
- 22.Pels P, et al. Quantification of prostate MRSI data by model-based time domain fitting and frequency domain analysis. Nmr in Biomedicine. 2006;19(2):188–197. doi: 10.1002/nbm.1008. [DOI] [PubMed] [Google Scholar]
- 23.Van Huffel S, et al. Automatic frequency alignment and quantitation of single resonances in multiple magnetic resonance spectra via complex principal component analysis. Journal of Magnetic Resonance. 2002;158(1–2):1–14. doi: 10.1016/s1090-7807(02)00055-1. [DOI] [PubMed] [Google Scholar]
- 24.Kimura H, et al. Metabolic Alterations in the Neonate and Infant Brain during Development - Evaluation with Proton Mr Spectroscopy. Radiology. 1995;194(2):483–489. doi: 10.1148/radiology.194.2.7529934. [DOI] [PubMed] [Google Scholar]
- 25.Vigneron DB, et al. Three-dimensional proton MR spectroscopic imaging of premature and term neonates. AJNR Am J Neuroradiol. 2001;22(7):1424–1433. [PMC free article] [PubMed] [Google Scholar]
- 26.Kreis R, et al. Brain metabolite composition during early human brain development as measured by quantitative in vivo 1H magnetic resonance spectroscopy. Magn Reson Med. 2002;48(6):949–958. doi: 10.1002/mrm.10304. [DOI] [PubMed] [Google Scholar]
- 27.Kreis R, Ernst T, Ross BD. Development of the human brain: in vivo quantification of metabolite and water content with proton magnetic resonance spectroscopy. Magn Reson Med. 1993;30(4):424–437. doi: 10.1002/mrm.1910300405. [DOI] [PubMed] [Google Scholar]
- 28.Kantarci K, et al. H-1 MR spectroscopy in common dementias. Neurology. 2004;63(8):1393–1398. doi: 10.1212/01.wnl.0000141849.21256.ac. [DOI] [PMC free article] [PubMed] [Google Scholar]
- 29.Barkovich AJ. Pediatric neuroimaging. Philadelphia: Lippincott Williams & Wilkins; 2000. Normal Development; pp. 13–69. [Google Scholar]
- 30.Haseler LJ, et al. Evidence from proton magnetic resonance spectroscopy for a metabolic cascade of neuronal damage in shaken baby syndrome. Pediatrics. 1997;99(1):4–14. doi: 10.1542/peds.99.1.4. [DOI] [PubMed] [Google Scholar]
- 31.Ross BD, et al. H-1 MRS in acute traumatic brain injury. Jmri-Journal of Magnetic Resonance Imaging. 1998;8(4):829–840. doi: 10.1002/jmri.1880080412. [DOI] [PubMed] [Google Scholar]
- 32.Makoroff KL, et al. Elevated lactate as an early marker of brain injury in inflicted traumatic brain injury. Pediatric Radiology. 2005;35(7):668–676. doi: 10.1007/s00247-005-1441-7. [DOI] [PubMed] [Google Scholar]
- 33.Boddaert N, et al. 1H MRS spectroscopy evidence of cerebellar high lactate in mitochondrial respiratory chain deficiency. Molecular Genetics and Metabolism. 2008;93(1):85–88. doi: 10.1016/j.ymgme.2007.09.003. [DOI] [PubMed] [Google Scholar]
- 34.Fan G, et al. Hypoxia-ischemic encephalopathy in full-term neonate: correlation proton MR spectroscopy with MR imaging. Eur J Radiol. 2003;45(2):91–98. doi: 10.1016/s0720-048x(02)00021-9. [DOI] [PubMed] [Google Scholar]
- 35.Zarifi MK, et al. Prediction of adverse outcome with cerebral lactate level and apparent diffusion coefficient in infants with perinatal asphyxia. Radiology. 2002;225(3):859–870. doi: 10.1148/radiol.2253011797. [DOI] [PubMed] [Google Scholar]
- 36.Zhu WZ, et al. Proton magnetic resonance spectroscopy in neonates with hypoxic-ischemic injury and its prognostic value. Translational Research. 2008;152(5):225–232. doi: 10.1016/j.trsl.2008.09.004. [DOI] [PubMed] [Google Scholar]
- 37.Ashwal S, et al. Proton spectroscopy detected myoinositol in children with traumatic brain injury. Pediatric Research. 2004;56(4):630–638. doi: 10.1203/01.PDR.0000139928.60530.7D. [DOI] [PubMed] [Google Scholar]
- 38.Holshouser BA, et al. Proton MR spectroscopy in children with acute brain injury: Comparison of short and long echo time acquisitions. Jmri-Journal of Magnetic Resonance Imaging. 2000;11(1):9–19. doi: 10.1002/(sici)1522-2586(200001)11:1<9::aid-jmri2>3.0.co;2-6. [DOI] [PubMed] [Google Scholar]
- 39.Dydak U, et al. Sensitivity-encoded spectroscopic imaging. Magn Reson Med. 2001;46(4):713–722. doi: 10.1002/mrm.1250. [DOI] [PubMed] [Google Scholar]
- 40.Ozturk E, et al. Partially parallel MR spectroscopic imaging of gliomas at 3T. Conf Proc IEEE Eng Med Biol Soc; 2006. pp. 493–496. [DOI] [PubMed] [Google Scholar]
- 41.Cunningham CH, et al. Design of flyback echo-planar readout gradients for magnetic resonance spectroscopic imaging. Magn Reson Med. 2005;54(5):1286–1289. doi: 10.1002/mrm.20663. [DOI] [PubMed] [Google Scholar]
- 42.Kim DH, Gu M, Spielman DM. Gradient moment compensated magnetic resonance spectroscopic imaging. Magn Reson Med. 2009;61(2):457–461. doi: 10.1002/mrm.21832. [DOI] [PMC free article] [PubMed] [Google Scholar]
- 43.Kim DH, et al. Fast 3D (1)H MRSI of the corticospinal tract in pediatric brain. J Magn Reson Imaging. 2009;29(1):1–6. doi: 10.1002/jmri.21394. [DOI] [PMC free article] [PubMed] [Google Scholar]
- 44.Mayer D, et al. Fast parallel spiral chemical shift imaging at 3T using iterative SENSE reconstruction. Magn Reson Med. 2008;59(4):891–897. doi: 10.1002/mrm.21572. [DOI] [PMC free article] [PubMed] [Google Scholar]
- 45.Posse S, et al. Single-shot magnetic resonance spectroscopic imaging with partial parallel imaging. Magn Reson Med. 2009;61(3):541–547. doi: 10.1002/mrm.21855. [DOI] [PMC free article] [PubMed] [Google Scholar]
- 46.Chen AP, et al. High-speed 3T MR spectroscopic imaging of prostate with flyback echo-planar encoding. Journal of Magnetic Resonance Imaging. 2007;25(6):1288–1292. doi: 10.1002/jmri.20916. [DOI] [PubMed] [Google Scholar]
- 47.Hurd R, et al. Measurement of brain glutamate using TE-averaged PRESS at 3T. Magnetic Resonance in Medicine. 2004;51(3):435–440. doi: 10.1002/mrm.20007. [DOI] [PubMed] [Google Scholar]
- 48.Dreher W, Leibfritz D. Detection of homonuclear decoupled in vivo proton NMR spectra using constant time chemical shift encoding: CT-PRESS. Magnetic Resonance Imaging. 1999;17(1):141–150. doi: 10.1016/s0730-725x(98)00156-8. [DOI] [PubMed] [Google Scholar]
- 49.Li Y, et al. Three-dimensional J-resolved H-1 magnetic resonance spectroscopic imaging of volunteers and patients with brain tumors at 3T. Magn Reson Med. 2007;58(5):886–892. doi: 10.1002/mrm.21415. [DOI] [PubMed] [Google Scholar]
- 50.Mayer D, Spielman DM. Detection of glutamate in the human brain at 3 T using optimized constant time point resolved spectroscopy. Magn Reson Med. 2005;54(2):439–442. doi: 10.1002/mrm.20571. [DOI] [PubMed] [Google Scholar]


