

Abstract
To identify molecules that could enhance sweetness perception, we undertook the screening of a compound library using a cell-based assay for the human sweet taste receptor and a panel of selected sweeteners. In one of these screens we found a hit, SE-1, which significantly enhanced the activity of sucralose in the assay. At 50 μM, SE-1 increased the sucralose potency by >20-fold. On the other hand, SE-1 exhibited little or no agonist activity on its own. SE-1 effects were strikingly selective for sucralose. Other popular sweeteners such as aspartame, cyclamate, and saccharin were not enhanced by SE-1 whereas sucrose and neotame potency were increased only by 1.3- to 2.5-fold at 50 μM. Further assay-guided chemical optimization of the initial hit SE-1 led to the discovery of SE-2 and SE-3, selective enhancers of sucralose and sucrose, respectively. SE-2 (50 μM) and SE-3 (200 μM) increased sucralose and sucrose potencies in the assay by 24- and 4.7-fold, respectively. In human taste tests, 100 μM of SE-1 and SE-2 allowed for a reduction of 50% to >80% in the concentration of sucralose, respectively, while maintaining the sweetness intensity, and 100 μM SE-3 allowed for a reduction of 33% in the concentration of sucrose while maintaining the sweetness intensity. These enhancers did not exhibit any sweetness when tasted on their own. Positive allosteric modulators of the human sweet taste receptor could help reduce the caloric content in food and beverages while maintaining the desired taste.
Keywords: enhancer, sweetness, perception, sucrose
The steady increase of the daily consumption of dietary sugar over the last decades may have contributed to the obesity crisis and the early onset of type-II diabetes observed in many developed countries (1, 2). As a result, food and beverage companies have launched a plethora of diet brands where sugar has been partly or fully replaced by noncaloric sweeteners to decrease caloric intake. Currently some of the commonly used noncaloric sweeteners include saccharin, aspartame, cyclamate, sucralose, and acesulfame K (3, 4). However, none of these substances can completely reproduce the taste of sugar. These sweeteners all suffer from one or more shortcomings including a bitter or metallic aftertaste at high concentrations, limiting their use to lower concentrations, or temporal issues such as a delayed sweet taste onset, a lingering sweet aftertaste, or a limited maximum sweetness intensity (4, 5). Another appealing approach to address the problem, in addition to looking for novel noncaloric sweeteners, would be to find molecules capable of enhancing sweetness perception. Ideally, such an enhancer molecule would not elicit sweetness on its own but it would boost the sweetness intensity of a lower amount of sweetener or sugar. Such enhancers could therefore allow for a reduction in the amount of sugar, and calories, in food and beverages while maintaining the desired taste. Similarly, a sweet taste enhancer could allow for a reduction in the amount of noncaloric sweeteners used in “0”-calorie diet brands, decreasing the associated bitterness, lingering tastes, and other off-tastes observed at high concentrations (4, 5) and therefore potentially improving the palatability and flavor profile of several consumer products.
Sweet taste is mediated by an obligate heterodimeric receptor composed of two distinct subunits (G protein-coupled receptors, GPCRs), T1R2 and T1R3, located at the surface of taste receptor cells in the taste buds (6, 7). These subunits, members of family C GPCRs, possess a large extracellular N-terminal domain, the Venus flytrap domain (VFT), linked to the seven-transmembrane C-terminal domain (TMD) by a shorter cysteine-rich domain (6 –8). Every one of these three domains contains agonist binding sites, explaining sweet receptor activation by a vast repertoire of chemically distinct molecules. Sucrose and noncaloric sweeteners such as aspartame and neotame interact within the VFT of T1R2 (9, 10), other noncaloric sweeteners such as cyclamate and neohesperidin dihydrochalcone (NHDC) interact within the TMD of T1R3 (10 –12), S819, a synthetic sweet agonist, interacts with the TMD of T1R2 (10), and the sweet-tasting protein brazzein requires the cysteine-rich domain of human T1R3 to activate the receptor (13).
Family C GPCRs seem ideal targets for allosteric modulation. The savory (umami) taste receptor, a close relative to the human sweet taste receptor, is significantly enhanced by 5′-ribonucleotides (6, 14). Positive allosteric modulators (PAMs) have also been identified for the GABAB receptor, the calcium sensing receptor, and several subtypes of the metabotropic glutamate receptor (mGluR) family (15, 16). In all cases, the PAMs show little or no agonist activity on their own but significantly enhance the activity of the agonist on the receptor and, in functional assays, this behavior is depicted by a leftward shift of the agonist dose–response in the presence of the PAM (16 –18). We report here the identification of a unique chemical class of PAMs for the human sweet taste receptor. These PAMs considerably increase the sucralose and sucrose potencies in a sweet taste receptor cell-based assay, are not sweet on their own, and significantly enhance the sweetness of sucralose or sucrose in taste tests.
Results and Discussion
Identification and Characterization of a PAM for the Human Sweet Taste Receptor.
We have developed a very sensitive cell-based assay for the detection of human sweet taste receptor modulators. In this assay system, the human sweet taste receptor couples to the promiscuous G protein Gα15 to induce PLC activation, causing a net increase in calcium mobilization inside cells (10, 19). We have now carefully characterized and quantified the effects of >50 different known sweeteners to validate the assay (19). The human T1R2/T1R3 receptor is activated by every sweetener that we have tested and their relative potency in the assay correlates tightly with their relative sweetness intensity in human taste tests (19). Using this assay, we undertook screening of our corporate collection of compounds against carbohydrate sweeteners such as sucrose and fructose and several commercially relevant noncaloric sweeteners including aspartame, rebaudiosideA, and sucralose. Sucralose is highly related to sucrose and is currently sold under the brand Splenda (see structure in Table 1). Our sucralose screen generated the first hit, SE-1 (Fig. 1A), exhibiting the typical behavior of a PAM. Application of SE-1, on its own, did not produce any agonist activity but significantly enhanced the activity produced by the subsequent addition of a suboptimal concentration of sucralose (Fig. 1B). The SE-1 effect was dose dependent, with an EC50 of 3.0 ± 1.1 μM (average ± SD; n = 6) and could be observed only in the presence of sucralose (Fig. 1C). Indeed, SE-1 at concentrations as high as 75 μM produced little or no agonist activity when tested on its own (Fig. 1C). The enhancement effect of SE-1 could be explained, for the most part, by a considerable increase in the sucralose potency in the assay. Fig. 1D shows a representative experiment where sucralose dose–response effects were measured in the presence of various concentrations of SE-1. At a final concentration of 1 μM (after sweetener addition), SE-1 shifted the sucralose dose–response curve to the left and produced an EC50 ratio of 1.5 (Fig. 1D). SE-1 concentrations of 3, 10, and 30 μM further shifted the sucralose dose–response curve to the left and produced EC50 ratios (or fold enhancement) of 2.5, 6.3, and 19, respectively (Fig. 1D). The enhancement effect of SE-1 was also very reproducible. A fixed concentration of 50 μM SE-1 produced an EC50 ratio of 23 ± 3 (average ± SD; n = 13) (Fig. S1). Similar results were obtained when using a coapplication protocol instead of a preincubation protocol (Materials and Methods), showing that a preincubation of the receptor with SE-1 is not necessary to reveal its enhancement properties (Fig. S2). In addition, SE-1 effects were specific to the human sweet taste receptor because it did not enhance the activity of isoproterenol on the β2-adrenergic receptor or the effect of L-glutamate (MSG) on the umami taste receptor (Fig. S3). A robust binding assay for the human sweet receptor is currently not available. So, we do not know at this time if the increase in sucralose potency, observed in the assay, can be exclusively explained by an increase of the sucralose affinity for the receptor. However, mutagenesis and modeling data suggest that the sweet taste enhancers bind in proximity to the sucralose orthosteric binding site in the VFT of hT1R2 (see Zhang et al., in this issue of PNAS) (20). We therefore propose that these enhancers stabilize a VFT conformation with a higher affinity for sucralose.
Table 1.
Evaluation of SE-1 effects on mono- and dichlorosucrose derivatives
| Sweeteners | Y | Z | R1 | R2 | EC50 (μM) | EC50 ratio |
| Sucrose | OH | OH | OH | 41,300 ± 1,550 | 1.3 ± 0.1 | |
| Sucralose | Cl | Cl | Cl | 39 ± 3.0 | 23 ± 3.8* | |
| 1′-Chlorosucrose | OH | Cl | OH | 1,880 ± 305 | 1.7 ± 0.2 ns | |
| 4-Chlorosucrose | Cl | OH | OH | 7,320 ± 1,830 | 2.8 ± 0.8*** | |
| 6′-Chlorosucrose | OH | OH | Cl | 9,100 ± 2,910 | 2.8 ± 0.9*** | |
| 1′,4-Dichlorosucrose | Cl | Cl | OH | 275 ± 49 | 3.6 ± 0.3*,**** | |
| 1′,6′-Dichorosucrose | OH | Cl | Cl | 473 ± 59 | 4.2 ± 0.6**,**** | |
| 4,6′-Dichlorosucrose | Cl | OH | Cl | 720 ± 100 | 23 ± 3.8*, NS |
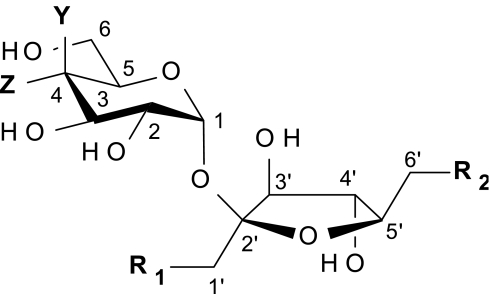
Dose–response effects of depicted sweeteners were monitored after the cells had been preexposed to D-PBS or 75 μM SE-1 (50 μM final concentration). EC50’s and EC50 ratios produced by SE-1 were calculated for each sweetener (see Fig. S4 for representative results). Values correspond to an average ± SD of a least three independent experiments performed in triplicate. *, P < 0.0001 vs. EC50 ratio obtained with sucrose. **, P < 0.01 vs. EC50 ratio obtained with sucrose. ***, P < 0.05 vs. EC50 ratio obtained with sucrose. ****, P < 0.0001 vs. EC50 ratio obtained with sucralose; ns, no significant difference vs. EC50 ratio obtained with sucrose; NS, no significant difference vs. EC50 ratio obtained with sucralose, Student's t test.
Fig. 1.

Identification of a PAM for the human sweet receptor. (A) Chemical structure of SE-1. (B) SE-1 enhances sucralose-evoked increases in [Ca2+]int. Application of 75 μM SE-1 or D-PBS (A) did not evoke an increase in fluorescence. Subsequent application of 20 μM sucralose (final concentration) (B) produced a much greater increase in [Ca2+]int and fluorescence, on cells preexposed to SE-1 than on cells preexposed to D-PBS. (C) Dose–response effect of SE-1 on its own (•) and on the sucralose-evoked increase in [Ca2+]int (○). Cells were stimulated with SE-1 at concentrations up to 75 μM and the change in [Ca2+]int was monitored over the first 90 sec postaddition. At 220 sec, a suboptimal concentration of sucralose (10 μM final concentration) was then added onto the cells and the subsequent change in [Ca2+]int was monitored. SE-1 dose-dependently enhanced the sucralose effect with an EC50 of 3.0 ± 1.1 μM (average ± SD; n = 6). (D) SE-1 increases the sucralose potency in the assay. Sucralose dose–response effects were monitored after the cells had been preexposed to various concentrations of SE-1 of 1.5, 4.5, 15, and 45 μM, producing the depicted final enhancer concentrations after sweetener addition. In this representative experiment, the sucralose EC50 value was decreased from 60 μM to 39, 24, 9.4, and 3.3 μM at 1, 3, 10, and 30 μM of SE-1, respectively. (E) SE-1 is highly selective for sucralose. Cells were preexposed to either D-PBS or 75 μM SE-1 and 220 sec later, suboptimal concentrations of depicted sweeteners were added into the wells (bringing SE-1 concentration down to 50 μM final) and cell responses were monitored on the FLIPR system. Final concentrations of sweeteners used were as follows: 15 μM sucralose, 150 nM neotame, 25 mM sucrose, 5 μM alitame, 100 μM aspartame, 30 μM saccharin, 10 μM dulcin, 15 μM stevioside, 300 μM cyclamate, 10 μM mogroside, 1 μM perillartine, 20 μM glyccyrhizic acid, 13 μM NHDC, and 4 μM thaumatin. SE-1 significantly enhanced the effect of sucralose (***, P < 0.0001, Student's t test), neotame (**, P < 0.001), and sucrose (*, P < 0.05). Data points in C–E correspond to an average ± SD of a triplicate determination.
To evaluate SE-1 selectivity we screened several additional sweeteners at suboptimal concentrations (producing 10–20% receptor activity) and using a high concentration of SE-1 (50 μM). Under these conditions, SE-1 did not enhance the effect of the peptidic sweeteners alitame and aspartame or the effects of saccharin, dulcin, stevioside, cyclamate, mogroside, perillartine, glyccyrhizic acid, NHDC, and the sweet protein thaumatin (Fig. 1E). Among all of the sweeteners evaluated, SE-1 enhanced only neotame and sucrose activity, albeit to a much lower extent than what was observed with sucralose. SE-1 increased the neotame potency by 2.5 ± 0.5-fold (average ± SD; n = 7) (Fig. S1) and the sucrose potency by 1.3 ± 0.1-fold (n = 3) (Table 1). The lack of major enhancement of sucrose by SE-1 is intriguing because sucralose is, in fact, a trichloro derivative of sucrose (1′,4,6′-trichlorosucrose; see Table 1 for structure). To understand the structure–activity relationship between sucralose and SE-1, mono- and disubstituted chlorosucrose derivatives were synthesized and tested for enhancement in the assay. Addition of 1′-chloro or 6′-chloro to the fructose moiety of sucrose or of 4-chloro to the glucose moiety of sucrose increased the agonist potency (over that of sucrose) by 22-, 4.5-, and 6.5-fold, respectively (Table 1 and Fig. S4). The magnitude of SE-1 enhancement of 1′-chlorosucrose remained comparable to what was seen with sucrose. 4-Chlorosucrose and 6′-chlorosucrose achieved a significant improvement of enhancement over that of sucrose by ~2-fold (Table 1 and Fig. S4). 1′,4-Dichlorosucrose and 1′,6′-dichlorosucrose had improved agonist potencies over the monosubstituted sucrose derivatives, being 150- and 87-fold more potent than sucrose. SE-1 had a more pronounced effect on these disubstituted derivatives relative to the monosubstituted derivatives, significantly improving the enhancement by ~3-fold over that of sucrose. However, none of these molecules could be enhanced to the same extent as sucralose (Table 1 and Fig. S4). Strikingly, the 4,6′-dichlorosucrose derivative was enhanced by SE-1 to the same extent as sucralose, even if it was 18-fold less potent as an agonist (Table 1 and Fig. S4). Taken together, these data suggest that the 1′-chloro position mainly contributes to the binding affinity of sucralose whereas the 4-chloro and 6′-chloro positions contribute to the binding affinity of sucralose and, in combination, are also essential and sufficient for the enhancement effect of SE-1.
SE-1 Enhances the Sweet Taste of Sucralose.
Human panelists were trained over several weeks to precisely score, on a 15-point linear scale, the sweetness intensity of sucralose solutions using a percentage of sucrose (weight/volume) equivalence scale (Materials and Methods). A solution of 100 ppm sucralose solution (251 μM) had a similar sweetness intensity to a 6% (wt/vol) sucrose solution (175 mM) (Fig. 2B), a concentration producing roughly half the maximum sweetness intensity. Addition of 100 μM SE-1 to the 100-ppm sucralose solution enhanced the sweetness intensity to levels produced by 200 ppm (502 μM) to 300 ppm (753 μM) sucralose solutions (Fig. 2B). SE-1 therefore allowed for a reduction of the sucralose concentration by 2- to 3-fold while maintaining the sweetness intensity. SE-1 behaved as a pure enhancer in taste tests because it was not sweet when evaluated on its own (Fig. 2A), in agreement with the cell-based assay results (Fig. 1C). However, SE-1 did exhibit a bitter off-taste when tasted on its own (Fig. S5). Contrary to the marked effect on sucralose, SE-1 could not significantly enhance the effect of sucrose in taste tests (Fig. 2C) even though we detected a small but reproducible enhancement effect in the cell assay (Table 1). Our in vitro assay is more sensitive than taste tests and we have observed that ≥3-fold enhancement is typically necessary to detect effects in taste tests.
Fig. 2.

Evaluation of SE-1 effects in human taste tests. (A) SE-1 is not sweet on its own. Panelists (n = 15) were asked to rate the sweetness intensity of the depicted solutions, presented in a random fashion. A solution containing 100 μM SE-1 was not sweet and produced the same sweetness intensity score as the buffer control. (B) SE-1 enhances the sweetness intensity of a sucralose solution. Panelists (n = 15) were asked to rate the sweetness intensity of the depicted solutions. The data set was subjected to an analysis of variance followed by a Tukey's honestly significant difference test. Solutions producing significantly different sweetness intensity scores from one another (P < 0.05) were assigned different letters, depicted on the graph. SE-1 (100 μM) enhanced the sweetness intensity score of a 100-ppm sucralose solution from 5.7 ± 0.4 to 9.5 ± 0.9 (average ± SEM) or to levels equivalent to those produced by the 200-ppm and the 300-ppm sucralose solutions. (C) SE-1 does not enhance the sweetness intensity of a sucrose solution. Panelists (n = 16) were asked to rate the sweetness intensity of the depicted solutions and the data set was analyzed as described in B.
Identification of Other PAMs by Lead Optimization.
During the course of these studies, we discovered that concentrated stocks (>10 mM) of SE-1 in DMSO produced a dimer by reduction of the thiol group. Also, we felt that this thiol group could potentially contribute to the bitter off-taste of SE-1 (21). We therefore replaced the thiol of SE-1 by a ketone, producing SE-2 (Fig. 3A). SE-2 was also a potent enhancer of sucralose, with an EC50 of 22 ± 4.5 μM (average ± SD; n = 3) (Fig. 3B), and it increased the sucralose potency by 11 ± 1.7-fold and 23 ± 1.5-fold at 25 and 50 μM, respectively (average ± SD; n = 3) (Fig. 3C). SE-2 showed little or no agonist activity (Fig. 3B). Surprisingly, in taste tests, SE-2 was noticeably more effective than SE-1 (Fig. 4B). SE-2 (100 μM) significantly enhanced the sweetness intensity of a 100-ppm sucralose solution (251 μM) to levels produced by 400 ppm (1.004 mM) to 600 ppm (1.506 mM) sucralose solutions (Fig. 4B). The enhancement effect of SE-2 was also dose dependent. Concentrations as low as 3.12 μM enhanced the sucralose sweetness intensity and increasing concentrations of SE-2 further enhanced the sweet taste (Fig. 4C). We also evaluated lower concentrations of sucralose with a fixed concentration of enhancer. At 100 μM, SE-2 significantly enhanced the sweetness intensity of a 12.5-ppm sucralose solution (31 μM) to levels produced by a 100-ppm sucralose solution (251 μM) (Fig. 4D). Thus, 100 μM SE-2 allowed for a ≥80% reduction of the sucralose concentration while maintaining the desired level of sweetness intensity and, importantly, when evaluated on its own, SE-2 did not taste sweet (Fig. 4A) and it was not bitter (Fig. S5). We do not know at this point why SE-2 that is roughly seven times less potent than SE-1 in the assay (Fig. 3B) is a better enhancer in taste tests. A possibility could be that SE-2 stabilizes the active form of the sweet receptor in a conformation that signals better with gustducin, the G protein used by taste receptors in taste receptor cells (22, 23). For example, certain PAMs for mGluR1 have a 1,000-fold lower potency at enhancing the agonist-induced Gs-coupled cAMP accumulation versus the agonist-induced Gq-coupled calcium mobilization (24). The absence of a bitter off-taste in SE-2 could also improve the apparent enhancement properties in taste tests. We routinely observed that the magnitude of enhancement in taste tests is not as robust as the enhancement reported in the cell-based assay, even under conditions where a lower amount of sweetener is used (Fig. 4D). Performing detection threshold taste tests (in the presence and absence of enhancers) would probably result in enhancement factors that are closer to those seen in the assay. In addition to the potential limitations of the screening platform using forced coupling of the sweet receptor to a promiscuous G protein, a limited accessibility of the enhancers to the taste pores could produce taste enhancement values that markedly differ from the enhancement values obtained in our cell-based assay where the sweet taste receptor is readily available for interaction with the modulator.
Fig. 3.

Identification of additional PAMs selective for sucralose and sucrose. (A) Chemical structure of SE-2. (B) Dose–response effect of SE-1 (□) and SE-2 (■) on the sucralose-evoked increase in [Ca2+]int. Cells were stimulated with SE-1 and SE-2 at concentrations up to 75 μM. At 220 sec, a suboptimal concentration of sucralose (10 μM final concentration) was then added onto the cells and the subsequent change in [Ca2+]int was monitored. SE-1 and SE-2 dose-dependently enhanced the sucralose effect with EC50’s of 3.0 ± 1.1 μM (average ± SD; n = 6) and 22 ± 4.5 μM (average ± SD; n = 3), respectively. At 75 μM, SE-2 (●) and SE-1 (○) did not show agonist activity. (C) SE-2 increases the sucralose potency in the assay. Sucralose dose–response effects were performed, using a coapplication protocol (see Materials and Methods), in the presence of increasing concentrations of SE-2, as depicted on the graph. In this representative experiment, the sucralose EC50 value was decreased from 120 μM to 52, 21, 8.9, and 4.9 μM at 3, 12.5, 25, and 50 μM SE-2, respectively. (D) Chemical structure of SE-3. (E) SE-3 increases the sucrose potency in the assay. Sucrose dose–response effects were performed, using a coapplication protocol, in the presence of increasing concentrations of SE-3, as depicted on the graph. In this representative experiment, the sucrose EC50 value was decreased from 62 mM to 42, 32, 23, and 14 mM at 25, 50, 100, and 200 μM SE-3, respectively. (F) SE-3 increases the sucralose potency in the assay. Sucralose dose–response effects were performed, using a coapplication protocol, in the presence of increasing concentrations of SE-3, as depicted on the graph. In this representative experiment, the sucralose EC50 value was decreased from 59 μM to 26, 14, 7.5, and 3.0 μM at 25, 50, 100, and 200 μM SE-3, respectively. Data points in B, C, E, and F correspond to an average ± SD of a triplicate determination.
Fig. 4.

Evaluation of SE-2 and SE-3 effects in human taste tests. (A) SE-2 is not sweet on its own. Panelists (n = 12) were asked to rate the sweetness intensity of the depicted solutions. A solution containing 100 μM SE-2 was not sweet and produced the same sweetness intensity score as the buffer control. (B) SE-2 enhances the sweetness intensity of a sucralose solution. Panelists (n = 12) were asked to rate the sweetness intensity of the depicted solutions. The data set was subjected to an analysis of variance followed by a Tukey's honestly significant difference test. Solutions producing significantly different sweetness intensity scores from one another (P < 0.05) were assigned different letters, depicted on the graph. SE-2 (100 μM) enhanced the sweetness intensity score of a 100-ppm sucralose solution from 7.4 ± 0.4 to 13.3 ± 0.5 (average ± SEM) or to levels equivalent to those produced by the 400- and 600-ppm sucralose solutions. (C) SE-2 sweet taste enhancement effect is dose dependent. Panelists (n = 13, two replicates) were asked to rate the sweetness intensity of the depicted solutions and the data set was analyzed as described in B. SE-2 at concentrations of 3.12, 6.25, 12.5, 25, and 50 μM enhanced the sweetness intensity score of a 100-ppm solution from 6.3 ± 0.3 to 7.4 ± 0.3, 8.4 ± 0.4, 9.1 ± 0.4, 10.3 ± 0.3, and 12.3 ± 0.3 (average ± SEM), respectively. (D) SE-2 enhances lower concentrations of sucralose. Panelists (n = 14, two replicates) were asked to rate the sweetness intensity of the depicted solutions and the data set was analyzed as described in B. Adding 100 μM SE-2 to a 12.5-ppm sucralose solution produced the same sweetness intensity score as the 100-ppm sucralose solution. (E) SE-3 is not sweet on its own. Panelists (n = 14) were asked to rate the sweetness intensity of the depicted solutions. A solution containing 100 μM SE-3 was not sweet and produced the same sweetness intensity score as the buffer control. (F) SE-3 enhances the sweetness intensity of a sucrose solution. Panelists (n = 14) were asked to rate the sweetness intensity of the depicted solutions and the data set was analyzed as described in B. SE-3 (100 μM) enhanced the sweetness intensity score of a 6% sucrose solution from 6.6 ± 0.2 to 8.2 ± 0.3 (average ± SEM) or to levels equivalent to those produced by the 8, 9, and 10% sucrose solutions.
The close structural similarity between sucralose and sucrose (Table 1) prompted us to investigate the structure activity relationship of SE-1 to see if we could find sweet taste enhancers for sucrose. We synthesized several analogs of SE-1 and identified SE-3 as a proof-of-concept sucrose enhancer (Fig. 3D). At 50, 100, and 200 μM, SE-3 increased the potency of sucrose in the assay by 2 ± 0.3-fold, 3 ± 0.7-fold, and 5.1 ± 0.4-fold (average ± SD; n = 3–6), respectively (Fig. 3E). On the contrary, at 200 μM SE-1 increased the potency of sucrose only by 2.0 ± 0.1-fold (average ± SD; n = 3) (Fig. S6), showing that these molecules are indeed different in their abilities to enhance the sucrose-induced receptor activation in the cell-based assay. SE-3 was less potent than SE-1 and SE-2 as a sucralose enhancer. At 50, 100, and 200 μM, SE-3 increased the potency of sucralose by 4 ± 0.3-fold, 7.8 ± 0.9-fold, and 19 ± 0.7-fold (average ± SD; n = 3), respectively (Fig. 3F). In taste tests, 100 μM SE-3 enhanced the sweetness intensity of a 6% sucrose solution (175 mM) to levels corresponding to 8% (233 mM) to 10% (291 mM) sucrose solutions (Fig. 4F). Similarly to SE-1 and SE-2, SE-3 did not exhibit a sweet taste on its own (Fig. 4E) and it was not bitter (Fig. S5). In agreement with in vitro data, SE-3 could also enhance sucralose sweetness intensity albeit to a lower extent than what was observed with SE-2 (Fig. S7).
Our prototypical sweet taste enhancers SE-1, SE-2, and SE-3 are unique examples of PAMs for the human sweet taste receptor. Up to now, sweetness enhancement has been reported only for sweetener combinations apparently showing modest synergistic effects in taste tests (25, 26). However, results from studies measuring the effect of sweetener combinations are difficult to interpret because of the inherent sweetness of each of the mixture components and their different psychophysical functions (their relative sweetness intensity at increasing concentrations) (27). For this reason, such studies have sometimes led to contradictory results raising questions about the reality of synergism between sweeteners or the mechanism of action of synergy (26, 28, 29). In contrast, the PAMs reported in this study are not agonists and do not taste sweet on their own, strikingly simplifying the measurement of enhancement properties and interpretation of the results. SE-2 enhances the sucralose sweetness in human taste tests with an unparalleled magnitude (by up to 8-fold) whereas our proof-of-concept sucrose enhancer, SE-3, enhances the sucrose sweetness by 1.3- to 1.5-fold. So, PAMs for the sweet taste receptor may offer an alternative or complementary approach to lower the caloric content of food and beverages while maintaining the desired taste. Of interest, efficacious enhancers such as SE-2 or its derivatives could potentially improve the palatability of sucralose-sweetened products. By decreasing the amount of sucralose, the associated bitterness, dominating licorice note, dryness, and lingering could be attenuated or even be eliminated (4, 5, 30). Perhaps of even greater importance, further optimization of SE-3 could lead to more efficacious enhancers allowing for a drastic reduction in the caloric content of sucrose-sweetened consumer products. SE-2 and SE-3 did not exhibit a bitter taste or any other off-taste at the concentrations used in this study. More importantly, no change in the sweet taste quality has been observed. Neither SE-2 nor SE-3 makes the sweet taste of sucralose or sucrose last longer.
The astonishing sweetener selectivity for these enhancers is at the core of their mechanism of action within the VFT (20). Multiple PAMs have been identified for the mGluRs, the GABAB receptor, and the calcium sensing receptor (15, 16), and they all bind to the TMD. In contrast, hits that interact with the TMD of sweet taste receptor are agonists (10, 18). This could be due to the significant level of constitutive activity of the sweet taste receptor (31), which would enable the active molecules interacting within the TMD to elicit a significant agonist activity and perceptible level of sweet taste (17). A continuing research and screening effort should allow us to discover additional selective enhancers for other commercially relevant sweeteners acting within the VFT of the sweet taste receptor.
Materials and Methods
Sweeteners.
The following sweeteners and antagonists were purchased from Sigma-Aldrich: aspartame, acesulfame K, sucrose, cyclamate (sodium salt), and thaumatin. Stevioside was from Emperors Herbologists. Perillartine was from Pfaltz & Bauer. Dulcin was from Maybridge. NHDC was from Indofine. Sucralose was from Toronto Research Chemicals. The following sweeteners were kindly provided by Grant DuBois at The Coca-Cola Company: glycyrrhizic acid monoammonium salt, neotame, and mogroside. Alitame (Aclame) was a generous gift from The Coca-Cola Company and Danisco.
Fluorometric Imaging Plate Reader (FLIPR) Assays.
hT1R2/R3-HEK293 Gα15 cells (6) were seeded in 384-well clear bottom plates (Fisher) at a density of ~32,000 cells/well and grown overnight. Where indicated, to test the specificity on enhancers, cells expressing the umami taste receptor, hT1R1/R3-HEK293 Gα15 cells, were used (Fig. S3). In these cells, expression of the T1R1 and T1R3 subunits is under the control of a mifepristone-inducible mammalian expression system where mefipristone acts as an agonist to activate gene transcription by binding to a truncated human progesterone receptor (GeneSwitch System; Invitrogen). On the day of the experiment, hT1R2/R3-HEK293 Gα15 cells or mifepristone-induced hT1R1/R3-HEK293 Gα15 cells were loaded with the calcium indicator Fluo3 AM (4 μM) (Invitrogen) in D-PBS (Invitrogen), using a Multidrop. Cells were incubated for 1 h at room temperature and excess dye was washed out with D-PBS using an EMBLA cell washer (Molecular Devices), leaving a residual volume of 25 μL/well. After 30 min of rest time at room temperature, Fluo3 AM-loaded cell plates, compound plates, and sweetener plates were loaded into a FLIPR (Molecular Devices). The 384-well compound plates and sweetener plates (Greiner) were prepared at 3× final concentration in D-PBS. Imaging was performed using a 480-nm excitation and a 535-nm emission and was initiated with the acquisition of the baseline fluorescence for a period of 7 sec. The cells were stimulated on line with addition of 25 μL of solution from the compound plate and the resulting change in intracellular calcium concentration ([Ca2+]int) was monitored over the next 90 sec postaddition. At 220 sec, 25 μL of solution from the sweetener plate was added to the cells and the resulting change in [Ca2+]int was monitored for an additional 100 sec. Where indicated, a coapplication protocol was used instead of the preincubation protocol described above. Sweeteners and test compounds were prepared at 4× final concentration and mixed 1:1 in a 384-well Greiner plate (bringing the sweeteners and test compounds concentrations down to 2× final concentration). Imaging was initiated with the acquisition of the baseline fluorescence for a period of 7 sec and then cells were stimulated on line with addition of 25 μL stimuli/well. Subsequent images were acquired every other second for a period of 2 min. Raw fluorescence counts were then normalized in each well (using custom-made data import software) by calculating delta F/f values (maximum fluorescent count obtained after stimulation − minimal fluorescent count obtained before stimulation/minimal fluorescent count obtained before stimulation). EC50’s were determined using a nonlinear regression algorithm (GraphPad PRISM), where the Hill slope, bottom asymptotes, and top asymptotes were allowed to vary. Enhancement properties of test compounds were quantified by determining the magnitude of the leftward shift in the sweeteners’ EC50 values (or an EC50 ratio): the value of the EC50 measured in the absence of the enhancer divided by the value of the EC50 measured in the presence of the enhancer.
Human Taste Tests.
All solutions for tasting were prepared in a low sodium buffer solution (pH 7.1). The buffer solution was prepared with 0.952 g KCl, 5.444 g Na2HPO4, and 0.952 g KH2PO4 in 40 L of deionized ultra-filtered water. Reference samples prepared included buffer alone, 100–600 ppm sucralose, and 6–15% sucrose. Test samples containing sweetness enhancers SE-1, SE-2, or SE-3 in buffer, 100 ppm sucralose, or 6% sucrose were also evaluated. Enhancers were first prepared as 1,000-fold concentrated stock solutions in ethanol to ensure dissolution of the ingredient. The concentrated stock solutions were then diluted 1,000-fold in buffer, sucralose, or sucrose solutions, resulting in a final concentration of 0.1% ethanol. Samples without enhancers were also balanced to contain 0.1% ethanol. A 0.1% ethanol solution did not exhibit sweetness on its own.
Trained panelists from the San Diego area were used for the taste tests. Subjects were instructed not to eat or drink anything (except water) for at least 1 h before the test. The exact number of panelists evaluating the samples is reported with each test. Panelists rinsed their mouths with water before starting any test. Samples were presented monadically to panelists in a randomized, counterbalanced order. Panelists rinsed with water and had up to a 1-min delay to clear the mouth of any tastes after each evaluation. The samples were rated on a 15-point scale for sweetness intensity using a percentage of sucrose equivalence scale, where 0 = 0% sucrose and 15 = 15% sucrose. Data were analyzed using analysis of variance followed by a Tukey's honestly significant difference test to determine statistical significance (α = 0.05).
Supplementary Material
Acknowledgments
We thank B. Moyer, A. Pronin, D. Linemeyer, S. Laporte, and M. Servant for critical reading of the manuscript and A. Ligani, H. Zhou, and A. Rivadeneyra for technical assistance.
Footnotes
The authors declare no conflict of interest.
*This Direct Submission article had a prearranged editor.
This article contains supporting information online at www.pnas.org/cgi/content/full/0911670107/DCSupplemental.
References
- 1.World Health Organization Diet, nutrition and the prevention of chronic diseases. World Health Organ Tech Rep Ser. 2003;916:1–149. [PubMed] [Google Scholar]
- 2.Swinburn BA, Caterson I, Seidell JC, James WP. Diet, nutrition and the prevention of excess weight gain and obesity. Public Health Nutr. 2004;7(1A):123–146. doi: 10.1079/phn2003585. [DOI] [PubMed] [Google Scholar]
- 3.O'Brien Nabors L. Alternative Sweeteners. 2nd ed. New York: Marcel Dekker; 2001. p. 553. revised and expanded. [Google Scholar]
- 4.Schiffman SS, Gatlin CA. Sweeteners: State of knowledge review. Neurosci Biobehav Rev. 1993;17:313–345. doi: 10.1016/s0149-7634(05)80015-6. [DOI] [PubMed] [Google Scholar]
- 5.Schiffman SS, Booth BJ, Losee ML, Pecore SD, Warwick ZS. Bitterness of sweeteners as a function of concentration. Brain Res Bull. 1995;36:505–513. doi: 10.1016/0361-9230(94)00225-p. [DOI] [PubMed] [Google Scholar]
- 6.Li X, et al. Human receptors for sweet and umami taste. Proc Natl Acad Sci USA. 2002;99:4692–4696. doi: 10.1073/pnas.072090199. [DOI] [PMC free article] [PubMed] [Google Scholar]
- 7.Nelson G, et al. Mammalian sweet taste receptors. Cell. 2001;106:381–390. doi: 10.1016/s0092-8674(01)00451-2. [DOI] [PubMed] [Google Scholar]
- 8.Hoon MA, et al. Putative mammalian taste receptors: A class of taste-specific GPCRs with distinct topographic selectivity. Cell. 1999;96:541–551. doi: 10.1016/s0092-8674(00)80658-3. [DOI] [PubMed] [Google Scholar]
- 9.Jiang P, et al. Molecular mechanisms of sweet receptor function. Chem Senses. 2005;30(Suppl 1):i17–i18. doi: 10.1093/chemse/bjh091. [DOI] [PubMed] [Google Scholar]
- 10.Xu H, et al. Different functional roles of T1R subunits in the heteromeric taste receptors. Proc Natl Acad Sci USA. 2004;101:14258–14263. doi: 10.1073/pnas.0404384101. [DOI] [PMC free article] [PubMed] [Google Scholar]
- 11.Jiang P, et al. Identification of the cyclamate interaction site within the transmembrane domain of the human sweet taste receptor subunit T1R3. J Biol Chem. 2005;280:34296–34305. doi: 10.1074/jbc.M505255200. [DOI] [PubMed] [Google Scholar]
- 12.Winnig M, Bufe B, Kratochwil NA, Slack JP, Meyerhof W. The binding site for neohesperidin dihydrochalcone at the human sweet taste receptor. BMC Struct Biol. 2007;7:66. doi: 10.1186/1472-6807-7-66. [DOI] [PMC free article] [PubMed] [Google Scholar]
- 13.Jiang P, et al. The cysteine-rich region of T1R3 determines responses to intensely sweet proteins. J Biol Chem. 2004;279:45068–45075. doi: 10.1074/jbc.M406779200. [DOI] [PubMed] [Google Scholar]
- 14.Nelson G, et al. An amino-acid taste receptor. Nature. 2002;416:199–202. doi: 10.1038/nature726. [DOI] [PubMed] [Google Scholar]
- 15.Bräuner-Osborne H, Wellendorph P, Jensen AA. Structure, pharmacology and therapeutic prospects of family C G-protein coupled receptors. Curr Drug Targets. 2007;8:169–184. doi: 10.2174/138945007779315614. [DOI] [PubMed] [Google Scholar]
- 16.Conn PJ, Christopoulos A, Lindsley CW. Allosteric modulators of GPCRs: A novel approach for the treatment of CNS disorders. Nat Rev. 2009;8:41–54. doi: 10.1038/nrd2760. [DOI] [PMC free article] [PubMed] [Google Scholar]
- 17.Parmentier ML, Prézeau L, Bockaert J, Pin JP. A model for the functioning of family 3 GPCRs. Trends Pharmacol Sci. 2002;23:268–274. doi: 10.1016/s0165-6147(02)02016-3. [DOI] [PubMed] [Google Scholar]
- 18.Zhang F, et al. Molecular mechanism for the umami taste synergism. Proc Natl Acad Sci USA. 2008;105:20930–20934. doi: 10.1073/pnas.0810174106. [DOI] [PMC free article] [PubMed] [Google Scholar]
- 19.Li X, Servant G. In: Sweetness and Sweeteners. Biology, Chemistry and Psychophysics. Weerasinghe DK, Dubois GE, editors. Washington, DC: Oxford Univ Press; 2008. pp. 368–385. [Google Scholar]
- 20.Zhang F, et al. Molecular mechanism of the sweet taste enhancers. Proc Natl Acad Sci USA. 2010:4752–4757. doi: 10.1073/pnas.0911660107. [DOI] [PMC free article] [PubMed] [Google Scholar]
- 21.Rodgers S, Glen RC, Bender A. Characterizing bitterness: Identification of key structural features and development of a classification model. J Chem Inf Model. 2006;46:569–576. doi: 10.1021/ci0504418. [DOI] [PubMed] [Google Scholar]
- 22.McLaughlin SK, McKinnon PJ, Margolskee RF. Gustducin is a taste-cell-specific G protein closely related to the transducins. Nature. 1992;357:563–569. doi: 10.1038/357563a0. [DOI] [PubMed] [Google Scholar]
- 23.Wong GT, Gannon KS, Margolskee RF. Transduction of bitter and sweet taste by gustducin. Nature. 1996;381:796–800. doi: 10.1038/381796a0. [DOI] [PubMed] [Google Scholar]
- 24.Sheffler DJ, Conn PJ. Allosteric potentiators of metabotropic glutamate receptor subtype 1a differentially modulate independent signaling pathways in baby hamster kidney cells. Neuropharmacology. 2008;55:419–427. doi: 10.1016/j.neuropharm.2008.06.047. [DOI] [PMC free article] [PubMed] [Google Scholar]
- 25.Schiffman SS, et al. Investigation of synergism in binary mixtures of sweeteners. Brain Res Bull. 1995;38:105–120. doi: 10.1016/0361-9230(95)00062-j. [DOI] [PubMed] [Google Scholar]
- 26.Schiffman SS, Sattely-Miller EA, Graham BG, Booth BJ, Gibes KM. Synergism among ternary mixtures of fourteen sweeteners. Chem Senses. 2000;25:131–140. doi: 10.1093/chemse/25.2.131. [DOI] [PubMed] [Google Scholar]
- 27.Lawless HT. Theoretical note: Tests of synergy in sweetener mixtures. Chem Senses. 1998;23:447–451. doi: 10.1093/chemse/23.4.447. [DOI] [PubMed] [Google Scholar]
- 28.Birch GG. Modulation of sweet taste. Biofactors. 1999;9:73–80. doi: 10.1002/biof.5520090109. [DOI] [PubMed] [Google Scholar]
- 29.Kroeze JH. Neohesperidin dihydrochalcone is not a taste enhancer in aqueous sucrose solutions. Chem Senses. 2000;25:555–559. doi: 10.1093/chemse/25.5.555. [DOI] [PubMed] [Google Scholar]
- 30.Simons CT, et al. In: Sweetness and Sweeteners. Biology, Chemistry and Psychophysics. Weerasinghe DK, Dubois GE, editors. Washington, DC: Oxford Univ Press; 2008. pp. 335–354. [Google Scholar]
- 31.Galindo-Cuspinera V, Winnig M, Bufe B, Meyerhof W, Breslin PA. A TAS1R receptor-based explanation of sweet ‘water-taste’. Nature. 2006;441:354–357. doi: 10.1038/nature04765. [DOI] [PubMed] [Google Scholar]
Associated Data
This section collects any data citations, data availability statements, or supplementary materials included in this article.