Abstract
An improved high-performance liquid chromatography-mass spectrometry method for the separation and characterization of cardiolipin molecular species is presented. Reverse-phase ion pair chromatography with acidified triethylamine resulted in increased chromatographic retention and resolution when compared with chromatography without acidified triethylamine. Using a hybrid triple quadrupole linear ion trap mass spectrometer to generate MS/MS spectra revealed three regions within each spectrum that could be used to deduce the structure of the cardiolipin molecular species: the diacylglycerol phosphate region, the monoacylglycerol phosphate region, and the fatty acid region. Cardiolipin standards of known composition were analyzed and exhibited expected chromatographic and mass spectral results. Two minor components in commercial bovine heart cardiolipin, (with the same molecular weight but different chromatographic retention times), were shown to differ by fatty acid composition: (C18:2)2(C18:1)2 versus (C18:2)3(C18:0)1. These compounds were then analyzed by HPLC-MS3 to examine specific diac ylglycerol phosphate generated fatty acid fragmentation. Also, two commercial sources of bovine heart cardiolipin were shown to have minor differences in cardiolipin species content. Cardiolipin isolated from rat liver, mouse heart, and dog heart mitochondria were then characterized and the relative distributions of the major cardiolipin species were determined.
Keywords: mitochondria, lipidomics, HPLC-MS, HPLC-MS/MS, HPLC-MS3
Cardiolipin [bis-(1,2-diacyl-sn-glycero-3-phospho)-1' -3′ -sn-glycerol] is a unique phospholipid present in mitochondria (1) and is a component of bacterial membranes (2). In eukaryotic cells, it is present almost exclusively in the inner mitochondrial membrane (3), where it is required for normal mitochondrial function. In bacteria, it has been identified in the cytoplasmic membrane (4). Structurally, the diversity of cardiolipin molecular species is found in both the identity and position of its four fatty acyl moieties; the characterization of these differences and the relative amounts of these different species has been the focus of much investigation (5–9).
We demonstrated the feasibility of characterizing cardiolipin molecular species by reverse-phase HPLC-MS/MS using a quadrupole ion trap mass spectrometer and recursive mass spectrometry (MS, MS/MS, and MS3) (10–12). Following analysis of many samples, we found two areas in this procedure that we wished to improve: 1) the chromatographic conditions yielded variable retention time results with the resolution among the cardiolipin molecular species sometimes not sufficient to distinguish the molecular species, and 2) the key fatty acid MS/MS mass fragment for cardiolipin (e.g., 279 m/z in tetra-linoleoyl cardiolipin) was outside of the range of the ion-trap mass spectrometer because of the instrument's low mass cut-off. This fragment was observable in an MS3 spectrum, but it was less prominent than desirable.
To improve the chromatography of cardiolipin molecular species, we added acidified triethylamine to the chromatographic eluents. This positively charged eluent component dynamically forms ion-pairs with the negatively charged phosphates in the cardiolipin molecule, resulting in increased chromatographic retention and greatly improved chromatographic resolution. To improve the mass spectral information generated from the fragmentation of cardiolipin molecular species, we used a linear ion trap that had no inherent low mass cut-off, and therefore the MS/MS spectrum of cardiolipin contained the fatty acid fragment. These changes have resulted in a substantial enhancement to our system, which we now report below.
MATERIALS AND METHODS
Materials
2-Propanol, triethylamine, and glacial acetic acid were purchased from Fisher Scientific (Cleveland, OH). Acetonitrile was purchased from Jade Scientific (Canton, MI). HPLC grade water was prepared with a Synergy® Reagent-Grade water system (Millipore, Billerica, MA). Bovine heart cardiolipin, 1,1',2,2'-tet ramyristoyl cardiolipin, and 1,1',2,2'-tetraoleoyl cardiolipin were purchased from Avanti Polar Lipids (Alabaster, AL). Solutions were prepared in chloroform (7.3, 13.1, and 9.4 mM, respectively). Bovine heart cardiolipin also was purchased from Sigma-Aldrich (St. Louis, MO) and a 10 mM solution (in chloroform) was prepared.
Biological samples
All animal protocols used were approved by the Animal Care and Use Committee of Case Western Reserve University. C57BL/6 mice, 6 months of age, were obtained from the National Institute of Aging. Mice were euthanized by cervical dislocation and their hearts were rapidly excised. Three mouse hearts were combined for each experiment and their cardiac mitochondria were isolated using the procedure of Palmer (13), except that trypsin was used as the protease (14). Cardiac mitochondria exist in two functionally distinct populations within the myocyte. Subsarcolemmal mitochondria (SSM) are located underneath the plasma membrane and interfibrillar mitochondria are situated among the myofibrils. For the purposes of this report, SSM mitochondria were used. Male Sprague-Dawley rats (250–300 g) were obtained from Charles River Laboratories (Portage, MI). Animals were euthanized by decapitation and their livers were rapidly excised. The mitochondria were isolated by differential centrifugation, yielding a mitochondrial protein concentration of 80–100 mg/ml (15). Further purification of rat liver mitochondria was achieved using self-forming Percoll gradient centrifugation (16). Dog heart mitochondria were obtained from a previously reported study (17).
Isolated mitochondria (1.5 mg, diluted to a final volume of 0.25 ml using 50 mM KCl) were extracted using the method of Folch et al. (18). Samples were then subjected to silica gel chromatography and the lipid classes were serially eluted in six fractions using solvents of increasing polarity (19): Fraction 1 contained cholesterol esters and was eluted with isooctane:ethylacetate (95:1), fraction 2 contained triglycerides and was eluted with isooctane:ethylacetate (20:1), fraction 3 contained cholesterol and diglycerides and was eluted with isooctane:ethylacetate (75:25), fraction 4 contained free fatty acids and was eluted with isooctane:ethylacetate:acetic acid (75:25:2), fraction 5 contained monoglycerides and was eluted with isooctane:ethylacetate:acetic acid (75:25:2), and fraction 6 contained the combined phospholipids and was eluted with methanol. This final fraction, containing cardiolipin, was evaporated to dryness while the other factions were stored for other experiments. Cardiolipin was isolated from fraction 6 by normal phase HPLC as described (10).
HPLC-MS/MS and HPLC-MS3
The HPLC-MS/MS system used an HP1100 series quaternary pump with an on-line degasser, autosampler, and column heater (Agilent Technologies, Wilmington, DE). The column used was a Symmetry® C18 5μm, 150 × 3.9 mm analytical column (Waters Corporation, Milford MA). The column heater was operated at 35°C. Two eluents were used: eluent A contained 450 ml acetonitrile, 50 ml water, 2.5 ml triethylamine, and 2.5 ml glacial acetic acid, whereas eluent B contained 450 ml 2-propanol, 50 ml water, 2.5 ml triethylamine, and 2.5 ml glacial acetic acid. The gradient was formulated as follows: 50%B for 5 min, 50%B to 80% B over 10 min, 80% B to 100% B over 15 min, and hold 100% B for 10 min. The flow rate was 400 μl/min. The mass spectrometer used was a 3200 Q TRAP® hybrid triple quadrupole / linear ion trap mass spectrometer, with a Turbo V™ ion source (Applied Biosystems/MDS SCIEX, Concord, Ontario, Canada). The source was operated in the Turbo IonSpray mode with instrument parameters including curtain gas: 10.00, ion spray voltage: -4500.00, temperature: 500°C, nebulizer gas: 60.00, and heater gas: 50.00. The instrument's linear ion trap mode was employed with an information dependent acquisition method, which included a survey scan in the enhanced MS (EMS) mode followed by an enhanced product ion scan on the largest ion in the EMS scan. The EMS scan was performed at a rate of 250 Da/s with a spectral range of either 1400–1600 Da (for biological samples) or 1200–1600 Da (for the standards), whereas the enhanced product ion scan was performed at a rate of 1000 Da/s with a spectral range of 100–900 Da. HPLC-MS3 was performed using the same source parameters as HPLC-MS/MS. HPLC-MS3 data collection used a three-experiment method, with each experiment having 1451.70 Da as the first precursor and the second precursors were 695.20, 697.20, or 699.20 Da. The MS3 spectrum was collected at a scan rate of 250 Da/s with a spectral range of 278-285 Da. A six port valve was employed to divert the first 3 min of HPLC eluent to waste to prevent unretained compounds from fouling the ion source.
Aliquots (100 nmoles) of cardiolipin standards were evaporated to dryness with nitrogen and reconstituted in 200 μl 50/50 eluent A/eluent B. These standards were both individually inected (5 μl) into the HPLC and mixed in equal proportions and injected (5 μl). For biological samples, aliquots (100 μl) from the normal phase HPLC cardiolipin containing fraction were withdrawn and evaporated to dryness with nitrogen, and reconstiuted in 100 μl 50/50 eluent A/eluent B. These were injected (60 μl) into the HPLC-MS/MS system. This represents a 20-fold decrease in the amount material used for analysis from our previous procedure (10).
RESULTS AND DISCUSSION
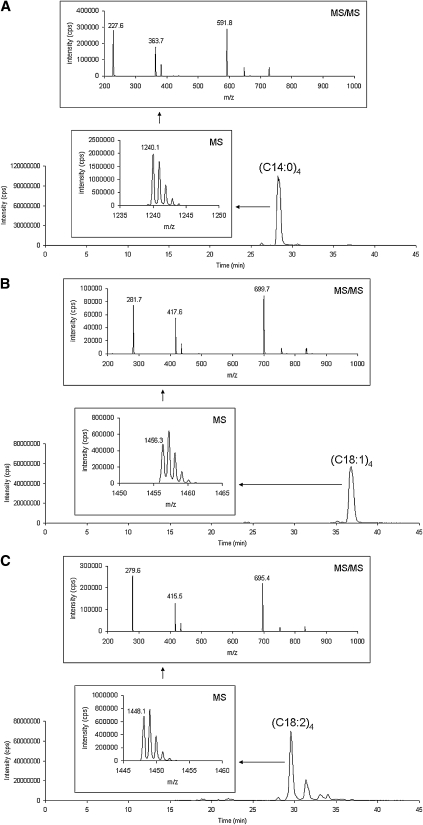
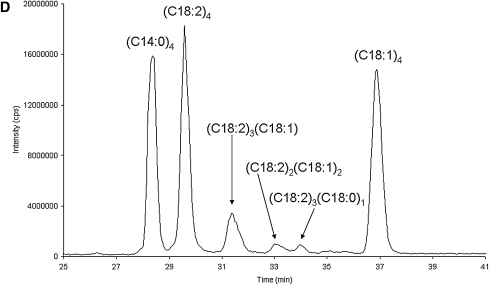
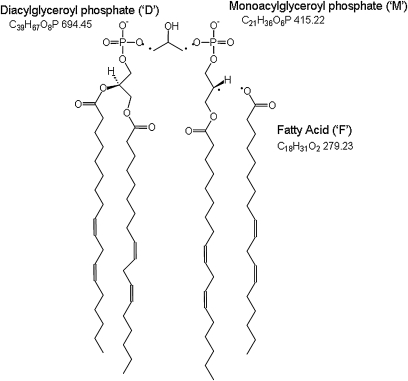
Figure 1 shows the separation and characterization of commercial standards of tetra-myristoyl cardiolipin (C14:0)4, tetra-oleoyl cardiolipin (C18:1)4, and bovine cardiolipin (containing tetra-linoleoyl cardiolipin (C18:2)4) using the HPLC-MS/MS system. Figure 1A–C show total ion chromatograms (TIC) of each of these standards injected alone. Figure 1D is of a mixture of the three standards and shows the separation of these cardiolipin molecular species. The inset spectra labeled ‘MS’ show the MS spectra of the [M−] species envelopes of 1240, 1456, and 1448 m/z for tetra-myristoyl, tetra-oleoyl, and tetra-linoleoyl cardiolipin, respectively. These spectra show the resolution of the 13C species using the linear ion trap with data collection set at the highest resolution (250 Da/s). The inset spectra labeled ‘MS/MS’ are the MS/MS spectra generated by selection of the first mass of the cluster, which is then subjected to collision induced dissociation. Three distinctive areas of the resulting spectra are characteristic of each cardiolipin species: the diacylglycerol phosphate region (‘D’), the monoacylglycerol phosphate region (‘M’), and the fatty acid region (‘F’). In the case of tetra-linoleoyl cardiolipin (Fig. 1C), the diacylglycerol phosphate mass is 695 m/z, the monoacylglycerol phosphate mass is 415 m/z, and the fatty acid mass is 279 m/z. Structures consistent with these fragments are shown in Fig. 2.
Fig. 1.
Separation and characterization of commercial standards of tetra-myristoyl cardiolipin (C14:0)4, tetra-oleoyl cardiolipin (C18:1)4, and bovine cardiolipin [containing tetra-linoleoyl cardiolipin (C18:2)4] using the HPLC-MS/MS system. A–C show TIC and spectra of these standards injected alone. The inset spectra labeled ‘MS’ show the MS spectra of the [M−] species envelope. The inset spectra labeled ‘MS/MS’ are the MS/MS spectra generated by selection of the first mass of the cluster, which is then subjected to collision induced dissociation. D is of a mixture of the three standards.
Fig. 2.
Tetra-linoleoyl cardiolipin (C18:2)4. The structures shown are consistent with the fragment ion masses observed in Fig. 1C.
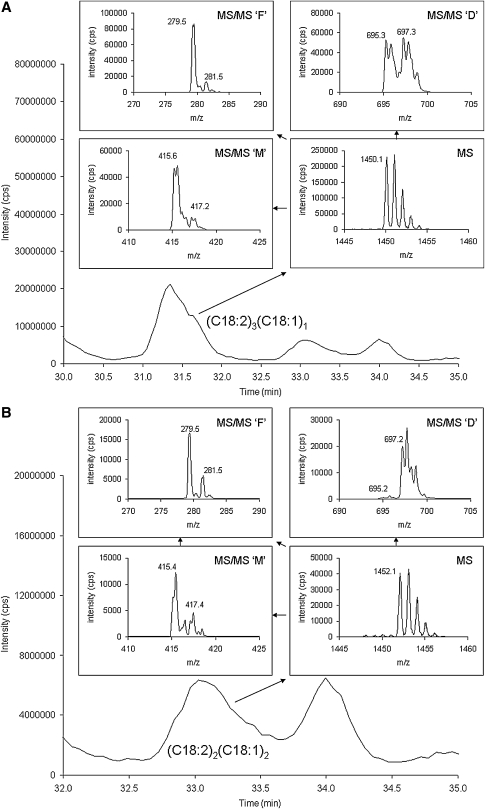
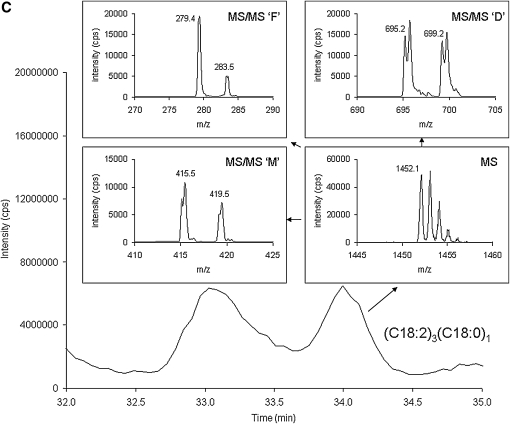
Figure 3 shows an expanded view of the bovine heart cardiolipin species shown in Fig. 1C, and focuses in on the cardiolipin molecular species other than (C18:2)4 cardiolipin. In Fig. 3A, this cardiolipin molecular species has a molecular weight of 1450 Da (MS spectrum), the diacyl glycerol phosphate spectrum (MS/MS ‘D’) contains masses at 695 and 697 m/z, the monoacylglycerol phosphate spectrum (MS/MS ‘M’) contains masses is 415 and 417 m/z, and the fatty acid spectrum (MS/MS ‘F’) contains masses is 279 and 281 m/z. These values are consistent with tri-linoleoyl-mono-oleoyl cardiolipin [(C18:2)3(C18:1)1]. Figure 3B and C are two cardiolipin species with the same mass (1452 Da, MS spectra) but these two chromatographic peaks are identified as di-linoleoyl-di-oleoyl cardiolipin [(C18:2)2(C18:1)2] and tri-linoleoyl-mono-stearoyl cardiolipin [(C18:2)3(C18:0)1], respectively, based on the MS/MS ‘D’, MS/MS ‘M’, and MS/MS ‘F’ spectra. In addition, a species identified as (C18:2)3(C18:3)1 cardiolipin was observed with a mass of 1446 Da, the diacylglycerol phosphate spectrum containing fragments at 693 and 695 m/z, the monoacylglycerol phosphate spectrum containing fragments at 413 and 415 m/z, and the fatty acid spectrum containing fragments at 277 and 279 m/z (see Table 1).
Fig. 3.
Separation and characterization of a commercial bovine cardiolipin standard. A shows the tri-linoleoyl-mono-oleoyl cardiolipin (C18:2)3(C18:1)1 species in the bovine heart standard including the MS [M−] species envelope spectrum (MS), diacylglycerol phosphate spectrum (MS/MS ‘D’), monoacylglycerol phosphate spectrum (MS/MS ‘M’), and the fatty acid spectrum (MS/MS ‘F’). B and C are two cardiolipin species with the same mass (1452 Da) but these two peaks are identified as di-linoleoyl-di-oleoyl cardiolipin (C18:2)2(C18:1)2 and tri-linoleoyl-mono-stearoyl cardiolipin (C18:2)3(C18:0)1, respectively, based on the MS/MS ‘D’, MS/MS ‘M’, and MS/MS ‘F’ spectra.
TABLE 1.
Characterization and relative distribution of the major cardiolipin species observed in commercial bovine heart cardiolipin products
| HPLC | MS | MS/MS | MS/MS | MS/MS | % of Total Determined Peak Area | |||
|---|---|---|---|---|---|---|---|---|
| Major Cardiolipin Species Observed | Retention Time (min) | Molecular Weight (Da) | Diacylglycerol-phosphate Fragment (m/z) | Monoacylglycerol- phosphate Fragment (m/z) | Fatty Acid Fragment (m/z) | MS XIC Range (m/z) | Avanti | Sigma |
| (C18:2)3(C18:3)1 | 28.0 | 1446 | 693, 695 | 413, 415 | 277, 279 | 1445-1447 | 1.9% | 5.6% |
| (C18:2)4 | 29.5 | 1448 | 695 | 415 | 279 | 1447-1449 | 72.6% | 69.7% |
| (C18:2)3(C18:1)1 | 31.3 | 1450 | 695, 697 | 415, 417 | 279, 281 | 1449-1451 | 17.9% | 19.2% |
| (C18:2)2(C18:1)2 | 33.0 | 1452 | 695, 697 | 415, 417 | 279, 281 | 1451-1453 | 4.1% | 4.6% |
| (C18:2)3(C18:0)1 | 34.0 | 1452 | 695, 699 | 415, 419 | 279, 283 | 1451-1453 | 3.5% | 0.5% |
To determine the relative distribution of the different cardiolipin species, we used the Analyst® software package included with the 3200 Q TRAP to formulate XIC (extracted ion chromatograms) of each of these cardiolipin molecular species based on chromatographic retention time and the MS spectral response data. We then determine the peak areas of these different cardiolipin species. Calculation of the relative amounts was performed by determining the total peak area (sum of all the peak areas determined within a chromatogram), dividing the individual peak areas by the total peak area, and multiplying by 100%. The response of all the cardiolipin molecular species is assumed to be nearly identical because the phosphate species common to all cardiolipin species is largely responsible for the MS response (8). Bovine heart cardiolipin purchased from Avanti was then compared with bovine heart cardiolipin purchased from Sigma and their compositions were slightly different, as shown in Table 1. Although (C18:2)4 is the major cardiolipin observed from both sources, the material from Sigma contains three times more (C18:2)3(C18:3)1 cardiolipin than the Avanti material. Additionally, the Sigma material has seven times less of the (C18:2)3(C18:0)1 cardiolipin than the Avanti material.
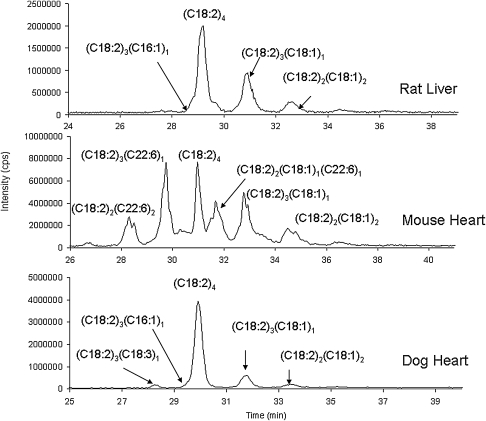
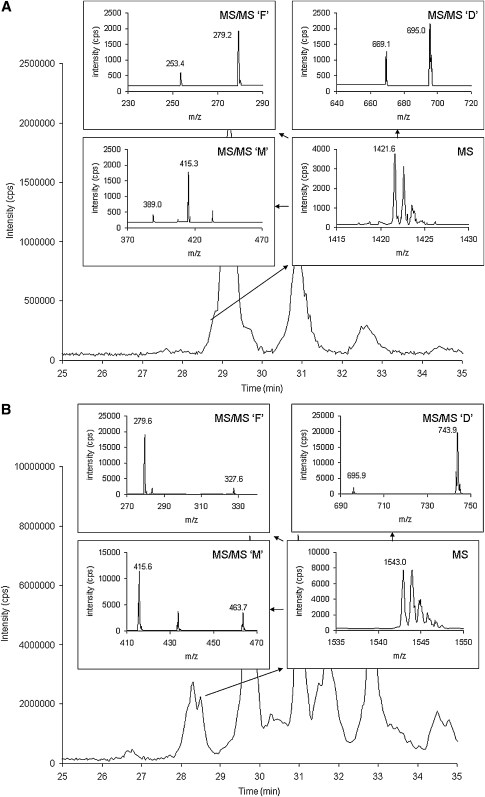
Following these experiments, analysis of multiple control samples from various animal protocols was performed. Figure 4 shows TICs generated from control rat liver mitochondria, mouse heart mitochondria, and dog heart mitochondria. Figure 5A shows a chromatogram and spectra of cardiolipin species isolated from Sprague-Dawley rat liver mitochondria. There is an additional peak appearing as a shoulder on (C18:2)4 cardiolipin, and the spectra displayed are from this additional species. The molecular weight of this species is 1422 Da and pattern of ions is consistent with (C18:2)3(C16:1)1: 669 and 695 m/z – ‘D’, 389 and 415 m/z – ‘M’, and 253 and 279 m/z – ‘F’, for a mass difference of 26 m/z for each of these pairs of ions. Figure 5B shows heart mitochondria (SSM) from the C57BL/6 mice. There are three additional peaks appearing slightly before or slightly after (C18:2)4 cardiolipin. The molecular weight of the first species is 1543 Da and the pattern of ions consistent is with (C18:2)2(C22:6)2: 695 and 743 m/z – ‘D, 415 and 463 m/z – ‘M’, and 279 and 327 m/z – ‘F’, for a mass difference of 48 m/z for each of these pairs of ions (Fig. 5B). The molecular weight of the second species is 1496 Da and the pattern of ions consistent is with (C18:2)3(C22:6)1: 695 and 743 m/z – ‘D’, 415 and 463 m/z – ‘M’, and 279 and 327 m/z – ‘F’. The molecular weight of the third species is 1498 Da and the pattern of ions is consistent with (C18:2)2(C18:1)1(C22:6)1: 695, 697, and 743 m/z – ‘D’, 415, 417, and 463 m/z – ‘M’, and 279, 281, and 327 m/z – ‘F’. The relative amounts of cardiolipin found in the biological samples are reported in Table 2.
Fig. 4.
Representative TICs generated from control rat liver mitochondria, mouse heart mitochondria, and dog heart mitochondria.
Fig. 5.
Characterization of cardiolipin molecular species in mitochondria. A shows TIC and spectra of cardiolipin isolated from rat liver mitochondria. The cardiolipin species appearing as a small shoulder on the much larger (C18:2)4 peak has a molecular weight of 1422 Da and its pattern of MS/MS ions is consistent with (C18:2)3(C16:1)1: 669 and 695 m/z – ‘D’, 389 and 415 m/z – ‘M’, and 253 and 279 m/z – ‘F’. B shows TIC and spectra of cardiolipin isolated from mouse heart mitochondria. A cardiolipin species appearing as a peak eluting before the (C18:2)4 peak has a molecular weight of 1543 Da and the pattern of MS/MS ions is 695 and 743 m/z – ‘D’, 415 and 463 m/z – ‘M’, and 279 and 327 m/z – ‘F’. By molecular weight and pattern of ions, this cardiolipin molecular species is consistent is with (C18:2)2(C22:6)2.
TABLE 2.
Relative distribution of the major cardiolipin species observed in isolated mitochondria
| % of Total Determined Peak Area | |||
|---|---|---|---|
| Major Cardiolipin Species Observed | Rat Liver Mitochondria Intact Sprague-Dawley N = 4 (mean ± s.d.) | Mouse Heart Mitochondria SSM C57BL/6 N = 2 (mean ± s.d.) | Dog Heart Mitochondria SSM N = 7 (mean ± s.d.) |
| (C18:2)4 | 56.5% ± 4.7% | 21.4% ± 1.8% | 76.7% ± 3.1% |
| (C18:2)3(C18:1)1 | 28.7% ± 2.4% | 17.2% ± 0.2% | 14.0% ± 2.1% |
| (C18:2)2(C18:1)2 | 8.4% ± 1.5% | 6.8 ±.0.5% | 4.0% ± 0.4% |
| (C18:2)3(C16:1)1 | 4.5% ± 0.5% | 1.2% ± 0.2% | 4.0% ± 0.8% |
| (C18:2)3(C18:3)1 | 0.9% ± 0.5% | Not Detected | 1.2% ± 0.4% |
| (C18:2)2(C22:6)2 | Not Detected | 10.5% ± 0.5% | Not Detected |
| (C18:2)3(C22:6)1 | 1.0% ± 1.1% | 25.5% ± 0.2% | Not Detected |
| (C18:2)2(C18:1)1 (C22:6)1 | Not Detected | 17.4% ± 1.1% | Not Detected |
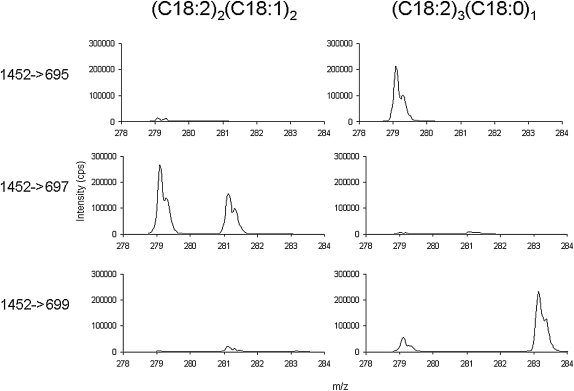
We examined the intensity ratios of the fatty acid ions generated from the bovine heart cardiolipin (Fig. 3) and found that is some cases they are in agreement with the ratio of the fatty acids present [e.g., (C18:2)3(C18:0)1, where the 283/279 intensity ratio is 0.3 as expected], although in other examples this is not the case [e.g., (C18:2)2(C18:1)2, where the 281/279 intensity ratio is 0.3 instead of 1]. Using the constitutional isomers (C18:2)3(C18:0)1 and (C18:2)2(C18:1)2, both of whose molecular weight is 1452 Da, we examined the ion intensity ratios using HPLC-MS3. In this experiment, 1452 m/z was first isolated and fragmented, then the diacylglycerol fragments (695, 697, and 699 m/z) were isolated and fragmented. We then compared fatty acid ion intensity ratios generated using HPLC-MS3 with those observed using HPLC-MS/MS. Figure 3B shows that the diacylglycerol fragment for (C18:2)2(C18:1)2 is 697 m/z and fatty acids fragments are 279 m/z (C18:2) and 281 m/z (C18:1). As shown in Fig. 6, when using HPLC-MS3, (C18:2)2(C18:1)2 displays the presence of 279 m/z and 281 fatty acids when fragmenting 697 m/z. This is consistent with the expectation that this diacylglycerol fragment would contain two C18:2 and two C18:1 fatty acids. Also, because the MS/MS fragmentation that forms the diacylglycerol fragments gives only one ion (697 m/z), the two diacylglycerol fragments do not appear to be distinguishable. The peak intensity ratio of 281/279 resulting from the fragmentation of 697 m/z at 0.7 is less than the expected value of 1. However, this is more than double that of the 281/297 ratio observed using HPLC-MS/MS. The reasons for the difference between HPLC-MS/MS and HPLC-MS3 and the relative enhancement of the 279 m/z signal in both HPLC-MS/MS and HPLC-MS3 are not apparent.
Fig. 6.
Characterization of cardiolipin molecular species using HPLC-MS3. MS3 fatty acid fragments were formed from specific MS/MS diacylglycerol fragmentations of (C18:2)2(C18:1)2 and (C18:2)3(C18:0)1 cardiolipins. See Fig. 3B and C for the corresponding HPLC-MS/MS results.
Figure 3C shows that the diacylglycerol fragments for (C18:2)3(C18:0)1 are 695 and 699 m/z, and the fatty acid fragments are 279 m/z and 283 m/z (C18:0). By HPLC-MS3 (see Fig. 6), (C18:2)3(C18:0)1 shows the presence of 279 m/z fatty acid alone when fragmenting 695 m/z. Therefore, this diacylglycerol fragment has two C18:2 fatty acids only. Fragmentation of 697 m/z gives no response but fragmentation of 699 m/z shows the presence of 279 m/z and 283 m/z fatty acids. This is consistent with the expectation that this diacylglycerol fragment would contain one C18:2 and one C18:0 fatty acid. However, the peak intensity ratio 281/279 is not 1, as expected, but is instead 3. With HPLC-MS/MS (Fig. 3C), we were observing the combination of two diacylglycerol fragments which contribute to the fatty acid response, whereas in the case of HPLC-MS3, we view these two fragments separately and the effect is the different. In the case of HPLC-MS3, the 283 signal appears to be enhanced, whereas in HPLC-MS/MS, the 283/279 intensity ratio is 0.3 as expected. We conclude, after having performed experiments by both HPLC-MS/MS and HPLC-MS3, that the ion intensity ratios do not always reflect the amount ratios of the fatty acids present. This result may simply be an artifact, which a higher resolution mass spectrometer may correct for. However, this result also suggests that differences in intensity ratios may correlate to different fatty acid chain locations in cardiolipin. Future work on this project will attempt to establish such a relationship, but this study will first require the synthesis of cardiolipin species with different specific fatty acids at specific known fatty acid positions, because such compounds are not commercially available.
In addition to our procedure, other approaches for the analysis of cardiolipin molecular species include shotgun lipidomics and LC-MS methods. In all three approaches, biological samples are subjected to a lipid extraction. Shotgun lipidomics then operates directly on this extract and relies exclusively on the mass spectrometer for selectivity (8). LC-MS methods (9, 20) often include normal phase chromatography, in which different classes of lipids are separated from each other. However, in normal phase chromatography, the individual molecular species of lipids are not chromatographically resolved; therefore, cardiolipin molecular species are differentiated by mass spectrometry only. With our method, we perform a Folch extraction, selectively isolate phospholipids by small column silica gel chromatography, selectively isolate cardiolipin by normal phase HPLC, and then separate the cardiolipin molecular species by reverse-phase ion pair HPLC. Therefore, the selectivity of our procedure is due to two-dimensional chromatography (normal phase followed by reverse-phase ion pair) in addition to mass spectrometry. Because we chromatographically separate cardiolipin constitutional isomers prior to mass spectrometry, we are able to unambiguously establish the presence of different cardiolipin species with the same mass [e.g., (C18:2)2(C18:1)2 and (C18:2)3(C18:0)1]. This is not possible using methods that do not chromatographically resolve cardiolipin molecular species (i.e., either shotgun lipidomics or LC-MS), because reliance on mass selectivity will be ineffective for differentiating isomeric or isobaric species. HPLC with fluorescence detection of derivatized cardiolipin does chromatographically resolve cardiolipin molecular species (6). However, our method with ion pair chromatography displays good resolution of cardiolipin molecular species without the need for derivatization and is much more selective because of mass spectrometric detection. Some methods suggest that the MS/MS ion intensity ratios of the fatty acids can be used to determine the fatty acid composition of cardiolipin species because intensity ratios appear to reflect the amount ratios of the fatty acids (8). From the data shown above, that is not always true in the case of our method, and this suggests that employing ion intensity ratios for determining fatty acid composition should be used with caution.
In conclusion, we describe an improved HPLC-MS/MS method for the separation and characterization of cardiolipin molecular species. This was accomplished with reverse-phase ion pair chromatography and a hybrid triple quadrupole linear ion trap mass spectrometer. We were able to chromatographically separate cardiolipin isomers: e.g., (C18:2)2(C18:1)2 cardiolipin and (C18:2)3(C18:0)1 cardiolipin. The MS/MS spectra generated by the linear ion trap, which has no inherent low mass cut-off, contained fragments ions derived from the diacylglycerol phosphate, monoacylglycerol phosphate, and fatty acid components of cardiolipin, allowing for characterization of cardiolipin molecular species found in commercial standards and biological samples. The relative distribution of the major cardiolipin species observed in both commercial standards and isolated mitochondria were determined, illustrating compositional differences in cardiolipin from different sources.
Acknowledgments
The authors thank William Parland, PhD and Edwin Vazquez for technical assistance in the preparation of mitochondria and Lori Hezel for isolation of phospholipids.
Footnotes
Abbreviations:
- ‘D’
- diacylglycerol phosphate region of the MS/MS spectrum
- EMS
- enhanced MS
- ‘F’
- fatty acid region of the MS/MS spectrum
- ‘M’
- monoacylglycerol phosphate region of the MS/MS spectrum
- MS3
- mass spectral fragmentation of a selected fragment already generated by a two stage, (i.e. MS/MS) mass spectral experiment
- SSM
- subsarcolemmal mitochondria
- TIC
- total ion chromatogram
- XIC
- extracted ion chromatogram
This work was supported by the National Institutes of Health Program Project Grants P01 AG15885 and P01 HL074237 and NIH DK066107. Its contents are solely the responsibility of the authors and do not necessarily represent the official views of the National Institutes of Health.
Portions of these results were presented at the 2009 ASMS Sanibel Conference on Lipidomics and Lipid Mass Spectrometry in St. Pete Beach, FL (January 2009) and the 57th ASMS Conference on Mass Spectrometry and Allied Topics in Philadelphia, PA. (June 2009).
REFERENCES
- 1.Hatch G. M.1998. Cardiolipin: biosynthesis, remodeling, and trafficking in the heart and mammalian cells. Int. J. Mol. Med. 1: 33–41 [DOI] [PubMed] [Google Scholar]
- 2.Schlame M., Rua D., Greenberg M. L. 2000. The biosynthesis and functional role of cardiolipin. Prog. Lipid Res. 39: 257–288 [DOI] [PubMed] [Google Scholar]
- 3.van Klompenburg W., Nilsson I., von Heijne G., de Kruijff B. 1997. Anionic phospholipids are determinants of membrane protein topology. EMBO J. 16: 4261–4266 [DOI] [PMC free article] [PubMed] [Google Scholar]
- 4.Hoch F. L.1992. Cardiolipins and biomembrane function. Biochim. Biophys. Acta. 1113: 71–133 [DOI] [PubMed] [Google Scholar]
- 5.Schlame M., Ren M., Xu Y., Greenberg M. L., Haller I. 2005. Molecular symmetry in mitochondrial cardiolipins. Chem. Phys. Lipids. 138: 38–49 [DOI] [PubMed] [Google Scholar]
- 6.Ritov V. B., Menshikova E. V., Kelley D. E. 2006. Analysis of cardiolipin in human muscle biopsy. J. Chromatogr. B Analyt. Technol. Biomed. Life Sci. 831: 63–71 [DOI] [PubMed] [Google Scholar]
- 7.Hsu F. F., Turk J. 2006. Characterization of cardiolipin as the sodiated ions by positive-ion electrospray ionization with multiple stage quadrupole ion-trap mass spectrometry. J. Am. Soc. Mass Spectrom. 17: 1146–1157 [DOI] [PMC free article] [PubMed] [Google Scholar]
- 8.Han X., Yang K., Yang J., Cheng H., Gross R. W. 2006. Shotgun lipidomics of cardiolipin molecular species in lipid extracts of biological samples. J. Lipid Res. 47: 864–879 [DOI] [PMC free article] [PubMed] [Google Scholar]
- 9.Sparagna G. C., Johnson C. A., McCune S. A., Moore R. L., Murphy R. C. 2005. Quantitation of cardiolipin molecular species in spontaneously hypertensive heart failure rats using electrospray ionization mass spectrometry. J. Lipid Res. 46: 1196–1204 [DOI] [PubMed] [Google Scholar]
- 10.Lesnefsky E. J., Stoll M. S., Minkler P. E., Hoppel C. L. 2000. Separation and quantitation of phospholipids and lysophospholipids by high-performance liquid chromatography. Anal. Biochem. 285: 246–254 [DOI] [PubMed] [Google Scholar]
- 11.Lesnefsky E. J., Hoppel C. L. 2008. Cardiolipin as an oxidative target in cardiac mitochondria in the aged rat. Biochim. Biophys. Acta. 1777: 1020–1027 [DOI] [PMC free article] [PubMed] [Google Scholar]
- 12.Lesnefsky E. J., Minkler P., Hoppel C. L. 2009. Enhanced modification of cardiolipin during ischemia in the aged heart. J. Mol. Cell. Cardiol. 46: 1008–1015 [DOI] [PubMed] [Google Scholar]
- 13.Palmer J. W., Tandler B., Hoppel C. L. 1977. Biochemical properties of subsarcolemmal and interfibrillar mitochondria isolated from rat cardiac muscle. J. Biol. Chem. 252: 8731–8739 [PubMed] [Google Scholar]
- 14.Chen Q., Hoppel C. L., Lesnefsky E. J. 2006. Blockade of electron transport before cardiac ischemia with the reversible inhibitor amobarbital protects rat heart mitochondria. J. Pharmacol. Exp. Ther. 316: 200–207 [DOI] [PubMed] [Google Scholar]
- 15.Hoppel C., DiMarco J. P., Tandler B. 1979. Riboflavin and rat hepatic cell structure and function. Mitochondrial oxidative metabolism in deficiency states. J. Biol. Chem. 254: 4164–4170 [PubMed] [Google Scholar]
- 16.Hoppel C. L., Kerner J., Turkaly P., Turkaly J., Tandler B. 1998. The malonyl-CoA-sensitive form of carnitine palmitoyltransferase is not localized exclusively in the outer membrane of rat liver mitochondria. J. Biol. Chem. 273: 23495–23503 [DOI] [PubMed] [Google Scholar]
- 17.Rosca M. G., Vazquez E. J., Kerner J., Parland W., Chandler M. P., Stanley W., Sabbah H. H., Hoppel C. L. 2008. Cardiac mitochondria in heart failure: decrease in respirasomes and oxidative phosphorylation. Cardiovasc. Res. 80: 30–39 [DOI] [PMC free article] [PubMed] [Google Scholar]
- 18.Folch J., Lees M., Sloane Stanley G. H. 1957. A simple method for the isolation and purification of total lipides from animal tissues. J. Biol. Chem. 226: 497–509 [PubMed] [Google Scholar]
- 19.Ingalls S. T., Kriaris M. S., Xu Y., DeWulf D. W., Tserng K. Y., Hoppel C. L. 1993. Method for isolation of non-esterified fatty acids and several other classes of plasma lipids by column chromatography on silica gel. J. Chromatogr. A. 619: 9–19 [DOI] [PubMed] [Google Scholar]
- 20.Houtkooper R. H., Rodenburg R. J., Thiels C., van Lenthe H., Stet F., Poll-The B. T., Stone J. E., Steward C. G., Wanders R. J., Smeitink J., et al. 2009. Cardiolipin and monolysocardiolipin analysis in fibroblasts, lymphocytes, and tissues using high-performance liquid chromatography-mass spectrometry as a diagnostic test for Barth syndrome. Anal. Biochem. 387: 230–237 [DOI] [PubMed] [Google Scholar]


