Abstract
Purpose: To estimate the position and volume errors in 4D-CT caused by irregular breathing.
Methods: A virtual 4D-CT scanner was designed to reproduce axial mode scans with retrospective resorting. This virtual scanner creates an artificial spherical tumor based on the specifications of the user, and recreates images that might be produced by a 4D-CT scanner using a patient breathing waveform. 155 respiratory waveforms of patients were used to test the variability of 4D-CT scans. Each breathing waveform was normalized and scaled to 1, 2, and 3 cm peak-to-peak motion, and artificial tumors with 2 and 4 cm radius were simulated for each scaled waveform. The center of mass and volume of resorted 4D-CT images were calculated and compared to the expected values of center of mass and volume for the artificial tumor. Intrasubject variability was investigated by running the virtual scanner over different subintervals of each patient’s breathing waveform.
Results: The average error in the center of mass location of an artificial tumor was less than 2 mm standard deviation for 2 cm motion. The corresponding average error in volume was less than 4%. In the worst-case scenarios, a center of mass error of 1.0 cm standard deviation and volume errors of 30%–60% at inhale were found. Systematic errors were observed in a subset of patients due to irregular breathing, and these errors were more pronounced when the tumor volume is smaller.
Conclusions: Irregular breathing during 4D-CT simulation causes systematic errors in volume and center of mass measurements. These errors are small but depend on the tumor size, motion amplitude, and degree of breathing irregularity.
Keywords: 4D-CT, motion artifacts, retrospective sorting, respiratory motion, tumor motion
INTRODUCTION
Four-dimensional computed tomography (4D-CT) has greatly improved the accuracy of radiotherapy treatment planning in the lung and abdomen by reducing errors in the identification of the location and size of tumors and critical organs. AAPM Task Group 76 recommends the measurement of respiratory motion for all tumors with expected motion of 5 mm or larger.1 Despite its popularity, even 4D-CT images can show breathing-related artifacts. Yamamoto et al.2 has performed a thorough visual investigation of 4D-CT, and found that 90% of the 4D-CT scans have visible artifacts, with a mean magnitude of 11.6 mm in the diaphragm or heart. Other studies have been performed to assess 4D-CT artifacts associated with image quality3 and the average intensity projection.4
The majority of breathing-related artifacts in 4D-CT are caused by irregular breathing. When retrospective, phase-based resorting is used, not all respiratory cycles are taken with the same amplitude, which results in different breathing states at each couch position.5 An additional problem occurs when the resorting software makes incorrect phase assignments. This can happen when an inhale is “missed” by the inhale detection routine and two breathing cycles are grouped together as one, or when a patient takes a deep inhale.6 Phase assignment can be corrected, to some extent, by using manual resorting.7 Amplitude-based resorting may be an improvement because it reduces the possibility that shallow breaths will be binned together with deep breaths.8, 9, 10 However, amplitude-based sorting still suffers from artifacts, which include missing or incorrectly binned slices, when the breathing amplitude varies within the CT session.5 In contrast, Langner and Keall11 propose a prospective method for using cine-mode CT, which triggers acquisition when the respiratory amplitude or velocity is in the desired range. This method eliminates the problem due to shallow breathing, but at the expense of extra scanning time.
In this study, we assessed differences in tumor position and the magnitude of volume variations due to irregular breathing. Our approach uses 4D-CT simulation software to generate a large set of hypothetical 4D-CT scans, and we analyzed the results for variations in the tumor volume and center of mass. The virtual 4D-CT scanner uses patient breathing data to simulate an axial mode scan with retrospective resorting, and simulates the motion of spherical tumors with different sizes and motion amplitudes. Simulation is repeated using different portions of the breathing waveform. Using this method, we were able to assess the variations in the reconstructed volume that might have been observed within a single simulation session.
MATERIALS AND METHODS
4D-CT
This study used a virtual 4D-CT scanner designed to reproduce scans created from an axial mode scan with retrospective resorting. The patient translates through the bore of the CT scanner, stopping at predetermined couch positions. At each couch position, cine-mode axial images are acquired for a complete breathing cycle, while a respiratory monitoring system records the signal of a breathing surrogate. The duration of these stationary couch positions are set for at least one period of the patient’s breathing, which is approximately 4–5 s. After the scan is complete, the images are reconstructed for each phase, representing different breathing states. This protocol is described by Rietzel et al.12 for the GE Lightspeed QX∕i (GE Healthcare Technologies, Waukesha, WI) and Varian real-time position management (RPM) (Varian Medical Systems, Palo Alto, CA).
Patient data
This study investigated 155 1D respiratory surrogate waveforms from patients at Massachusetts General Hospital between 2002 and 2006. These waveforms were acquired using the Varian RPM system during routine 4D-CT scanning. Patient data were selected without regard to age, sex, or disease site. This protocol was performed under approval of the Internal Review Board, MGH protocol #2006-P-002374∕1. The average length of the patient waveform files was 180 s.
All of the patient breathing data were normalized as shown in Eq. 1 to a sine wave. In other words, each normalized breathing trace was normalized to a peak-to-peak amplitude of approximately 1 cm. First, the waveform was centered by subtracting its mean μrpm. Next, its peak-to-peak amplitude was normalized so that its standard deviation σ would be , which is the standard deviation of a sine wave with a peak-to-peak amplitude 1 cm.
| (1) |
After normalization, the breathing trace was amplified by varying degrees using different magnification factors. For the results shown in this work, scaling factors of 1, 2, and 3 were used to achieve normalized traces with 1, 2, and 3 cm peak-to-peak amplitudes, respectively. These scaling factors were chosen based on previous studies, where lung tumors have been shown to move up to 2 cm,5 and liver motion has been reported as 10–25 mm.13
The virtual 4D-CT scanner
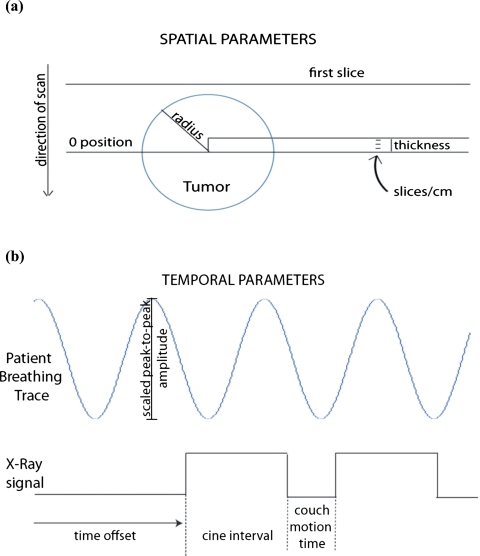
The virtual scanner was designed to reproduce 4D-CT images with irregular breathing. A synthetic sphere was moved according to arbitrary patient motion trajectories (Fig. 1), using various subsections of a RPM breathing trace. Simultaneously, an x-ray on∕off signal was recorded which simulates the motion of the couch according to the cine-mode scanning protocol. The simulator does not simulate sinogram acquisition and image reconstruction. Instead, axial image acquisition was considered to be instantaneous.
Figure 1.
(a) Spatial and (b) temporal parameters of virtual 4D-CT scanner. Note: A patient breathing trace does not follow a sine wave exactly.
The virtual 4D-CT simulator uses subsections of the motion waveform file, which are selected by varying the time when image acquisition begins. For this study, we acquired images for 25 couch positions, which was enough to acquire complete tumor volumes in all cases. The scanner begins acquiring images at a fixed distance before the tumor enters the CT bore spatially, to ensure that the beginning of the tumor movement is not missed. Specifically, images are obtained at a starting offset of two standard deviations of the rpm peak-to-peak amplitude before the edge of the tumor. This takes into account both the radius and the motion of the tumor, ensuring that approximately 95% of the variations in the patient breathing waveform data will be included. Many of the simulator parameters can be configured to match a specific scanner, such as slice thickness, slices per rotation, and couch travel time. The configurable parameters and the values used for this study are shown in Table 1.
Table 1.
Changeable parameters in virtual 4D-CT scanner. The values used to test the data are shown in the second column. However, other values can also be set for the various parameters. The results found in slice thickness can be calculated by multiplying thickness of the slab times the number of slices in each centimeter.
| Parameters | Values tested |
|---|---|
| Slice thickness | 0.25 cm |
| Slices per rotation | 4 |
| Tumor motion | {1, 2, 3} cm |
| Time before first image capture (offset) | 3.3 s |
| Radius of the spherical tumor | {2, 4} cm |
| In-plane pixel size | 0.1 cm |
| Cine interval (x-ray beam is on) | 6 s |
| Couch motion time (x-ray beam is off) | 1.5 s |
| Number of couch positions | 25 |
| Gantry rotation time (in seconds) | 0.8 s |
| Number of scanner acquisitions per couch position | 12 |
In addition to computing image volumes, the simulator computes the tumor center of mass and tumor volume by thresholding the image. Simulator output was validated using a sine wave, and compared to theoretical values. We include results for the sine wave alongside results for patient data. The average volume over all phases for patient data should be similar to the average volume calculated for sinusoidal motion. However, because patients spend more time in the exhale position, the average center of mass of the images taken during exhalation should be closer to the mean position of the center of mass than that expected from a sine wave.
Shape distortions were quantified by calculating the Dice coefficient value, which is a measure of the volume overlap between tumor volumes in the 4D-CT phase and a static sphere with the true radius. The static sphere was aligned to the center of mass of the reconstructed tumor, and Dice coefficient was calculated as
where A and B are the 4D tumor and the static sphere, respectively. A Dice coefficient of 1 means that there was perfect overlap between the two scans.
Experimental design
The breathing traces from 155 patients were used to simulate 4D-CT. The parameters of the 4D-CT were typical scanning values used in the clinic (Table 1). We simulated the scanner by using evenly spaced subsections of the breathing trace. The reconstructed CT image at a particular phase was assembled from images acquired at the phase recorded in the waveform file. Tumors with 2 and 4 cm radii and shifted according to a 1, 2, and 3 cm peak-to-peak amplitude were analyzed. The special case of a tumor radius of 2 cm and a breathing magnitude scaling factor of 2 cm peak-to-peak amplitude from external to internal was used for more extensive analysis.
RESULTS
We found that variability in the tumor position and volume increased if we increased the peak-to-peak tumor motion, and that the variability is greater for inhale than for exhale. Results for the tumor volume are presented in Table 2. The mean and standard deviation of the tumor volume were averaged over all patients and all phases, as shown in column 3. In general, the average volume matched the true volume to within 2%. The variation in the volume at inhale and exhale phases were computed for each patient, and then averaged, as shown in columns 4 and 5. The standard deviation of the inhale position of the 2 cm radius tumor with 3 cm peak-to-peak motion was 23.6% of the tumor’s volume, compared to the 10.4% variation in the volume of the 4 cm radius tumor with the same motion in the same position. Although large in percent, the average volume difference of 7.9 cm3 is small in absolute terms.
Table 2.
Average of mean volumes measured over all phasesn=155. The standard deviation of the mean increases as the tumor motion increases and∕or the radius increases. Also, the inhale volume has greater variability than the exhale volume as expected. The true volume of the 2 cm radius tumor is 33.5 cm3 and the true volume of the 4 cm radius tumor is 268 cm3.
| Radius (cm) | Motion (cm) | Measured volume (cm3) | Standard deviation of exhale (cm3) | Standard deviation of inhale (cm3) |
|---|---|---|---|---|
| 2 | 1 | 33.6±0.46 | 1.6 (4.8%) | 3.2 (9.5%) |
| 2 | 33.6±0.90 | 3.1 (9.3%) | 5.8 (17.3%) | |
| 3 | 33.8±1.3 | 4.5 (13.4%) | 7.9 (23.6%) | |
| 4 | 1 | 269±2.7 | 5.3 (2.0%) | 10 (3.7%) |
| 2 | 270±5.3 | 10 (3.7%) | 19 (7.1%) | |
| 3 | 271±7.6 | 15 (5.6%) | 28 (10.4%) |
We next examined the variations in center of mass, as presented in Table 3. The center of mass was averaged over all time offsets and all phases to find the mean center of mass for each patient. This average value is reported in column 3. Because we use normalized breathing waveforms, the nominal average value is zero, and we note that the standard deviation increases as the tumor motion increases. In columns 4 and 6, we show the average inhale and exhale position over all patients and all time offsets. In columns 5 and 7, we compute the standard deviation for different time offsets for each patient and show the average. The standard deviation of the inhale positions is significantly larger than the standard deviation of the exhale positions. In addition, the magnitude of the mean position at inhale was slightly larger than at exhale. The vast majority of the cases (with 3 cm motion or less) will have positional errors less than 5 mm (standard deviation) at the inhale position, and less than 2.5 mm (standard deviation) at the exhale position.
Table 3.
Average of center of mass positions measured over all phasesn=155. The mean position is slightly negative due to the longer duration of inhalation. The standard deviation of the mean position increases as the tumor motion increases and the inhale position has greater variability than the exhale position.
| Radius (cm) | Motion (cm) | Mean position (cm) | Exhale | Inhale | ||
|---|---|---|---|---|---|---|
| Mean position (cm) | Mean standard deviation (cm) | Mean position (cm) | Mean standard deviation (cm) | |||
| 2 | 1 | −0.027±0.066 | 0.28 | 0.084 | −0.47 | 0.15 |
| 2 | −0.049±0.13 | 0.56 | 0.17 | −0.94 | 0.3 | |
| 3 | −0.064±0.19 | 0.86 | 0.24 | −1.4 | 0.46 | |
| 4 | 1 | −0.020±0.059 | 0.29 | 0.078 | −0.47 | 0.15 |
| 2 | −0.035±0.11 | 0.58 | 0.15 | −0.93 | 0.29 | |
| 3 | −0.047±0.17 | 0.87 | 0.23 | −1.39 | 0.43 | |
We also examine the worst-case variation in position and volume in Table 4. The worst-case values are found by computing the standard deviation over all time offsets for inhale and exhale phase for each patient, and selecting the patient with the highest standard deviation. The worst-case center of mass error is 1.0 cm (standard deviation) at inhale and 0.61 cm at exhale, while the worst-case volume error is 35.8% at exhale and 59.7% at inhale.
Table 4.
Maximuminhale and exhale standard deviations of center of mass and volume found among 155 patients. The values for a 2 cm radius, 2 cm peak-to-peak normalized motion are bolded for comparison in Figs. 23.
| Radius (cm) | Motion (cm) | Exhale maximum standard deviation | Inhale maximum standard deviation | ||
|---|---|---|---|---|---|
| Center of mass (cm) | Volume (cm3) | Center of mass (cm) | Volume (cm3) | ||
| 2 | 1 | 0.21 | 5.5 (16.4%) | 0.37 | 8.2 (24.5%) |
| 2 | 0.41 | 9.7 (28.9%) | 0.71 | 15 (44.8%) | |
| 3 | 0.61 | 12 (35.8%) | 1.0 | 20 (59.7%) | |
| 4 | 1 | 0.19 | 17 (6.3%) | 0.32 | 37 (13.8%) |
| 2 | 0.35 | 37 (13.8%) | 0.62 | 66 (24.6%) | |
| 3 | 0.50 | 55 (20.5%) | 0.90 | 88 (32.8%) | |
DISCUSSION
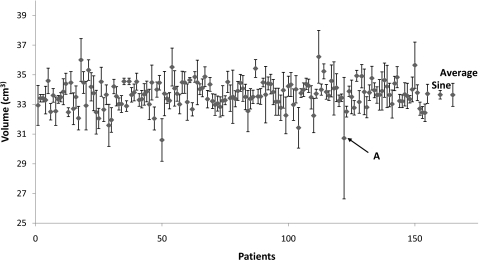
As a special case, we looked more closely at all of the patients’ breathing traces for 2 cm tumor radius and 2 cm peak-to-peak tumor motion. Figure 2 shows the volumes averaged over all phases for 155 patients. The volume detected for a sine breathing wave is also shown as a comparison measure to the average of all of the patients’ data. For all patients, the average volume was within 30% of the average volume for a sine wave, though the variation in a patient’s breathing trace is usually much larger than a regular sine wave.
Figure 2.
Volumes detected from a 2 cm radius tumor and 2 cm peak-to-peak tumor motion for 155 patients. The volume detected from a sine rpm wave is indicated on the right of the graph, along with the standard deviation averaged over all phases of the sine wave. The average tumor volume is shown on the far right, as well as the average standard deviation values of the volumes. The breathing trace of the value indicated by the arrow A is shown in Fig. 5a.
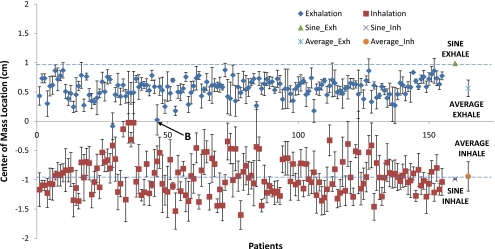
We also observed the center of mass inhale and exhale positions of the 155 patients breathing data, which are shown in Fig. 3. We see that the average patient exhale position is 43% below less than the exhale position of the sine wave. This can be explained by considering the shape of a typical breathing waveform. For a sine wave, the exhale and inhale phases are symmetric, and they are both equally close to the mean position. In a patient breathing waveform, the exhale phase is longer than the inhale phase. Because the tumor spends more time in the exhale position, the mean center of mass of the tumor will be closer to the center of mass of the exhale position than the inhale position. We would also expect that the average patient inhale position be farther from the mean than the sine wave. This was not found to be true, but the difference is less than 5%. This may be explained in part by the greater variability of inhalation.
Figure 3.
Inhalation and exhalation center of mass positions of a tumor with radius 2 cm and 2 cm peak-to-peak tumor motion for 155 patients. The dashed lines indicate theoretical values of a sine inhale position and a sine exhale position. Exhalation is 43% below the baseline sine exhale position. The breathing trace of the value indicated by the arrow is shown in Fig. 5b.
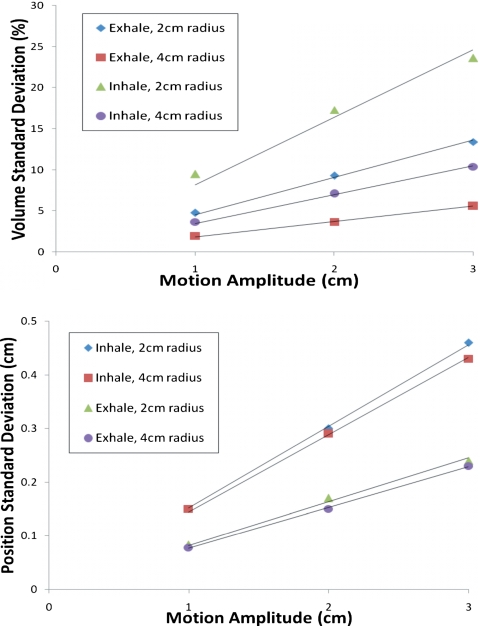
The average intrasubject variance of the volume and center of mass position for inhale and exhale are shown in Fig. 4. These results demonstrate the magnitude of systematic error caused by breathing variations that occur within the simulation session. The volume can vary considerably, especially for the small 2 cm radius tumor. Small systematic errors in the center of mass position of 1–4 mm can be seen. These systematic errors are greater for inhale than exhale. Next, we looked at the standard deviation in the inhale and exhale positions. For a 2 cm radius sphere with 2 cm peak-to-peak motion, the exhale position had mean standard deviation of 1.7 mm, and the inhale position had 3.0 mm. The maximum standard deviations for the exhale and inhale positions were 4.1 and 7.1 mm, respectively. These variations reflect systematic errors in target positions at these phases.
Figure 4.
Average intrasubject variance of volume (top) and center of mass position (bottom). These variances are primarily due to irregular patient breathing during a simulation session.
In addition, we computed the average volume overlap between the 4D-CT image and a perfect sphere for all tumor size and peak-to-peak motion combinations (Table 5). The smallest mean Dice coefficient was 0.81 for 2 cm radius tumors with 3 cm peak-to-peak motion in the inhale position. As expected, inhale positions showed more distortion than exhale positions by having smaller Dice coefficients due to the variability of inhalations. However, the mean Dice coefficient was about 0.9 for all of the values tested, indicating that majority of all of the 4D-CT image shapes were roughly similar to a sphere.
Table 5.
Dicecoefficients for inhale and exhale positions for various radii tumors and peak-to-peak scaling. The values for a 2 cm radius, 2 cm peak-to-peak normalized motion are bolded for comparison.
| Radius (cm) | Motion (cm) | Exhale dice coefficient | Inhale dice coefficient | ||
|---|---|---|---|---|---|
| Mean | Standard deviation | Mean | Standard deviation | ||
| 2 | 1 | 0.971 | 0.024 | 0.932 | 0.046 |
| 2 | 0.943 | 0.052 | 0.870 | 0.081 | |
| 3 | 0.914 | 0.071 | 0.808 | 0.109 | |
| 4 | 1 | 0.983 | 0.012 | 0.966 | 0.018 |
| 2 | 0.967 | 0.024 | 0.935 | 0.034 | |
| 3 | 0.950 | 0.037 | 0.904 | 0.047 | |
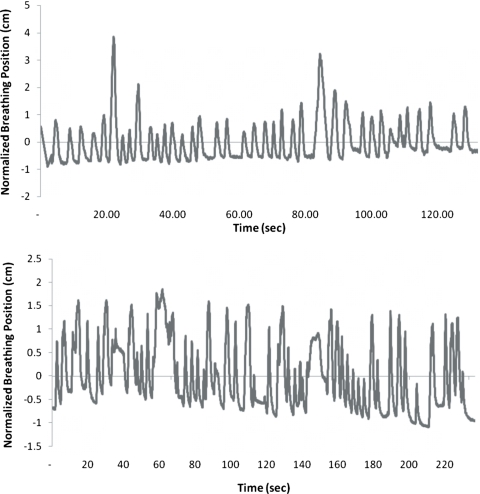
A few patients showed volumes and center of masses that were irregular. The respiratory waveform of a volume outlier, marked with “A” in Fig. 2, is shown in Fig. 5a. We see that this patient has long exhalations, relative to the cine interval. This situation causes problems in resorting the cine-mode images because no images will be acquired at inhalation phase for some of the couch positions. An example of a center of mass outlier, indicated with B in Fig. 3, is shown in Fig. 5b. This figure depicts a highly irregular breathing pattern. The breathing trace is not reliable, and therefore the expected center of mass position is not well sampled by a single scan.
Figure 5.
Breathing traces of center of mass and volume outliers. (a) The patient with a volume outlier has reoccurring long exhalations. (b) The patient with a center of mass outlier has an irregular breathing trace. Both of these traces were normalized to have 2 cm peak-to-peak motion.
To assess the overall impact of 4D-CT artifacts, we looked at the average volume over all phases, and found that 90% of the patients have an expected volume within ±4% of the true volume for a 2 cm radius sphere with 2 cm peak-to-peak motion. This is an average and does not take into consideration the variation dependent on when the scanner starts relative to breathing irregularities, which contributes an additional variation of ±2.3% standard deviation. Together, these effects create a systematic error when estimating the average tumor size. A similar systematic error in tumor position can be caused by irregular breathing.
A few caveats of this study remain. One caveat of this study is that the images are assumed to be captured instantaneously midscan time. In a true scanner, the CT image is reconstructed from a sinogram acquired over duration of time. This residual motion is reflected in these true CT images but not in our virtual CT simulator. However, newer scanners have faster acquisition times to reduce the possible residual motion during a scan acquisition. Second, the cine interval is usually an average breathing period plus an additional second to account for variations in the breathing period. This was not accounted for in this experiment, where we used a fixed cine interval. Finally, a comprehensive look at the volume shape distortion would benefit from an analysis of the mean surface distance between the 4D-CT images and the known shape.
Based on these findings, several aspects of the virtual 4D-CT simulator are considered for further study. An exhaustive comparison of the simulator parameter values could be used to tune the CT acquisition parameters. From those results, new CT scanner interfaces and protocols should be designed. The virtual CT simulator should also be expanded to simulate alternate cine and helical scan acquisition methods.
CONCLUSION
This study examined the range of positional and volume errors in 4D-CT caused by irregular patient breathing. In the average case, the error in center of mass location is less than 2 mm standard deviation, and the error in volume is less than a eight cubic centimeters. In the worst case, the error in center of mass is less than 0.6 cm standard deviation for exhale, and 1.0 cm standard deviation for inhale. This worst-case condition was found for a 2 cm radius tumor with 3 cm peak-to-peak motion, which is rare in the liver13 and even rarer in the lungs.5 The worst-case volume errors appears to be correlated with the tumor volume and motion range, and range between 6%–35% at exhale and 30%–60% at inhale.
References
- Keall P. J. et al. , “The management of respiratory motion in radiation oncology: Report of AAPM Task Group 76,” Med. Phys. 33(10), 3874–3900 (2006). 10.1118/1.2349696 [DOI] [PubMed] [Google Scholar]
- Yamamoto T., Langner U., Loo B., Shen J., and Keall P., “Retrospective analysis of artifacts in four-dimensional CT images of 50 abdominal and thoracic radiotherapy patients,” Int. J. Radiat. Oncol., Biol., Phys. 72(4), 1250–1258 (2008). [DOI] [PMC free article] [PubMed] [Google Scholar]
- Starkschall G., Desai N., Balter P., Prado K., Luo D., Cody D., and Pan T., “Quantitative assessment of four-dimensional computed tomography image acquisition quality,” J. Appl. Clin. Med. Phys. 8(3), 1–20 (2007). 10.1120/jacmp.v8i3.2362 [DOI] [PMC free article] [PubMed] [Google Scholar]
- Cai J., Read P., and Sheng K., “The effect of respiratory motion variability and tumor size on the accuracy of average intensity projection from four-dimensional computed tomography: An investigation based on dynamic MRI,” Med. Phys. 35(11), 4974–4981 (2008). 10.1118/1.2982245 [DOI] [PubMed] [Google Scholar]
- Liu H. H. et al. , “Assessing respiration-induced tumor motion and internal target volume using four-dimensional computed tomography for radiotherapy of lung cancer,” Int. J. Radiat. Oncol., Biol., Phys. 68(2), 531–540 (2007). 10.1016/j.ijrobp.2006.12.066 [DOI] [PubMed] [Google Scholar]
- Mutaf Y. D., Antolak J., and Brinkmann D., “The impact of temporal inaccuracies in 4D-CT image quality,” Med. Phys. 34(5), 1615–1622 (2007). 10.1118/1.2717404 [DOI] [PubMed] [Google Scholar]
- Rietzel E. and Chen G., “Improving retrospective sorting of 4D computed tomography data,” Med. Phys. 33(2), 377–379 (2006). 10.1118/1.2150780 [DOI] [PubMed] [Google Scholar]
- Abdelnour A. F., Nehmeh S., Pan T., Humm J., Vernon P., Schöder H., Rosenzweig K., Mageras G., Yorke E., Larson S., and Erdi Y., “Phase and amplitude binning for 4D-CT imaging,” Phys. Med. Biol. 52(12), 3515–3529 (2007). 10.1088/0031-9155/52/12/012 [DOI] [PubMed] [Google Scholar]
- Lu W., Parikh P., Hubenschmidt J., Bradley J., and Low D., “A comparison between amplitude sorting and phase-angle sorting using external respiratory measurement for 4D-CT,” Med. Phys. 33(8), 2964–2974 (2006). 10.1118/1.2219772 [DOI] [PubMed] [Google Scholar]
- Wink N., Pankin C., and Solberg T., “Phase versus amplitude sorting of 4D-CT data,” J. Appl. Clin. Med. Phys. 7(1), 77–85 (2006). 10.1120/jacmp.2027.25373 [DOI] [PMC free article] [PubMed] [Google Scholar]
- Langner U. W. and Keall P. J., “Prospective displacement and velocity-based cine 4D-CT,” Med. Phys. 35(10), 4501–4512 (2008). 10.1118/1.2977539 [DOI] [PMC free article] [PubMed] [Google Scholar]
- Rietzel E., Pan T., and Chen G., “Four-dimensional computed tomography: Image formation and clinical protocol,” Med. Phys. 32(4), 874–889 (2005). 10.1118/1.1869852 [DOI] [PubMed] [Google Scholar]
- Langen K. M. and Jones D. T., “Organ motion and its management,” Int. J. Radiat. Oncol., Biol., Phys. 50(1), 265–278 (2001). 10.1016/S0360-3016(01)01453-5 [DOI] [PubMed] [Google Scholar]


