

Abstract
BACKGROUND
The adipose tissue renin–angiotensin system (RAS) has been implicated in the pathophysiology of obesity and dysfunction of adipose tissue. However, neither regulation of angiotensinogen (AGT) expression in adipose tissue nor secretion of adipose tissue–derived AGT has been fully elucidated in humans.
METHODS
Human subcutaneous abdominal adipose tissue (SAT) biopsies were performed for 46 subjects with a wide range of body mass index (BMI). Considering the mRNA level of AGT and indices of body fat mass, the amount of adipose tissue–derived AGT secretion (A-AGT-S) was estimated. Using a mouse model of obesity and weight reduction, plasma AGT levels were measured with a newly developed enzyme-linked immunosorbent assay (ELISA), and the contribution of A-AGT-S to plasma AGT levels was assessed.
RESULTS
A-AGT-S was substantially increased in obese humans and the value was correlated with the plasma AGT level in mice. A-AGT-S and plasma AGT were higher in obese mice, whereas lower in mice with weight reduction. However, the AGT mRNA levels in the liver, kidney, and aorta were not altered in the mouse models. In both humans and mice, the AGT mRNA levels in mature adipocytes (MAs) were comparable to those in stromal-vascular cells. Coulter Multisizer analyses revealed that AGT mRNA levels in the MAs were inversely correlated with the average size of mature adipocytes.
CONCLUSIONS
This study demonstrates that adipose tissue–derived AGT is substantially augmented in obese humans, which may contribute considerably to elevated levels of circulating AGT. Adipose tissue–specific regulation of AGT provides a novel insight into the clinical implications of adipose tissue RAS in human obesity.
Keywords: adipocyte size, adipose tissue, angiotensinogen, blood pressure, hypertension, obesity
Activation of the renin–angiotensin system (RAS) is commonly observed in patients with obesity.1,2 Angiotensin-converting enzyme (ACE) inhibitors and angiotensin II type 1 receptor (AT1R) blockers ameliorate obesity-related metabolic derangement.3,4 Of note, Case-J trial demonstrated that a systemic blockade of RAS significantly reduced the incidence of newly occurring type 2 diabetes, notably in obese patients with hypertension.5 Adipose tissue expresses all components of RAS (angiotensinogen (AGT), renin, ACE, AT1R, and angiotensin II type 2 receptor (AT2R)) in humans and rodents,1 implicating adipose tissue RAS in the pathophysiology of obesity.
AGT, the only substrate of renin, is expressed in a variety of tissues.1,2 Besides the liver, adipose tissue has recently been recognized as a considerable source of AGT.1 A previous study demonstrated that transgenic overexpression of AGT exclusively in adipose tissue augmented circulation level of AGT and rescued hypotension and leanness seen in AGT knockout mice.6 This observation indicates that adipose tissue–derived AGT contributes to circulating AGT level and resultant pathophysiology of obesity-related metabolic diseases. Although some recent studies demonstrated that expression of adipose AGT is modi-fied by adiposity in humans and rodents,1,7,8 secretion of adipose tissue–derived AGT per se has not been elucidated. Therefore, the extent to which adipose tissue–derived AGT secretion (A-AGT-S) contributes to plasma AGT levels has not been clarified.
In this context, this study was designed to estimate the amount of A-AGT-S, considering the mRNA level of AGT and indices of body fat mass, and explored the potential regulation of A-AGT-S in relation to obesity by performing human adipose tissue biopsies. Furthermore, plasma AGT levels were measured using a newly developed enzyme-linked immunosorbent assay (ELISA),9,10 and the contribution of A-AGT-S to plasma AGT in mouse models of obesity and weight reduction was assessed.
Although the mechanistic link between adipocyte size and metabolic consequences has long been of research interest,11,12 the relationship between adipocyte hypertrophy and the expression level of AGT in adipocytes was not fully investigated in humans. Most of the previous studies have employed a histological approach for evaluating adipocyte size.8,11 However, the distribution of adipocyte diameter is bimodal in humans,12,13 resulting in limitations in assessing the representative size of adipocytes. In this context, size of mature adipocytes was precisely analyzed using a Coulter Multisizer,12 and the possible relationship between adipocyte size and AGT mRNA level in adipocytes was explored in humans.
METHODS
Profile of subjects
This study was approved by the ethical committee on human research of Kyoto University Graduate School of Medicine (no. 553). Signed informed consent was obtained from all subjects. A total of 46 Japanese subjects (Table 1: 24 men and 22 women; body mass index (BMI): 29 ± 1.0 kg/m2) were recruited for subcutaneous abdominal adipose tissue (SAT) biopsies. Patients who had received ACE inhibitors, AT1R blockers, thiazolidinediones, insulin, or steroid-related drugs were carefully excluded. Among the group, the serum leptin level was measured in 39 subjects (20 men and 19 women; BMI: 28 ± 1.2 kg/m2). To examine the relationship between body fat mass and serum leptin level, 55 subjects (BMI: 27 ± 2.1 kg/m2, range: 15–52) were recruited during the same period.
Table 1. Profile of subjects.
| n | Mean ± s.e.m. | Range | |
|---|---|---|---|
| Age (years) | 46 | 46 ± 2.1 | 20–74 |
| BMI (kg/m2) | 46 | 29 ± 1.0 | 18–52 |
| Waist circumference (cm) | 46 | 93 ± 2.5 | 63–141 |
| Serum leptin (ng/ml) | 39 | 15 ± 2.2 | 1.7–68 |
| SBP (mm Hg) | 46 | 131 ± 2.7 | 94–200 |
| DBP (mm Hg) | 46 | 79 ± 1.5 | 55–108 |
BMI, body mass index; DBP, diastolic blood pressure; SBP, systolic blood pressure.
SAT biopsies
Adipose tissue biopsies were performed before controlling calorie intake and physical activity. SAT (~2 g) was removed from the periumbilical region under local anesthesia (lidocaine 1%). Samples were frozen in liquid nitrogen immediately and stored at −80 °C for total RNA extraction.
Hormone assays and clinical parameters
Blood samples were obtained at 0800 hours after an overnight fast 3 days before the adipose tissue biopsies. Serum leptin levels were measured using RIA (LINCO Research, St Louis, MO).
Real-time PCR
Total RNA was extracted using a QIAGEN RNeasy Kit (QIAGEN Japan, Tokyo, Japan). Complementary DNA was synthesized using an iScript cDNA Synthesis Kit (Bio-Rad, Hercules, CA). The mRNA level was quantified using the TaqMan PCR method with an ABI PRISM 7700 Sequence Detection System (Applied Biosystems, Foster City, CA).14 The sequences of primers and probes for each gene are summarized in Table 2. Values were normalized to that of 18S rRNA (Applied Biosystems).
Table 2. Oligonucleotide sequences for primers and probes.
| Gene | Forward/reverse primer Probe |
|---|---|
| Human AGT | 5′GGTGGAGGGTCTCACTTTCCA3′/5′ATGGTCAGGTGGATGGTCCG3′ 5′CCCTCAACTGGATGAAGAAACTGTCTCC3′ |
| Human renin | 5′GCTATTCAACAGGGACAGTCAG3′/5′TCCGTGACCTCTCCAAACATC3′ 5′AGCCAGGACATCATCACCGTGGGT3′ |
| Human ACE | 5′TGCACAGTCTCAACCTGCTG3′/5′CAAGGGCCATCTTCATCAGAAAG3′ 5′TCAGCAGCTCCTAGTTCTTATGCCTTTGGT3′ |
| Human AT1R | 5′GGGGCGCGGGTGTATTTG3′/5′TTCAGTAGAAGAGTTGAGAATCATTTTG3′ 5′AGTGTTTGCAACAAATTCGACCCAGGTGA3′ |
| Human AT2R | 5′GCTGATTTATGATAACTGCTTTAAACTTC3′/5′GGTGGAGTTGCCCTTCATATTG3′ 5′TCAGCAGCTCCTAGTTCTTATGCCTTTGGT3′ |
| Human adiponectin | 5′CCGTGATGGCAGAGATGGCA3′/5′TGAGAAGGGTGAGAAAGGAGATCCAGGT3′ 5′CCGATGTCTCCCTTAGGACCAAT3′ |
| Mice AGT | 5′ACACCTACGTTCACTTCCAAG3′/5′CCGAGATGCTGTTGTCCAC3′ 5′ATGAGAGGTTTCTCTCAGCTGCCTGGA3′ |
| Mice renin | 5′GCTCCCTGAAGTTGATCATGC3′/5′GTGGGCACCTGGCTACAG3′ 5′CTCTTCTCCTTGGCTCCCAGGGCT3′ |
| Mice ACE | 5′TCCCAAAGTATGTGGAGTTCTCC3′/5′TTGTCAGACTCGTATAAGGATCTCC3′ 5′CCCTGCATCCGTGTAGCCATTGAGC3′ |
| Mice AT1aR | 5′TACCAGCTCTGCGGCTCTC3′/5′TGCTGTGAGTTATCCAGACAAAATG3′ 5′AGCTCTGCTGCTCTCCCGGACTTAAC3′ |
| Mice AT2R | 5′GATGGAGGGAGCTCGGAAC3′/5′TTTAAAGCAGTTATCATAAATCAGCTTAC3′ 5′CACTCCTTAAAATGCAGGCTGAAGTAAGCT3′ |
The sequences of primers and probes for each gene used in this study are summarized.
AGT, angiotensinogen; ACE, angiotensin-converting enzyme; AT1R, angiotensin II type 1 receptor; AT1aR, angiotensin II type 1a receptor; AT2R, angiotensin II type 2 receptor.
Obese and weight-losing mouse models
In diet-induced obese (12W DIO, n = 6) model experiments, 8-week-old male C57BL/6J mice were housed for 4 weeks on a high-fat/highsucrose diet (D12493; Oriental Bio-Service, Kyoto, Japan) or regular diet (12W RD, n = 6) (F-2; Funahashi, Chiba, Japan). In the weight-losing (14W WL) mouse experiments, 6-week-old male C57BL/6J mice were maintained on a high-fat/high-sucrose diet for 4 weeks, then from 10 weeks of age were subjected to diet substitution from a high-fat/high-sucrose diet to an RD for 4 weeks. In addition, 6-week-old male C57BL/6J mice were maintained on high-fat/high-sucrose diet (14W DIO, n = 6) for 8 weeks. Experimental protocol of obese and weight-losing mouse models is schematized in Supplementary Figure S1 online.
Estimation of A-AGT-S
The amount of A-AGT-S was estimated by multiplying the mRNA level of AGT/g adipose tissue with the weight of body fat mass. Because serum leptin level was tightly correlated with body fat mass,15 the serum leptin levels were used as a representative index of body fat mass in humans. Estimation of A-AGT-S is schematized in Supplementary Figure S2 online.
ELISA for AGT
AGT protein was determined using a newly developed ELISA.9,10
Cell culture
3T3–L1 fibroblasts were maintained and differentiated into mature adipocytes.14 Fully differentiated adipocytes (day 8) were exposed to 10−9, 10−8, or 10−7 mol/l dexamethasone for 48 h. Total RNA was extracted from cultured cells using TRIzol Reagent (Invitrogen, Carlsbad, CA). For protein extraction, tissue was homogenized in a radioimmune precipitation (Upstate Cell Signaling Solutions, New York, NY) bufier containing protease inhibitors (Complete; Roche, Basel, Switzerland).
Measurement of adipocyte diameter by a Coulter Multisizer
A total of 15 human subjects (5 men and 10 women; age: 51 ± 3.8 years; BMI: 28 ± 2.5 kg/m2) were analyzed. Stromal-vascular cells and mature adipocytes (MAs) were isolated.16 Adipocyte size was determined by a Beckman Coulter Multisizer III (Beckman Coulter, High Wycombe, UK).12 Approximately 8,000 cells were analyzed using a Coulter Multisizer equipped with a 560-μm aperture tube. ATher collection of pulse sizes, data were expressed as particle diameters and displayed as histograms of counts against diameter, using linear bins and a linear scale for the x-axis.12
Statistical analyses
Values are expressed as mean ± s.e.m. Values not distributed normally were transformed into a logarithmic (natural logarithm) distribution and were analyzed using Pearson’s correlation coefficient. A Student’s t-test was used to compare the data (Social Research Information, Tokyo, Japan).
RESULTS
AGT mRNA expression and protein synthesis in 3T3–L1 adipocytes and human adipose tissue
Level of mRNA and protein of AGT were measured in lysates and cultured media in 3T3–L1 adipocytes treated with 10−9, 10−8, or 10−7 mol/l dexamethasone for 24 h. AGT protein level in lysates and cultured media were strongly correlated with the AGT mRNA level (r = 0.98, P < 0.01) (see Supplementary Figure S3a online) (r = 0.84, P < 0.01) (see Supplementary Figure S3b online).
Relationship between AGT protein/g adipose tissue and AGT mRNA levels in human SAT was also explored (n = 7, BMI: 29 ± 0.4 kg/m2, range 19–48). Consistent with the results in 3T3–L1 adipocytes, AGT protein/g adipose tissue was correlated with the AGT mRNA level in human adipose tissue (r = 0.77, P = 0.04) (see Supplementary Figure S3c online).
Impact of adipose tissue–derived AGT secretion on obesity and blood pressure in humans
The mRNA levels of RAS genes, AGT, renin, ACE, AT1R, and AT2R in human SAT were analyzed. The AGT mRNA level was inversely correlated with BMI (r = −0.32, P = 0.02) (Figure 1a). On the other hand, no correlation was observed between the ACE mRNA level and BMI (r = 0.08, P = 0.63). The AT1R mRNA level was inversely correlated with BMI (r = −0.32, P = 0.02). Renin and AT2R mRNA levels were undetectable. The mRNA level of adiponectin was analyzed. No significant correlations were observed between adiponectin mRNA level and BMI (r = 0.08, P = 0.56) or AGT mRNA level (r = 0.09, P = 0.49). We also focused our attention on the possibilities of gender difierences in AGT gene expression. When divided into two groups (BMI >25 (obese) and BMI <25 (lean)), the difierences of AGT mRNA levels by gender were not observed in lean (male n = 9:female n = 12) and obese (male n = 15: female n = 10).
Figure 1.
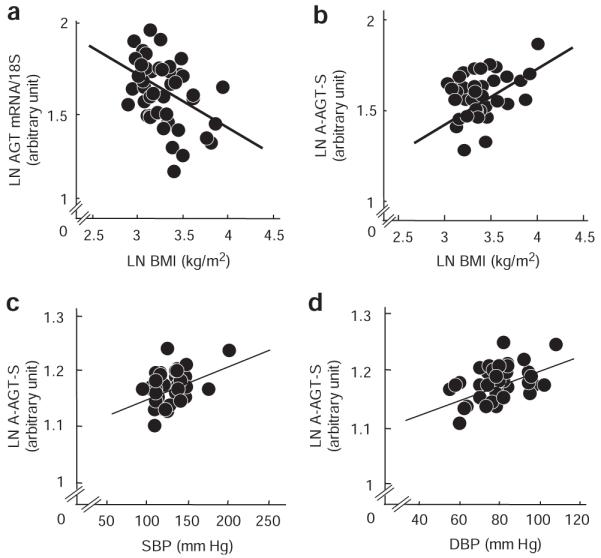
Impact of adipose tissue–derived AGT secretion on obesity and blood pressure in humans. (a) Relation between AGT mRNA level and BMI (n = 46). (b) Relationship between adipose tissue–derived AGT secretion (A-AGT-S) and BMI (n = 39). (c) Relationship between A-AGT-S and systolic blood pressure (SBP) (n = 39). (d) Relationship between A-AGT-S and diastolic blood pressure (DBP) (n = 39). AGT, angiotensinogen; BMI, body mass index; LN, natural logarithm.
Based on the results that AGT is secreted constitutively (see Supplementary Figure S3a–c online), AGT mRNA expression was predicted to parallel the AGT secretion. In this context, the amount of A-AGT-S was estimated by multiplying the mRNA level of AGT/g adipose tissue with serum leptin, a representative index of body fat mass. The serum leptin level in 55 subjects was correlated with body fat mass (r = 0.76, P = 0.00000000001). Contrary to AGT mRNA level, A-AGT-S was correlated with BMI (n = 39, r = 0.36, P = 0.02) (Figure 1b). A-AGT-S was correlated with systolic blood pressure (n = 39, r = 0.36, P = 0.02) (Figure 1c) and diastolic blood pressure (n = 39, r = 0.45, P < 0.01) (Figure. 1d). In both male group (n = 20) and female group (n = 19), A-AGT-S was correlated with BMI, systolic blood pressure, and diastolic blood pressure (data not shown).
Expression of genes involved in the RAS in obese and weight-losing mouse models
The mRNA levels of RAS genes were analyzed in obese and weight-losing mouse models described in Methods. The AGT mRNA levels in epididymal fat (EF), subcutaneous fat (SF), and retroperitoneal fat (RF) were lower in 12W DIO than in 12W RD (Figure 2a). In contrast, the AGT mRNA levels in EF, SF, and RF were elevated in 14W WL (Figure 2b). In the liver, kidney, and aorta, all of which are recognized as AGT-producing organs,2 the AGT mRNA levels were equivalent between 12W DIO and 12W RD, or between 14W WL and 14W DIO (Figure 2c,d). Levels of ACE and angiotensin II type 1a receptor (AT1aR) mRNA in EF, SF, mesenteric fat (MF), and RF were also equivalent between 12W DIO and 12W RD or between 14W WL and 14W DIO (ACE: Figure 2e,f) (AT1aR: Figure 2g,h). AGT was decreased, although other genes involving RAS did not vary, in adipose tissue from the genetically obese ob/ob mice (data not shown).
Figure 2.

Expression of genes involved in renin–angiotensin system in obese and weight-losing mouse. AGT mRNA levels in (a) 12W RD (n = 6) and 12W DIO (n = 6) and in (b) 14W DIO (n = 6) and 14W WL (n = 6) in epididymal fat (EF), subcutaneous fat (SF), mesenteric fat (MF), and retroperitoneal fat (RF). AGT mRNA levels in (c) 12W RD and 12W DIO and in (d) 14W DIO and 14W WL in the liver, kidney, and aorta. ACE mRNA levels in (e) 12W RD and 12W DIO and in (f) 14W DIO and 14W WL. AT1aR mRNA levels in (g) 12W RD and 12W DIO and in (h) 14W DIO and 14W WL. White bar, 12W RD; black bar, 12W DIO; vertical striping bar, 14W DIO; diagonal striping bar, 14W WL. *P < 0.01, **P < 0.05. ACE, angiotensin-converting enzyme; AGT, angiotensinogen; AT1aR, angiotensin II type 1a receptor; DIO, diet-induced obesity; WL, weight-losing.
Adipose tissue–derived AGT secretion and plasma AGT levels in obese and weight-losing mouse models
To assess the secretion of AGT from adipose tissue in body weight change, the amounts of A-AGT-S in obese and weight-losing mice were estimated by multiplying the AGT mRNA level/g adipose tissue with the weight of EF, SF, MF, or RF. The weights of EF, SF, MF, and RF in 12W DIO were increased ~3.5-fold in comparison with 12W RD, whereas the weights of EF, SF, MF, and RF in 14W WL were decreased by one-third compared to 14W DIO. Under caloric intervention, changes in weights in the liver and kidney were subtle compared to fat depots (~20% in liver and ~5% in kidney). A-AGT-S in EF, SF, MF, and RF was significantly increased in 12W DIO compared to 12W RD (Figure 3a). In contrast, A-AGT-S in EF, MF, and RF was decreased in 14W WL compared to 14W DIO (Figure 3b). To further explore the impact of obesity on circulating AGT, plasma AGT levels were measured in 12W DIO, 12W RD, 14W WL, and 14W DIO using a newly developed ELISA.10 The plasma AGT level was elevated in 12W DIO (2,884 ± 118 ng/ml) compared to 12W RD (2,431 ± 85 ng/ml) (Figure 3c). In contrast, the plasma AGT level in 14W WL (2,703 ± 116 ng/ml) was lower than in 14W DIO (3,088 ± 133 ng/ml) (Figure 3d). A-AGT-S in EF, SF, MF, and RF were correlated with plasma AGT level in mouse of obesity and weight reduction (EF: r = 0.49, P < 0.01 (Figure 3e); SF: r = 0.43, P = 0.02 (Figure 3f); MF: r = 0.41, P = 0.03 (Figure 3g); RF: r = 0.64, P < 0.01 (Figure 3h)).
Figure 3.

Adipose tissue–derived AGT secretion and plasma AGT level between obese and weight-losing mouse. Adipose tissue–derived AGT secretion (A-AGT-S) in (a) 12W RD (n = 6) and 12W DIO (n = 6) and in (b) 14W DIO (n = 6) and 14W WL (n = 6) in epididymal fat (EF), subcutaneous fat (SF), mesenteric fat (MF), and retroperitoneal fat (RF). Plasma AGT levels in (c) 12W RD and 12W DIO and in (d) 14W DIO and 14W WL. Relationship between A-AGT-S and plasma AGT levels in (e) EF, (f) SF, (g) MF, and (h) RF. White bar, 12W RD; black bar, 12W DIO; vertical striping bar, 14W DIO; diagonal striping bar, 14W WL. *P < 0.01, **P < 0.05, ***P = 0.05. AGT, angiotensinogen; DIO, diet-induced obesity; LN, natural logarithm; WL, weight-losing.
Relationship between cell size and AGT mRNA level in isolated mature adipocytes in humans
To investigate the potential link between adipocyte size and the mRNA level of AGT in isolated MAs, adipocyte size was measured using a Coulter Multisizer12 in human SAT (n = 15; BMI: 28 ± 2.5 kg/m2, range: 19–55). The AGT mRNA level in MAs was comparable to that in stromal-vascular cells (Figure 4a). The levels of AGT in stromal-vascular cells and MAs were inversely correlated with BMI (r = −0.69, P < 0.01 (Figure 4b), r = −0.84, P < 0.01 (Figure 4c). Consistent with a previous report,12 the size distribution of adipocytes displayed as histograms against diameters was bimodal in all cases. The nadir was defined as the low point between the large adipocytes and small adipocytes.12 BMI was positively correlated with both nadir size and average size of the larger adipocytes (r = 0.50, P < 0.05; r = 0.48, P < 0.05, respectively). The AGT mRNA level in isolated MA was inversely correlated with the average size of the larger adipocytes (r = −0.48, P < 0.05 (Figure 4d).
Figure 4.
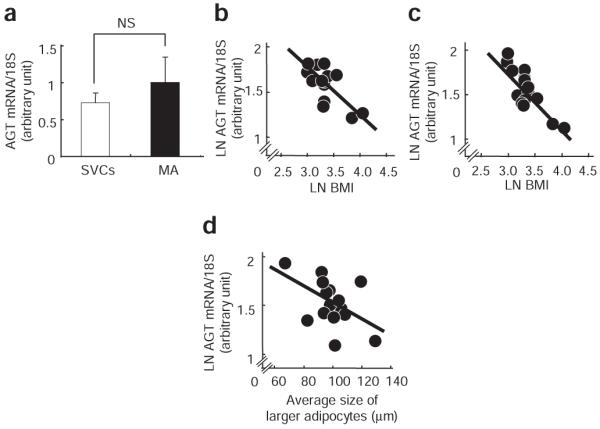
Relationship between cell size and AGT mRNA level in isolated mature adipocytes in humans. (a) AGT mRNA level in stromal-vascular cells (SVCs) and mature adipocytes (MAs) isolated from human subcutaneous abdominal adipose tissue (SAT) (n = 15; BMI: 28 ± 2.5 kg/m2). White bar, SVCs; black bar, MAs. Relationship between BMI and the AGT mRNA level in (b) SVCs or (c) MAs isolated from human SAT. (d) Relationship between the AGT mRNA level in MAs and the average size of large adipocytes in human SAT (n = 15; BMI: 28 ± 2.5 kg/m2). AGT, angiotensinogen; LN, natural logarithm.
DISCUSSION
The primary findings of this study are (i) A-AGT-S was substantially increased in both obese humans and obese mice. (ii) A-AGT-S was correlated with plasma AGT level in mouse models of obesity and weight reduction. A-AGT-S and plasma AGT were increased in obese mice, while decreased in mice with weight reduction. (iii) The AGT mRNA level in adipose tissue was decreased in both obese humans and mice, but increased in mice with weight reduction. The AGT mRNA levels in the liver, kidney, and aorta were not altered in mouse models of obesity and weight reduction. In contrast, expression of genes involved in RAS other than AGT did not change in adipose tissue from obese and weight-losing mice. (iv) AGT was secreted constitutively from adipocytes and adipose tissue in both humans and mice. (v) Coulter Multisizer analyses revealed that the AGT mRNA level in MAs was correlated inversely with the average size of adipocytes larger than the nadir of bimodal histograms.
As AGT is secreted from many organs including liver, kidney, and vascular cells,1,2 contribution of adipose tissue to plasma AGT level has not been determined. Furthermore, precise measurements of plasma AGT level were not conducted; instead, the radioimmunoassay result for angiotensin I has long been used as an equivalent.1,17 In this context, an accurate assessment of A-AGT-S is critical for investigating clinical implications of adipose tissue RAS. Using a newly developed ELISA.9,10 this study demonstrated for thefirst time that AGT was secreted constitutively from adipocytes and adipose tissue (Supplementary Figures S3 online). Based on our novel finding, A-AGT-S was estimated by multiplying the mRNA level of AGT/g adipose tissue and fat mass or serum leptin, where applicable. Notably, only AGT is nutritionally regulated in adipose tissue from mice among RAS components (Figure 2a,b,e–h) reinforcing the rationale for focusing on A-AGT-S.
In this study, plasma AGT levels were increased ~20% in the obese mouse, whereas they were decreased ~12% in mice with weight reduction. A-AGT-S in EF, SF, MF, and RF was correlated with plasma AGT (Figure 3e–h). In contrast, AGT mRNA levels in the liver, kidney, and aorta were not altered in body weight changes (Figure 2c,d), suggesting adipose tissue–specific regulation of AGT in obesity. Under caloric intervention, changes in weights in the liver and kidney were subtle compared to fat depots, supporting the notion that AGT from the liver and kidney may not vary considerably in obesity or weight reduction. Taken together, it is reasonable to speculate that A-AGT-S contributes considerably (~20%) to plasma AGT level, accompanied by an increase in body fat mass.
Nevertheless the notion that visceral fat contributes to only ~10% of total adipose tissue mass in nonobese humans,18 visceral adipose tissue–derived AGT secretion would not be negligible. In this context, in mouse models, we analyzed A-AGT-S in EF, MF, and RF, in addition to SF. A-AGT-S in EF, MF, and RF was increased in obese mice, whereas decreased in mice with weight reduction, and the A-AGT-S value in each adipose depot was correlated with plasma AGT level. Based on these results, it is likely to speculate that visceral adipose tissue–derived AGT secretion, like subcutaneous adipose tissue–derived AGT secretion, is substantially augmented and contributes to the plasma AGT level in human obesity.
Adipose tissue AGT mRNA levels were decreased by obesity and increased by weight loss, whereas A-AGT-S showed the opposite trend (Figures 1–3). It is likely that increased mass of adipose tissue in obesity overwhelmed the decrease in AGT expression, resulting in an increase in A-AGT-S and plasma AGT. Increased leptin mRNA level contributes to the extreme elevation of plasma leptin level in obesity.19 Distinct from leptin, it is reasonable to speculate that AGT mRNA in adipose tissue is regulated so that plasma AGT concentration does not rise extremely in obesity. Although a series of hormonal and inflammatory changes may control AGT expression in adipose tissue,1,20 the mechanism whereby AGT mRNA level is decreased exclusively in obese adipose tissue still remains obscure.
The mechanistic link between adipocyte size and metabolic consequences has long stimulated great interest in research.11,12 To date, most of studies have employed histological analyses for assessing adipocyte size.8,11 However, it should be noted that the distribution of adipocyte diameter is bimodal in humans.12,13 Therefore, in this study, adipocyte size was analyzed using a Coulter Multisizer, which allows determination of the distribution of adipocyte size with greatest accuracy.12 The progression of obesity is tightly associated with adipocyte hypertrophy.21 In agreement with this notion, the average size of adipocytes larger than the nadir12 was correlated with BMI (r = 0.51, P = 0.03), indicating that an increase in the average size of larger adipocytes tightly reflects adipocyte hypertrophy. The AGT mRNA level in isolated MAs was inversely correlated with the average size of larger adipocytes in humans (Figure 4d). We recently found that the AGT mRNA level was decreased in a long-term culture (~28 days) of 3T3–L1 adipocytes, with a concomitant increase in cellular triglyceride content (S. Okada, C. Kozuka, H. Masuzaki, S. Yasue, T. IshiiYonemato, Y. Yamamoto, M. Noguchi, T. Kusakabe, T. Tomita, J. Fujikura, K. Ebihara, K. Hosoda, H. Sakaue, H. Kobori, M. Ham, Y. Sok Lee, J. Bum Kim, Y. Saito, and K. Nakao, unpublished data). Although further studies are warranted, triglyceride accumulation and adipocyte hypertrophy may contribute to a decrease in AGT mRNA expression in obese adipose tissue.
In summary, this study is thefirst to demonstrate that secretion of adipose tissue–derived AGT is substantially augmented and contributes to the plasma AGT level in both obese humans and obese mice. Our results suggest that increase in adipose tissue–derived AGT contributes to circulating AGT level and resultant pathophysiology of obesity-related metabolic diseases.
Supplementary Material
Acknowledgments
We are grateful to Mrs A. Ryu, S. Maki, and Ms. M. Nagamoto for assistance. This work was supported in part by a Grant-in-Aid for Scientific Research (B2), Takeda Medical Research Foundation, and Lilly Research Foundation. Clinical Trial Registration Number: UMIN000001969.
Footnotes
Disclosure: The authors declared no conflict of interest.
References
- 1.Engeli S, Schling P, Gorzelniak K, Boschmann M, Janke J, Ailhaud G, Teboul M, Massiéra F, Sharma AM. The adipose-tissue renin-angiotensin-aldosterone system: role in the metabolic syndrome? Int J Biochem Cell Biol. 2002;35:807–825. doi: 10.1016/s1357-2725(02)00311-4. [DOI] [PubMed] [Google Scholar]
- 2.Dzau VJ. Circulating versus local renin-angiotensin system in cardiovascular homeostasis. Circulation. 1988;77:4–13. [PubMed] [Google Scholar]
- 3.Kurtz TW. Beyond the classic angiotensin-receptor-blocker profile. Nat Clin Pract Cardiovasc Med. 2008;5(Suppl 1):S19–S26. doi: 10.1038/ncpcardio0805. [DOI] [PubMed] [Google Scholar]
- 4.Yusuf S, Sleight P, Pogue J, Bosch J, Davies R, Dagenais G, The Heart Outcomes Prevention Evaluation Study Investigators Effects of an angiotensin-converting-enzyme inhibitor, ramipril, on cardiovascular events in high-risk patients. N Engl J Med. 2000;20:145–153. doi: 10.1056/NEJM200001203420301. [DOI] [PubMed] [Google Scholar]
- 5.Ogihara T, Nakao K, Fukui T, Fukiyama K, Saruta T. Clinical outcomes in hypertensive patients with high cardiovascular risks: principal results of candesartan antihypertensive survival evaluation in Japan (CASE-J) study; The 21st Scientific Meeting of the International Society of Hypertension; Fukuoka, Japan. 2006. [Google Scholar]
- 6.Massiera F, Bloch-Faure M, Ceiler D, Murakami K, Fukamizu A, Gasc JM, Quignard-Boulange A, Negrel R, Ailhaud G, Seydoux J, Meneton P, Teboul M. Adipose angiotensinogen is involved in adipose tissue growth and blood pressure regulation. FASEB J. 2001;15:2727–2729. doi: 10.1096/fj.01-0457fje. [DOI] [PubMed] [Google Scholar]
- 7.Giacchetti G, Faloia E, Mariniello B, Sardu C, Gatti C, Camilloni MA, Guerrieri M, Mantero F. Overexpression of the renin-angiotensin system in human visceral adipose tissue in normal and overweight subjects. Am J Hypertens. 2002;15:381–388. doi: 10.1016/s0895-7061(02)02257-4. [DOI] [PubMed] [Google Scholar]
- 8.Hainault I, Nebout G, Turban S, Ardouin B, Ferre P, Quignard-Boulange A. Adipose tissue-specific increase in angiotensinogen expression and secretion in the obese (fa/fa) Zucker rat. Am J Physiol Endocrinol Metab. 2002;282:E59–E66. doi: 10.1152/ajpendo.2002.282.1.E59. [DOI] [PubMed] [Google Scholar]
- 9.Katsurada A, Hagiwara Y, Miyashita K, Satou R, Miyata K, Ohashi N, Navar LG, Kobori H. Novel sandwich ELISA for human angiotensinogen. Am J Physiol Renal Physiol. 2007;293:F956–F960. doi: 10.1152/ajprenal.00090.2007. [DOI] [PMC free article] [PubMed] [Google Scholar]
- 10.Kobori H, Katsurada A, Miyata K, Ohashi N, Satou R, Saito T, Hagiwara Y, Miyashita K, Navar LG. Determination of plasma and urinary angiotensinogen levels in rodents by newly developed ELISA. Am J Physiol Renal Physio. 2008;294:F1257–F1263. doi: 10.1152/ajprenal.00588.2007. [DOI] [PMC free article] [PubMed] [Google Scholar]
- 11.Jernås M, Palming J, Sjöholm K, Jennische E, Svensson PA, Gabrielsson BG, Levin M, Sjögren A, Rudemo M, Lystig TC, Carlsson B, Carlsson LM, Lönn M. Separation of human adipocytes by size: hypertrophic fat cells display distinct gene expression. FASEB J. 2006;20:1540–1542. doi: 10.1096/fj.05-5678fje. [DOI] [PubMed] [Google Scholar]
- 12.McLaughlin T, Sherman A, Tsao P, Gonzalez O, Yee G, Lamendola C, Reaven GM, Cushman SW. Enhanced proportion of small adipose cells in insulin-resistant vs insulin-sensitive obese individuals implicates impaired adipogenesis. Diabetologia. 2007;50:1707–1715. doi: 10.1007/s00125-007-0708-y. [DOI] [PubMed] [Google Scholar]
- 13.Julien P, Despres JP, Angel A. Scanning electron microscopy of very small fat cells and mature fat cells in human obesity. J Lipid Res. 1989;30:293–299. [PubMed] [Google Scholar]
- 14.Arai N, Masuzaki H, Tanaka T, Ishii T, Yasue S, Kobayashi N, Tomita T, Noguchi M, Kusakabe T, Fujikura J, Ebihara K, Hirata M, Hosoda K, Hayashi T, Sawai H, Minokoshi Y, Nakao K. Ceramide and adenosine 5′-monophosphate-activated protein kinase are two novel regulators of 11β-hydroxysteroid dehydrogenase type 1 expression and activity in cultured preadipocytes. Endocrinology. 2007;148:5268–5277. doi: 10.1210/en.2007-0349. [DOI] [PubMed] [Google Scholar]
- 15.Friedman JM, Halaas JL. Leptin and the regulation of body weight in mammals. Nature. 1998;395:763–770. doi: 10.1038/27376. [DOI] [PubMed] [Google Scholar]
- 16.Masuzaki H, Ogawa Y, Isse N, Satoh N, Okazaki T, Shigemoto M, Mori K, Tamura N, Hosoda K, Yoshimasa Y, Jingami H, Kawada T, Nakao K. Human obese gene expression. Adipocyte-specific expression and regional differences in the adipose tissue. Diabetes. 1995;44:855–858. doi: 10.2337/diab.44.7.855. [DOI] [PubMed] [Google Scholar]
- 17.Umemura S, Nyui N, Tamura K, Hibi K, Yamaguchi S, Nakamaru M, Ishigami T, Yabana M, Kihara M, Inoue S, Ishii M. Plasma angiotensinogen concentrations in obese patients. Am J Hypertens. 1997;10:629–633. doi: 10.1016/s0895-7061(97)00053-8. [DOI] [PubMed] [Google Scholar]
- 18.Wajchenberg BL. Subcutaneous and visceral adipose tissue: their relation to the metabolic syndrome. Endocr Rev. 2000;21:697–738. doi: 10.1210/edrv.21.6.0415. [DOI] [PubMed] [Google Scholar]
- 19.Lönnqvist F, Nordfors L, Jansson M, Thörne A, Schalling M, Arner P. Leptin secretion from adipose tissue in women. Relationship to plasma levels and gene expression. J Clin Inves. 1997;99:2398–2404. doi: 10.1172/JCI119422. [DOI] [PMC free article] [PubMed] [Google Scholar]
- 20.Aubert J, Darimont C, Safonova I, Ailhaud G, Negrel R. Regulation by glucocorticoids of angiotensinogen gene expression and secretion in adipose cells. Biochem J. 1997;328:701–706. doi: 10.1042/bj3280701. [DOI] [PMC free article] [PubMed] [Google Scholar]
- 21.Bays HE, González-Campoy JM, Bray GA, Kitabchi AE, Bergman DA, Schorr AB, Rodbard HW, Henry RR. Pathogenic potential of adipose tissue and metabolic consequences of adipocyte hypertrophy and increased visceral adiposity. Expert Rev Cardiovasc Ther. 2008;6:343–368. doi: 10.1586/14779072.6.3.343. [DOI] [PubMed] [Google Scholar]
Associated Data
This section collects any data citations, data availability statements, or supplementary materials included in this article.