Abstract
The reporting interval of infectious diseases is often determined as a time unit in the calendar regardless of the epidemiological characteristics of the disease. No guidelines have been proposed to choose the reporting interval of infectious diseases. The present study aims at translating coarsely reported epidemic data into the reproduction number and clarifying the ideal reporting interval to offer detailed insights into the time course of an epidemic. We briefly revisit the dispersibility ratio, i.e. ratio of cases in successive reporting intervals, proposed by Clare Oswald Stallybrass, detecting technical flaws in the historical studies. We derive a corrected expression for this quantity and propose simple algorithms to estimate the effective reproduction number as a function of time, adjusting the reporting interval to the generation time of a disease and demonstrating a clear relationship among the generation-time distribution, reporting interval and growth rate of an epidemic. Our exercise suggests that an ideal reporting interval is the mean generation time, so that the ratio of cases in successive intervals can yield the reproduction number. When it is impractical to report observations every mean generation time, we also present an alternative method that enables us to obtain straightforward estimates of the reproduction number for any reporting interval that suits the practical purpose of infection control.
Keywords: disease outbreaks, infectious disease reporting, infection, statistical model, smallpox, influenza
1. Introduction
Notifications of infectious diseases occur in regular time intervals to inform infectious disease epidemiologists and public health officials about the magnitude of epidemics (Giesecke 2002). Case notification also gives information about (i) the time trends of infection, i.e. whether the time course of an epidemic is in the upward or downward direction, (ii) an indication of how steep the rise and fall elements are, and (iii) sometimes about the impact of intervention measures, e.g. if the introduction of mass vaccination results in a reduction in the number of infections (Chorba 2001). However, in many instances, the observed data do not permit capturing such a change in the epidemiological time course because the reporting interval is often defined as a time unit in the calendar (e.g. week, month or year) for practical convenience. Guidelines for choosing a specific reporting interval to understand the epidemiological dynamics of infectious diseases are currently lacking.
A statistical method to determine the reporting interval is density estimation, which may suggest a bin width to plot the histogram of case reports (Silverman 1986; Scott 1992). However, we expect that the epidemic curve spikes when successive waves of infections result in successive waves of reported cases, and in this sense, using bin width as recommended by density estimation (i.e. the reporting interval informed by the smoothing method) could suggest too coarse bins that smooth out several generations of cases occurring in a single reporting interval. To interpret the time course of an epidemic, case notifications are used to estimate a key variable that characterizes transmissibility with time. The effective reproduction number at time t, Rt, defined as the average number of secondary cases per primary case at time t (for t > 0), is a useful measure to inform about the transmission potential of a disease and indications of the expected number of secondary transmissions and of control efforts required to curb the epidemic (Ferguson et al. 2001, 2005; Haydon et al. 2003; Wallinga & Teunis 2004; Cauchemez et al. 2006a,b; Fraser 2007; Garske et al. 2007; White & Pagano 2008a,b). There are algorithms for transforming epidemic curves into the time course of Rt (Wallinga & Teunis 2004; Cauchemez et al. 2006a), but these require symptom onsets in fine time scale. Although the most precise reporting interval (e.g. reporting in a continuous time scale) would certainly yield the most ideal interpretation of the transmission dynamics, it is often impractical to report cases on an hourly or daily basis.
The present study proposes guidelines for selecting optimal reporting intervals, demonstrating that the ideal bin width should be determined by the distribution of the generation time, which is defined as the time from infection of a primary case to infection of a secondary case infected by the primary case (Svensson 2007). When it is impractical to report observations every mean generation time, we introduce an alternative simple algorithm to deal with interval censoring. In all cases, we show that the observed data permit obtaining straightforward estimates of the effective reproduction number that are useful for epidemic control. To understand the implications associated with the number of cases in a defined reporting interval, we start our discussion with a brief historical note on the earliest concept of Rt proposed by Clare Oswald Stallybrass (1881–1951).
2. Stallybrass's dispersibility
We first discuss a historical theory by Stallybrass who wrote one of the earliest epidemiologic textbooks, Principles of Epidemiology, in 1931 (Stallybrass 1931), proposing ‘dispersibility’ as one of the epidemiological markers (see electronic supplementary material for detailed historical account of Stallybrass). Dispersibility was defined as a measurement of the ‘total effect of factors affecting the spread of any specific infection at a given time and place’ (Stallybrass 1931), the factors of which he discussed include ‘sometimes intrinsic but more often depending upon either external or secondary factors’. Stallybrass calculated the ‘dispersibility ratio’ using epidemic data given in terms of the number of cases by reporting interval as follows:
 |
2.1 |
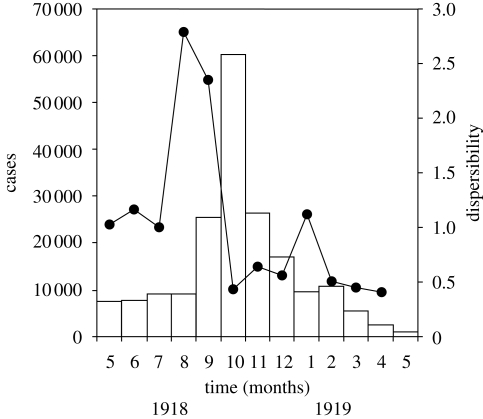
where the reporting interval A follows the preceding interval B of identical length (e.g. week or month). That is, taking the ratio of the numbers of cases in successive reporting intervals, he attempted to measure the transmissibility of a disease with time. Figure 1 shows the original (uncorrected) ratio of dispersibility using monthly reports of cases of pandemic influenza from 1918 to 1919 in the French army (Delater 1923) and equation (2.1). From the relative change of ratios with respect to time, he suggested that it is possible to roughly assess the time course of an epidemic.
Figure 1.
Stallybrass's dispersibility ratio for the monthly incidence of pandemic influenza in the French army from 1918 to 1919 (N =192 286). Taking ratios of the reported numbers of cases (bars) in successive reporting intervals, the dispersibility ratios were calculated (Stallybrass 1931). This figure was reproduced by the authors with reference to the original data (Delater 1923). Bars, cases; filled circles, dispersibility.
Nevertheless, the ratios did not highlight epidemiological characteristics (e.g. generation time) of the disease, not allowing the comparison of ratios obtained for different diseases. To address this issue, Stallybrass introduced a ‘correcting factor’, i.e.
| 2.2 |
where the numerator on the right-hand side corresponds to the reporting interval. It seems likely that he intended to make an adjustment of the dispersibility ratio by using a correction ratio of the reporting interval to an average interval between successive generations of cases. As examples, Stallybrass discussed the estimates of correcting factors for measles and influenza for weekly reported data; assuming that the mean incubation periods of measles and influenza are 11 and 2 days, respectively, he suggested the use of correcting factors of 7/11 = 0.63 and 7/2 = 3.5. A corrected dispersibility ratio was calculated as
 |
2.3 |
Unfortunately, the reason for multiplying the crude dispersibility with the correcting factor was not explained. Moreover, his arguments were missing an epidemiological interpretation of the absolute value of the ratio.
3. Correcting the dispersibility ratio
As a prelude to the estimation of Rt using coarsely reported data, here we correct the dispersibility ratio in the light of the relationship between the reproduction number and generation time (Roberts & Heesterbeek 2007; Wallinga & Lipsitch 2007) and show that this relationship enables us to adjust the reporting interval with respect to the mean generation time. The second earliest concept of the effective reproduction number was proposed by Nold (1979) who defined Rt using the mean generation time, μ, as follows:
 |
3.1 |
where C(t1, t2) denotes the number of cases observed during the time interval between t1 and t2. It should be noted that equation (3.1) implicitly assumes that the generation-time distribution g(τ) of length τ is given by a delta function (i.e. g(τ) equals 1 if τ = μ and 0 otherwise); see electronic supplementary material for further details of the definition of Rt by Nold. Considering a special case of an epidemic where a number of infected individuals experience geometric growth with a constant reproduction number R and a mean generation time μ (Lotz 1880; Nishiura et al. 2006), the expected number of cases in generations 0, 1, 2, … , i follows
 |
3.2 |
where a denotes the number of index cases. Supposing that the reporting interval, Δt, is exactly a multiple of the mean generation time (i.e. Δt = μn, where n is a positive integer), the numbers of cases in kth and (k+1)th reports, Jk and Jk+1, are
 |
3.3 |
and
 |
3.4 |
respectively, where a0 is the initial number of cases of the first generation in the kth reporting interval. Inspection of equations (3.3) and (3.4) suggests that the incidence ratio, Jk+1/Jk, yields Rn. Using the following n as an alternative correcting factor, i.e.
 |
3.5 |
an estimator of the reproduction number,  , is given by
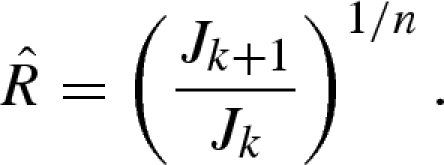 |
3.6 |
Two technical flaws in the Stallybrass dispersibility ratio were corrected. First, the generation time instead of the incubation period must be used as the denominator of the correcting factor. Second, in the light of geometric increase in infected individuals, instead of multiplying the correcting factor, the (1/n)th root of the ratio should have been taken to yield an estimate of the reproduction number, which is assumed constant over time. It should be noted that the above-mentioned linear arguments are appropriate only during the early phase of an epidemic or in an endemic situation (i.e. R = 1).
Even in situations when the reporting interval is not exactly a multiple of the mean generation time, the relationship between R and μ can be derived. Assuming exponential growth of cases with the intrinsic growth rate r, the ratio of cases in successive reports is given by Jk+1/Jk = exp(rΔt) (appendix A 3). If we further assume that the generation-time distribution follows a delta function with mean μ, R is given by exp(μr) (Wallinga & Lipsitch 2007), which results in the relationship shown in equation (3.6) where n, in this assumption, is a positive real number given by equation (3.5).
4. Estimation of R and ideal reporting interval
4.1. Approximating the epidemic curve
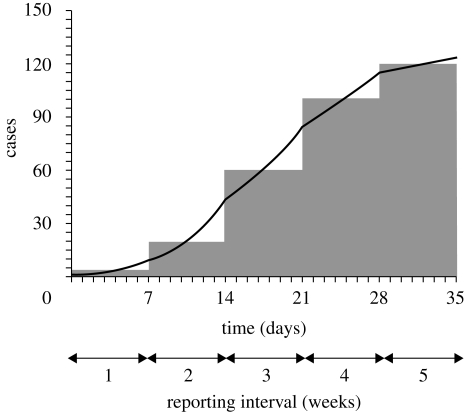
A constant R is limited to the case when exponential (or geometric) growth of cases is continuously observed over time or in an endemic state situation. Nevertheless, only with a slight extension of the model, the ratio of cases in successive reporting intervals would be extremely useful in offering an interpretation of the course of an epidemic, especially when the denominator of the ratio is sufficiently large. Our strategy is illustrated in figure 2. Even when we do not have access to data in fine time scale, the effective reproduction numbers, Rt, in each reporting interval can be estimated, assuming exponential (or geometric) increase in infected individuals in each interval. Assuming different growth rates by reporting interval, this offers an approximated epidemic curve.
Figure 2.
Approximation of an epidemic curve. Grey bars represent the reported number of cases in each reporting interval (i.e. weekly number of cases). The solid line represents our approximated epidemic curve assuming exponential (or geometric) increase in cases in each interval. It should be noted that the exponential growth rate (or the approximated constant reproduction number) in each interval differs by reporting interval.
Here we extend and correct the theory of the dispersibility ratio, examining two different historical datasets, i.e. epidemics of smallpox and influenza. For the case of smallpox, we examine monthly incidence of smallpox for the entire Netherlands from 1870 to 1873 (Ministerie van Binnenlandsche Zaken, The Netherlands, 1875). The epidemic of variola major started in January 1870 with 20 575 cases reported over a period of 48 months. The original data are available from the electronic supplementary material. The influenza dataset is the daily incidence of the fall wave of the Spanish influenza pandemic in San Francisco from 23 September to 24 November 1918, which was revisited previously (Department of Hygiene 1922; Chowell et al. 2007). A total of 28 310 influenza cases were reported during an observation period of 63 days. We selected these datasets to illustrate two different new methods in the following.
4.2. Smallpox: geometric approximation
Suppose that smallpox cases are reported only monthly. Because the generation time of smallpox is approximately half a month (Lotz 1880; Nishiura & Eichner 2007), it is difficult to estimate Rt by generation using monthly reports alone. Nevertheless, assuming that the reproduction numbers of two generations in a single reporting interval are identical, it is feasible to approximate Rt for each reporting interval. Let the effective reproduction numbers in reporting intervals k and k + 1 be Rk and Rk+1, respectively. We assume geometric growth of cases with a constant growth factor in each reporting interval. In a heterogeneously mixing population, Rk is interpreted as the average number of secondary cases generated by a typical primary case in the reporting interval k, which is given by the dominant eigenvalue of the next-generation matrix in that reporting interval (Diekmann & Heesterbeek 2000). Given an observation of Jk cases in interval k, the expected number of cases in the next interval k+1, E(Jk+1| Jk), is given by
 |
4.1 |
where n is the number of generations included in each reporting interval as expressed in equation (3.5) (appendix A 2). We employed a Poisson distribution to derive the maximum-likelihood estimate and uncertainty bound of Rk using the above-mentioned conditional expectation (4.1) (appendix A 2).
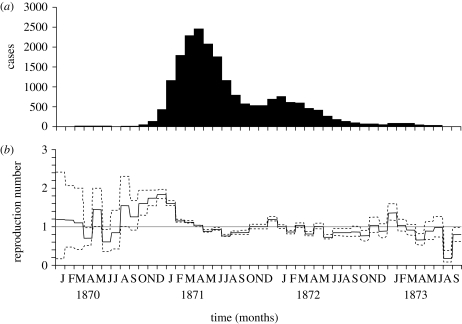
Assuming a mean generation time of 15 days for smallpox, we have exactly two generations (i.e. n = 2) for each monthly report. Applying equation (4.1) to the observed monthly smallpox incidence in The Netherlands, Rk can be estimated (figure 3). As Rk is estimated by the simple ratio of cases in equation (4.1), the model perfectly predicts the coarsely reported number of cases in each interval. The approximated Rt represents the increase and decrease in cases with time (figure 3b). The 95 per cent confidence interval (CI) is derived from the profile likelihood (appendix A 2). As the precision of the estimate is influenced by the observed number of cases (especially, by the denominator of the ratio in equation (4.1)), wide 95 per cent CIs are observed during the early and later stages of the epidemic.
Figure 3.
Monthly number of smallpox cases and the corresponding effective reproduction numbers. (a) Monthly number of smallpox cases for the entire Netherlands from 1870 to 1873 (Ministerie van Binnenlandsche Zaken, The Netherlands, 1875). (b) Time variation in the effective reproduction number (the number of secondary cases generated per primary case) with the corresponding 95 per cent CI (dashed lines) assuming there are exactly two generations in each reporting interval. The 95 per cent CI for Rt was derived from the profile likelihood. The generation time was assumed to be 15 days (Lotz 1880). The horizontal line represents the threshold value, Rt = 1, below which the epidemic will decline to extinction. Months are counted from January 1870 onwards; see electronic supplementary material for the original data.
It should be noted that when both Rk and Rk+1 are close to 1, equation (4.1) results in our correction of R in Stallybrass's dispersibility (i.e. equation (3.6)). Moreover, if n = 1 (i.e. if each reporting interval contains exactly one generation), equation (4.1) is reduced to
| 4.2 |
That is, if the reporting interval exactly corresponds to the mean generation time, the ratio of cases in successive reporting intervals, k and (k + 1), most reasonably estimates Rk.
To assess the approximation, i.e. if we can suggest the mean generation time as the reporting interval, the following condition representing the relationship between variance-to-mean ratio, σ2/μ, of the generation-time distribution and intrinsic growth rate, r0, of an epidemic is useful (appendix A 1):
 |
4.3 |
where td is the doubling time of a disease (i.e. the time required for infected individuals to double in size). Given that this condition is met, the mean generation time can be regarded as the ideal length of reporting interval to obtain reasonable estimates of the reproduction number.
4.3. Influenza: exponential approximation
The above discussed strategy for smallpox only applies when the reporting interval is an integer multiple of the generation time. When such a strategy is difficult to be applied, we instead assume exponential growth in each reporting interval using different growth rates for each interval. Let the exponential growth rates in intervals k and k+1 be rk and rk+1. Given the number of cases in interval k, Jk, the expected number of cases in the next interval k + 1, E(Jk+1| Jk), is
 |
4.4 |
where Δt is the length of the reporting interval (appendix A 3). Using the maximum-likelihood method (again employing a Poisson distribution), the growth rates rk are estimated for each reporting interval k. Subsequently, Rk in each interval k is estimated as
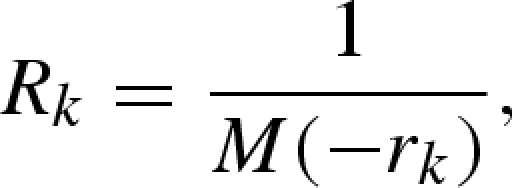 |
4.5 |
where M(−rk) is the moment-generating function of the generation-time distribution, given the growth rate, rk, which follows from the relationship between R and the intrinsic growth rate, r (Dublin & Lotka 1925; Wallinga & Lipsitch 2007). Similar to equation (4.1), the exponential growth with constant rk in a given reporting interval k is interpreted as an identical growth rate between subpopulations in a heterogeneously mixing population (i.e. the exponential growth rate rk is shared among the subpopulations).
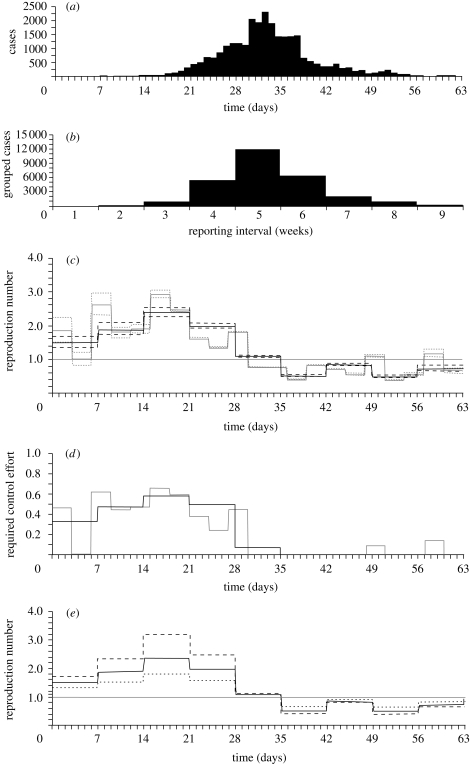
Figure 4a shows the estimated Rk using the daily incidence of the Spanish influenza pandemic in San Francisco. Although there is not yet a consensus on the generation time of influenza, with estimates ranging from 2.6 to 5.3 days (Fraser 2007), here we assume for simplicity that the mean μ is 3 days following recent studies (Carrat et al. 2008; White & Pagano 2008a). If we further assume that the generation-time distribution is given by a delta function, we can calculate Rk = exp(μrk), and make a comparison between our approximate Rk and another approximate Rt by each generation time (i.e. equation (4.2)). Again, we observe wide uncertainty bounds for Rk, where there are only a small number of cases. Nevertheless, even when we only have weekly reports of influenza in hand (figure 4b), figure 4c visually confirms overall a good approximation of Rk to Rt. Note that Rk is drawn according to the corresponding reporting interval k. Although the precision of Rk is limited for the coarsely reported data (see below), Rk based on weekly reports (or the prediction based on equation (4.4)) perfectly predicts the observed weekly data. It should be noted that the approximate Rk is still useful to observe the threshold condition (where Rk < 1), enabling us to understand the time course of an epidemic. It should also be noted that we get Rk > 1 for the fifth week of the epidemic (figure 4c), even though the number of cases in the next interval (i.e. sixth week) was smaller; this reflects dependency between adjacent reporting intervals (i.e. equation (4.4)). If we assume random mixing of individuals, 1 − 1/Rk suggests a required control effort to contain an epidemic (e.g. required coverage of mass vaccination in a given interval). Although homogeneous mixing is often not the case in reality, figure 4d would inform public health experts about an estimate of required effort and allow an assessment of control measures. Figure 4e shows time variations in the estimated reproduction numbers obtained from weekly data, assuming three different mean generation times (i.e. 2, 3 and 4 days). When Rk > 1, the longer the generation time, the higher the Rk we get; i.e. our analytical understanding in equation (4.5) is maintained even when the observation is coarsely reported. The relationship between the generation time and Rk is reversed when Rk < 1.
Figure 4.
Epidemic curve of influenza and the corresponding effective reproduction numbers. (a) Daily number of Spanish influenza cases in San Francisco during the autumn wave in 1918 (Department of Hygiene, Japanese Ministry of Interior 1922; Chowell et al., 2007). (b) Weekly number of influenza cases that were aggregated from the original daily data. (c) Time variation in the effective reproduction number (the number of secondary cases generated per primary case by generation) assuming that the mean generation time is 3 days. Approximated reproduction numbers by week (black) and reproduction numbers assuming a generation time of 3 days (grey) are comparatively shown. For the weekly report, Rk is drawn for the corresponding interval k. The horizontal line represents the threshold value, Rt = 1, below which the epidemic will decline to extinction. The 95 per cent CI for Rt was derived from the profile likelihood. Dotted line, 95 per cent CI (generation time); dashed line, 95 per cent CI (weekly data). (d) Required control effort (e.g. coverage of mass vaccination) to contain an epidemic given by 1–1/Rt. Following the expected values in (c), estimates by week (black) and 3 days (generation time; grey) are comparatively shown. (e) Comparison of the effective reproduction number based on weekly reports with different mean generation times. Expected values of the effective reproduction number are shown with a mean generation time of 2 (dotted line), 3 (solid line) and 4 (dashed line). The horizontal line again represents the threshold value, Rt = 1, below which the epidemic will decline to extinction. Days are counted from 23 September 1918 onwards (Department of Hygiene 1922).
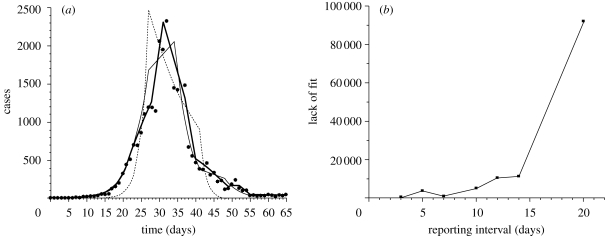
Figure 5a compares the approximated epidemic curves with the observed Spanish influenza cases in San Francisco in 1918 (Department of Hygiene, Japanese Ministry of Interior 1922). As the reporting interval increases, the quality of the approximation is diminished. Figure 5b measures the deviation of approximated curves from observed data as a function of reporting interval. The saturated model, which is useful when the number of parameters equals the number of data points, is employed, allowing comparison of the deviance (i.e. lack of fit) between different reporting intervals. Although a more explicit test of significance cannot be employed, figure 5b shows that a reporting interval whose length is two or three times the mean generation time still approximates well the crude picture of the epidemic curve; e.g. a reporting interval of 7 days yields smaller deviance (χ2 = 889.8) than that of 5 days (χ2 = 3436.4). However, when the interval is too long compared with generation time, the deviance is too large, and it is certainly difficult to capture the observed epidemic pattern. Furthermore, it should be noted that the prediction of weekly reports based on our algorithms is not influenced by the true length of generation time; as can be seen from equation (4.4), the linear approximation to the observed epidemic curve is independent of the generation-time distribution. The precision of approximating Rk using a fixed reporting interval is influenced by the length of generation time. Reporting intervals that are shorter or close to the mean generation time yield more precise Rk than longer reporting intervals (§5).
Figure 5.
Evaluation of approximated epidemic curves. (a) Comparisons between observed (dots) and predicted daily number of Spanish influenza cases in San Francisco during the autumn wave in 1918 (Department of Hygiene, Japanese Ministry of Interior 1922), using the proposed algorithm for Rt estimation, assuming three different reporting intervals: the mean generation time (3 days; thick line), one week (thin line) and two weeks (dashed line). (b) Assessment of the goodness of fit with various reporting intervals. Mean generation time is assumed to be 3 days. Vertical axis (lack of fit) reflects χ2 measured by the saturated model, calculated as  where Ot and Et are observed and expected numbers of cases at day t, and p is the number of parameters estimated.
5. Discussion
The present study recommends that the reporting interval for case notifications should be taken equal to the mean generation time. This permits estimation of Rt by taking the ratio of cases in successive reporting intervals. If the mean generation time is short, and it is impractical to report observations in every generation time, our alternative algorithm (i.e. equation (4.4)) permits an explicit adjustment of the ratio of cases in successive reports to yield Rt. The method suffers from wide uncertainty when there is only a small number of cases (e.g. during early and late stages of an epidemic), but our approach greatly improves previous similar intent (Honhold et al. 2004) in that our method can yield a strictly interpretable quantity, Rt, to understand the epidemiological pattern of spread. To the best of our knowledge, this study is the first to estimate the effective reproduction numbers from coarsely reported data by adjusting the reporting interval based on the generation time and discussing the ideal length of reporting intervals in relation to the epidemiological characteristics of a disease. Although the interval of case notification may frequently be influenced by administrative factors, we believe that the present study provides a basis to choose the reporting interval, thereby offering a practical guide for the relevant considerations.
With historical reference to Stallybrass's dispersibility ratio (Stallybrass 1931), we have shown that the ratio of cases in successive reporting intervals is an interpretable measure in a special case (i.e. constant R over time), clarifying technical flaws in the original descriptions by Stallybrass. Moreover, explicitly adjusting the reporting interval to mean generation time, we extended Stallybrass's dispersibility ratio to estimate Rt, approximating the observed epidemic curve by assuming constant growth rates in each reporting interval. Approximating Rt can still capture thresholds and suggest required control efforts, helping public health experts understand the time course explicitly.
Our second algorithm (equation (4.4)) is particularly useful when the reporting interval is shorter than the mean generation time (i.e. Δt < μ, or equivalently, n < 1 where n, in this assumption, is a positive real number). When a single reporting interval does not include several different generations, a short reporting interval with n < 1 can more precisely reflect the transmissibility with time, because n < 1 indicates that infection of cases observed in an interval more likely had happened in previous intervals (not within the same interval) than the case for n > 1, allowing us to precisely capture Rt. Both of our proposed algorithms assume linear growth in each interval, by considering the corresponding interval as separate from its adjacent intervals. Theoretically, it is certainly better to have more precise data (e.g. observation in a continuous time scale) than coarsely reported data in order to fully capture the dependency of infected individuals between adjacent time periods. Considering that only the ratio can account for the dependency between infected individuals in our approaches, we get a straightforward conclusion for our second algorithm: the smaller n is and the smaller the variance-to-mean ratio of the generation-time distribution is, the more precise the estimates of Rk that are obtained.
As a technical note, our method is not suitable for infectious diseases with extremely long generation times (compared with the reporting interval, e.g. in HIV/AIDS). This technical limitation is identical to that of the method given previously (Wallinga & Teunis 2004), and therefore a different approach has to be employed for slowly progressing diseases (Gran et al. 2008). Moreover, the distribution of generation times has to be carefully interpreted for approximation, especially when the distribution is right skewed. Although the mean generation time, μ, is used to calculate the correcting factor, the variance-to-mean ratio needs to be examined in relation to the doubling time to precisely suggest the length of the reporting interval (appendix A 1). When the generation-time distribution is skewed, our second algorithm should be used to estimate Rt because equation (4.5) translates the exponential growth rates in each reporting interval to Rt, highlighting the skewed nature of the generation-time distribution. The estimate of Rt is obtained without too apparent deviations from the observed data when the reporting interval is two or three times the mean generation time, but the approximation is worsened as the interval becomes much longer than the mean generation time.
To use our algorithm in various practical settings, it should be noted that our estimation procedures made the following assumptions.
We are dealing with epidemics where demographic stochasticity (i.e. variation in the numbers of secondary transmissions by chance) is negligible. In other words, we have an unbiased estimator of the growth rate rk or the reproduction number Rk.
Deterministic exponential (or geometric) growth of cases is assumed in each reporting interval. The growth rate is the same for all subpopulations.
The number of cases in each interval is measured with perfect accuracy (i.e. no underreporting and no reporting delay).
Although we can do only little to address point (iii), technical discussions with respect to (i) and (ii) are needed. With regard to (i), we did not explicitly highlight stochasticity in the transmission process. A recent study suggested the use of an analytical solution of a stochastic epidemic model to address this issue (Cauchemez & Ferguson 2008), which also partly addressed point (iii). The reporting delay is extremely important in that the most recent estimates of the reproduction number could be biased downwards to zero without accounting for the delay (Cauchemez & Ferguson 2008). Moreover, adjustment of the time variations in the underreporting and reporting delay requires substantial effort in modelling approaches, and this task often necessitates having further empirical data and employing additional model assumptions. When the observed epidemic is not in large scale, it is particularly important to explicitly account for this point, and thus a more rigorous method using a stochastic approach is desirable. Point (ii) becomes our technical concern when the ratio of reporting interval to generation time (n in equation (3.5)) is particularly large. For example, monthly influenza reports (figure 1) may well include n > 10 generations per interval (assuming that μ < 3 days) where our linear approximation may no longer be useful for interpreting the observed epidemic curve. When n is too large, a nonlinear approximation, e.g. accounting for the depletion of susceptibles, might be needed. In addition, other strategies of approximation (e.g. power law approximation) for infection process could be conceived (Finkenstadt & Grenfell 2000; Bjornstad et al. 2002) when the motivation of analysis is not to interpret the epidemic time series with an explicit measure of transmissibility. Point (iii), as well as heterogeneous patterns in transmission, is a common concern for real-time epidemic modelling (Wallinga & Teunis 2004; Cauchemez et al. 2006a; Fraser 2007) that has to be addressed as more detailed data become available (e.g. cases with time and place and with the length of reporting delay). For instance, in addition to a full clarification of the impact of reporting delay on the estimation framework of Rt, improvements in the observation and reporting are needed (rather than adding mechanistic model assumptions). If one keeps these points in mind, we believe our simple algorithms (equations (4.1) and (4.4)) provide useful tools, yielding reasonable estimates of Rt and enabling an assessment of the epidemic curve.
Whereas we have shown that the distribution of the generation time plays a key role in interpreting the epidemiological time course of an epidemic, it should be noted that the methods for estimating the generation time have yet to be fully established (e.g. clarification of the most useful field data that lead to an estimate of generation time, and thus are useful for estimating R). In particular, the generation time in heterogeneously mixing population in relation to our condition (4.3) is a topic of future research. Moreover, it is impossible to know the generation time of a newly emerging infectious disease in a population. Therefore, besides the need to develop statistical methods for quantifying the generation-time distribution from empirical observation, it is suggested that notification of emerging infectious diseases needs to be reported as precisely as the public health authority can achieve. Moreover, when it is difficult to fully quantify the generation-time distribution, our study emphasizes the importance of quantifying, at least, the mean generation time so that we can understand the epidemiological time course.
Reporting cases in a fine time scale is crucial for many purposes, but it is often impractical in the public health field to collect and report disease data in very precise time intervals owing to financial, logistic and technical constraints. From our exercise, we showed that the use of the mean generation time as the ideal reference length for the reporting interval of surveillance would be extremely useful to estimate the effective reproduction number. To obtain a quick view of the time course of an epidemic, reporting cases every mean generation time would allow the estimation simply by using a ratio of cases in adjacent reporting intervals, yet saving the cost of reporting in a very short interval. Calculation of the ratio does not require difficult computations. Thus, for example, if the current reporting interval of a disease is close to the mean generation time, one may revise the interval to the mean generation time and estimate the effective reproduction number without spending much additional effort.
Acknowledgements
This work was supported by The Netherlands Organisation for Scientific Research (NWO grant ID: 918.56.620 and 851.40.074). G.C. received funding from the College of Liberal Arts and Sciences of Arizona State University.
Appendix A
A.1. An ideal length of the reporting interval
To suggest a condition in which the mean generation time can be reasonably used as a reporting interval, we consider the relationship between the generation-time distribution (with mean μ and variance σ2), reporting interval, Δt, and the intrinsic growth rate of an epidemic, r0 (Keyfitz 1968). Following the classic mathematical definition of the length of generation in demography by Lotka (Keyfitz 1968), it is deemed ideal if the reporting interval Δt satisfies the following relationship (i.e. if Δt itself exactly corresponds to the length of generation):
| A 1 |
where R0 is the basic reproduction number that satisfies equation (4.5) in the main text, i.e. R0 = 1/M(−r0). Let K(−r0) be the cumulant-generating function of generation time (i.e. K(−r0) = ln{M(−r0)}), then we can expand the cumulant-generating function as
 |
A 2 |
where {κj} are the cumulants of the generation-time distribution (e.g. κ1 = μ and κ2 = σ2). Thus, the ideal Δt that satisfies equation (A 1) is approximated as
 |
A 3 |
When μ >>σ2r0/2, equation (A 3) suggests that Δt should be approximated by the mean generation time μ. This condition results in equation (4.3) in the main text (note that td = ln 2/r0). When the variance-to-mean ratio, σ2/μ, of the generation time is large, the ideal length of the reporting interval, Δt, should be derived directly from equation (A 3).
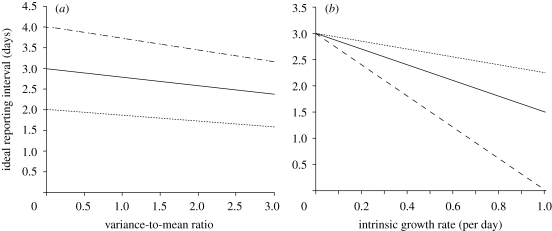
Figure 6a,b shows sensitivity of Δt to the different σ2/μ and r0 for the plausible parameter space of human influenza (μ = 3 days and r0 = 0.14 per day; Ferguson et al. 2005; Chowell et al. 2007; White & Pagano 2008a). When σ2/μ is 0 (i.e. σ2 = 0), Δt would be exactly the same as the mean generation time (figure 6a), which is certainly expected from equation (A 1). Δt is in general slightly shorter than the mean generation time for σ2 > 0. Especially, when the distribution is extremely skewed (e.g. σ2/μ = 3.0), the mean generation time is apparently longer than Δt. The tendency of observing shorter Δt than μ is more pronounced when the intrinsic growth rate r0 is large (figure 6b), especially for a skewed generation-time distribution. These figures highlight the critical importance in empirically investigating both the generation-time distribution and the intrinsic growth rate.
Figure 6.
The relationship between the ideal reporting interval, variance-to-mean ratio of the generation-time distribution and the intrinsic growth rate. Sensitivity of ideal reporting interval to different variance-to-mean ratio and the intrinsic growth rate is examined for plausible ranges of the parameters for human influenza (Ferguson et al. 2005; Chowell et al. 2007; White & Pagano 2008a). (a) The ideal reporting interval as a function of variance-to-mean ratio of the generation-time distribution. The intrinsic growth rate is fixed at 0.14 per day. Three different mean generation times (i.e. 2, 3 and 4 days) are examined: dotted line, 2 days; solid line, 3 days; dashed line, 4 days. (b) The ideal reporting interval as a function of the intrinsic growth rate. The mean generation time is fixed at 3 days. Three different variance-to-mean ratios (0.5, 1.0 and 2.0) of the generation-time distribution are examined: dotted line, 0.5; solid line, 1.0; dashed line, 2.0.
A.2. Geometric approximation of Rt
We assume that the reporting interval Δt is a multiple of the mean generation time μ and denote the ratio of Δt to μ by n (where n, in this assumption, is a positive integer given by equation (3.5) in the main text). Supposing that the effective reproduction numbers in kth and (k+1)th reports are Rk and Rk+1, respectively, the numbers of cases in kth and (k+1)th reports, Jk and Jk+1, are
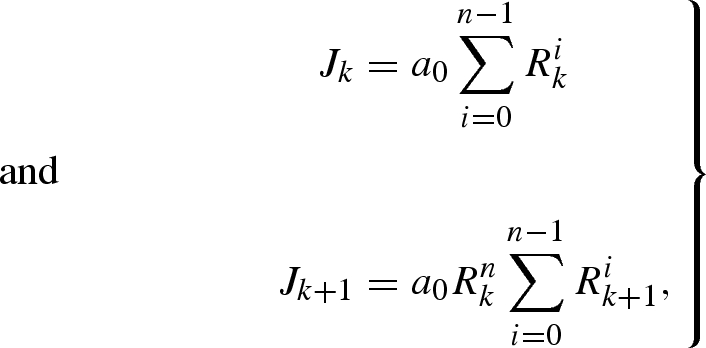 |
A 4 |
where a0 is the initial number of cases of the first generation in the kth reporting interval. Thus, assuming that the expected numbers of cases in each reporting interval are sufficient to characterize Poisson distributions, the conditional distribution of Jk+1 given Jk is
 |
A 5 |
For observation of cases from reporting interval 1 to K, the likelihood of estimating Rk is given by
 |
A 6 |
Maximum-likelihood estimates of Rk were obtained by minimizing the negative logarithm of equation (A 6). The 95 per cent CI for Rk was derived from the profile likelihood. It should be noted that the Poisson approximation is an ad hoc assumption, and the variance of Rk would be biased when the number of cases is small (see the main text about the wide uncertainty bound with small denominator). Alternatively, it is also possible to employ a bootstrap method to quantify the uncertainty bounds of Rk (and the method is particularly useful as the sampling distribution of Rk is not simple), but the bootstrap method can only capture the sampling error and does not account for stochasticity (as similar to the likelihood employing a Poisson distribution). To fully account for both sampling error and stochasticity, pure birth process may be called for (Bailey 1964). It should be noted, however, that the variance of Rk (or growth rate rk) greatly depends on an appropriateness of our linear approximation to the empirical observation within each reporting interval. Because of variations in linear approximation between different lengths of reporting interval, the estimated variance with a given length of reporting interval is not comparable with those based on different lengths of reporting interval.
When Rk is constant over time (=R), equation (A 5) results in an interpretation of the corrected Stallybrass dispersibility ratio, i.e. equation (3.6) in the main text. Moreover, when n = 1 (i.e. when the reporting interval is exactly the mean generation time), the likelihood function (A 6) is reduced to
 |
A 7 |
A.3. Exponential approximation of Rt
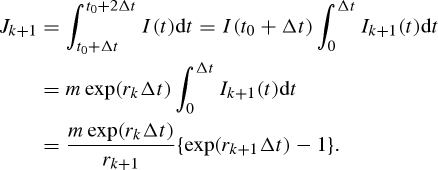
Let rk and rk+1, respectively, be exponential growth rates in reporting intervals k and k + 1. We assume that the intervals k and k + 1 correspond to periods (t0, t0 + Δt) and (t0 + Δt, t0 + 2Δt), respectively, in calendar time scale, where Δt is the length of the reporting interval. We denote the incidence (i.e. number of newly infected individuals) at time t by I(t) and assume that I(t0) = m, where m is constant. Following the exponential growth, we get I(t0 + t) = m exp(rkt) (=mIk(t)) in interval k and I(t0 + Δt + t) = I(t0+Δt)exp(rk+1t) (=I(t0 + Δt)Ik+1(t)) in interval k + 1. Accordingly, Jk and Jk+1 are given by
 |
A 8 |
and
 |
A 9 |
Taking the ratio of Jk+1 to Jk, we get equation (4.4) in the main text. Maximum-likelihood estimates of rk were obtained similarly as in equation (A 6). As is done using equation (A 6), the 95 per cent CI for Rk was computed by the profile likelihood. It should be noted that when rk is constant over time (=r), this results in Jk+1/Jk = exp(rΔt) as discussed in the main text, offering an interpretation of Stallybrass's dispersibility ratio (Stallybrass 1931).
References
- Bailey N. T. J.1964The elements of stochastic processes with applications to the natural sciences New York, NY: Wiley [Google Scholar]
- Bjornstad O. N., Finkenstadt B. F., Grenfell B. T.2002Dynamics of measles epidemics: estimating scaling of transmission rates using a time series SIR model. Ecol. Monogr. 72, 169–184 [Google Scholar]
- Carrat F., Vergu E., Ferguson N. M., Lemaitre M., Cauchemez S., Leach S., Valleron A. J.2008Time lines of infection and disease in human influenza: a review of volunteer challenge studies. Am. J. Epidemiol. 167, 775–785 (doi:10.1093/aje/kwm375) [DOI] [PubMed] [Google Scholar]
- Cauchemez S., Ferguson N. M.2008Likelihood-based estimation of continuous-time epidemic models from time-series data: application to measles transmission in London. J. R. Soc. Interface 5, 885–897 (doi:10.1098/rsif.2007.1292) [DOI] [PMC free article] [PubMed] [Google Scholar]
- Cauchemez S., Boëlle P. Y., Thomas G., Valleron A. J.2006aEstimating in real time the efficacy of measures to control emerging communicable diseases. Am. J. Epidemiol. 164, 591–597 (doi:10.1093/aje/kwj274) [DOI] [PubMed] [Google Scholar]
- Cauchemez S., Boelle P. Y., Donnelly C. A., Ferguson N. M., Thomas G., Leung G. M., Hedley A. J., Anderson R. M., Valleron A. J.2006bReal-time estimates in early detection of SARS. Emerg. Infect. Dis. 12, 110–113 [DOI] [PMC free article] [PubMed] [Google Scholar]
- Chorba T. L.2001Disease surveillance. In Epidemiologic methods for the study of infectious diseases (eds Thomas J. C., Weber D. J.), pp. 138–162 New York, NY: Oxford University Press [Google Scholar]
- Chowell G., Nishiura H., Bettencourt L. M.2007Comparative estimation of the reproduction number for pandemic influenza from daily case notification data. J. R. Soc. Interface 4, 155–166 (doi:10.1098/rsif.2006.0161) [DOI] [PMC free article] [PubMed] [Google Scholar]
- Delater 1923La Grippe Dans La Nation Armée De 1918 A 1921. Revue d'Hygiene 45, 406–426 [In French.] [Google Scholar]
- Department of Hygiene, Japanese Ministry of Interior 1922Influenza (Ryukousei Kanbou) Tokyo, Japan: Ministry of Interior; [In Japanese.] [Google Scholar]
- Diekmann O., Heesterbeek J. A. P.2000. In Mathematical epidemiology of infectious diseases: model building, analysis and interpretation Chichester, UK: John Wiley and Sons [Google Scholar]
- Dublin L. I., Lotka A. J.1925On the true rate of natural increase. J. Am. Stat. Assoc. 151, 305–339 (doi:org/10.2307/2965517) [Google Scholar]
- Ferguson N. M., Donnelly C. A., Anderson R. M.2001Transmission intensity and impact of control policies on the foot and mouth epidemic in Great Britain. Nature 413, 542–548 (doi:10.1038/35097116) [DOI] [PubMed] [Google Scholar]
- Ferguson N. M., Cummings D. A. T., Cauchemez S., Fraser C., Riley S., Meeyai A., Iamsirithaworn S., Burke D. S.2005Strategies for containing an emerging influenza pandemic in Southeast Asia. Nature 437, 209–214 (doi:10.1038/nature04017) [DOI] [PubMed] [Google Scholar]
- Finkenstadt B. F., Grenfell B. T.2000Time series modeling of childhood diseases: a dynamical systems approach. Appl. Stat. 49, 187–205 (doi:org/10.1111/1467-9876.00187) [Google Scholar]
- Fraser C.2007Estimating individual and household reproduction numbers in an emerging epidemic. PLoS ONE 2, e758 (doi:10.1371/journal.pone.0000758) [DOI] [PMC free article] [PubMed] [Google Scholar]
- Garske T., Clarke P., Ghani A. C.2007The transmissibility of highly pathogenic avian influenza in commercial poultry in industrialised countries. PLoS ONE 2, e349 (doi:10.1371/journal.pone.0000349) [DOI] [PMC free article] [PubMed] [Google Scholar]
- Giesecke J.2002Modern infectious disease epidemiology, 2nd edn London, UK: Arnold [Google Scholar]
- Gran J. M., Wasmuth L., Amundsen E. J., Lindqvist B. H., Aalen O. O.2008Growth rates in epidemic models: application to a model for HIV/AIDS progression. Stat. Med. 27, 4817–4834 (doi:10.1002/sim.3219) [DOI] [PubMed] [Google Scholar]
- Haydon D. T., Chase-Topping M., Shaw D. J., Matthews L., Friar J. K., Wilesmith J., Woolhouse M. E.2003The construction and analysis of epidemic trees with reference to the 2001 UK foot-and-mouth outbreak. Proc. R. Soc. B 270, 121–127 (doi:10.1098/rspb.2002.2191) [DOI] [PMC free article] [PubMed] [Google Scholar]
- Honhold N., Taylor N. M., Mansley L. M., Paterson A. D.2004Relationship of speed of slaughter on infected premises and intensity of culling of other premises to the rate of spread of the foot-and-mouth disease epidemic in Great Britain, 2001. Vet. Rec. 155, 287–294 [DOI] [PubMed] [Google Scholar]
- Keyfitz N.1968Introduction to the mathematics of population London, UK: Addison-Wesley Publishing Co [Google Scholar]
- Lotz T.1880Pocken und vaccination. Bericht über die Impffrage, erstattet im Namen der schweizerischen Sanitätskommission an den schweizerischen Bundersrath Basel, Switzerland: Benno Schwabe, Verlagsbuchhandlung; [In German.] [Google Scholar]
- Ministerie van Binnenlandsche Zaken, The Netherlands 1875. In De pokken-epidemie in Nederland in 1870–1873 s'Gravenhage, The Netherlands: Van Weelden en Mingelen; [In Dutch.] [Google Scholar]
- Nishiura H., Eichner M.2007Infectiousness of smallpox relative to disease age: estimates based on transmission network and incubation period. Epidemiol. Infect. 135, 1145–1150 (doi:org/10.1017/S0950268806007618) [DOI] [PMC free article] [PubMed] [Google Scholar]
- Nishiura H., Dietz K., Eichner M.2006The earliest notes on the reproduction number in relation to herd immunity: Theophil Lotz and smallpox vaccination. J. Theor. Biol. 241, 964–967 (doi:10.1016/j.jtbi.2006.01.012) [DOI] [PubMed] [Google Scholar]
- Nold A.1979The infectee number at equilibrium for a communicable disease. Math. Biosci. 46, 131–138 (doi:10.1016/0025-5564(79)90020-8) [Google Scholar]
- Roberts M. G., Heesterbeek J. A.2007Model-consistent estimation of the basic reproduction number from the incidence of an emerging infection. J. Math. Biol. 55, 803–816 (doi:10.1007/s00285-007-0112-8) [DOI] [PMC free article] [PubMed] [Google Scholar]
- Scott D. W.1992Multivariate density estimation. Theory, practice and visualization New York, NY: Wiley [Google Scholar]
- Silverman B. W.1986Density estimation London, UK: Chapman and Hall [Google Scholar]
- Stallybrass C. O.1931The principles of epidemiology and the process of infection London, UK: George Routledge & Sons, Ltd [Google Scholar]
- Svensson A.2007A note on generation times in epidemic models. Math. Biosci. 208, 300–311 (doi:10.1016/j.mbs.2006.10.010) [DOI] [PubMed] [Google Scholar]
- Wallinga J., Lipsitch M.2007How generation intervals shape the relationship between growth rates and reproductive numbers. Proc. R. Soc. B. 274, 599–604 (doi:10.1098/rspb.2006.3754) [DOI] [PMC free article] [PubMed] [Google Scholar]
- Wallinga J., Teunis P.2004Different epidemic curves for severe acute respiratory syndrome reveal similar impacts of control measures. Am. J. Epidemiol. 160, 509–516 (doi:10.1093/aje/kwh255) [DOI] [PMC free article] [PubMed] [Google Scholar]
- White L. C., Pagano M.2008aA likelihood-based method for real-time estimation of the serial interval and reproductive number of an epidemic. Stat. Med. 27, 2999–3016 (doi:org/10.1002/sim.3136) [DOI] [PMC free article] [PubMed] [Google Scholar]
- White L. C., Pagano M.2008bTransmissibility of the influenza virus in the 1918 pandemic. PLoS ONE 3, e1498 (doi:10.1371/journal.pone.0001498) [DOI] [PMC free article] [PubMed] [Google Scholar]


