

Abstract
There is currently a shortage of chemical molecules that can be used as bioactive probes to study molecular targets and potentially as starting points for drug discovery. One inexpensive way to address this problem is to use computational methods to screen a comprehensive database of small molecules to discover novel structures that could lead to alternative and better bioactive probes. Despite that pleasing logic the results have been somewhat mixed. Here we describe a virtual screening technique based on ligand–receptor shape complementarity, Ultrafast Shape Recognition (USR). USR is specifically applied to identify novel inhibitors of arylamine N-acetyltransferases by computationally screening almost 700 million molecular conformers in a time- and resource-efficient manner. A small number of the predicted active compounds were purchased and tested obtaining a confirmed hit rate of 40 per cent which is an outstanding result for a prospective virtual screening.
Keywords: drug lead identification, ligand–receptor shape complementarity, prospective virtual screening, molecular shape similarity
The current paradigm of drug discovery is based on the inhibition of a key macromolecule for the development of a targeted disease. This inhibition can be achieved by binding a small drug molecule to the active site of such macromolecular target, usually a protein, in which case the molecule is said to be biologically active. It is often the case that a known active molecule does not provide a viable starting point for drug discovery and development due to toxicological, potency, selectivity or intellectual property issues. In these circumstances one wants to identify alternative molecules that retain the desired biological activity of the initial lead but that are devoid of its disadvantages. Empirical testing of large numbers of chemical compounds (high throughput screening) has been widely and successfully employed as a source of new drug leads. However, the huge costs of large-scale experimental testing and very slow operation in practice (Peakman et al. 2003) have motivated research on computational approaches for the virtual screening of molecules in silico.
In ligand-based virtual screening, a computational method is used to search a database of molecules for those that most closely resemble an active molecule acting as the template. Here we focus on similarity in terms of three-dimensional molecular shape, which has been widely highlighted as an important pattern for which to search (Zauhar et al. 2003; Rush et al. 2005; Kortagere et al. 2009), among other reasons because a degree of complementarity between the shape of the drug molecule and that of its macromolecular receptor is necessary for binding. Indeed, without such complementarity, the ligand and receptor atoms involved in binding would not be sufficiently close to form favourable interactions. Therefore, similarly shaped molecules will be able to fit the same binding pocket and thus are likely to exhibit similar biological activity.
Unfortunately, there exist several challenges for methods using molecular shape as the pattern to recognize. The most important of these challenges are related to the issue of computational efficiency. First, shape information is regarded as difficult to encode efficiently and use in database searching (Zauhar et al. 2003). Furthermore, the increasing size of molecular databases poses a serious limitation to the use of shape recognition methods, where this increase is mainly motivated by our desire to cover a wider region of the biologically relevant chemical space and thus improve the likelihood of finding innovative drug candidates. Consequently, it is of great importance to develop shape recognition methods able to screen a molecular database as fast as possible. Indeed, it has been highlighted (Dobson 2004) that the availability of very fast, reliable virtual screening methods would be of tremendous value in drug discovery.
Recently, one of the authors devised (Ballester 2007) a new molecular shape-matching technique, called Ultrafast Shape Recognition (USR). USR is based on the observation that the shape of a molecule is uniquely determined by the relative position of its atoms. This three-dimensional spatial arrangement of atoms is in turn accurately described by a set of one-dimensional distributions of atomic distances measured from four strategically located reference locations. A highly concise encoding of molecular shape is ultimately achieved by characterizing each of the resulting four distributions of atomic distances by its first three statistical moments. The shape similarity of two molecules is finally calculated through an inverse of the sum of least absolute differences in their respective moments (figure 1 shows an example of USR-based shape comparison). USR has been shown (Ballester & Richards 2007a,b) to be effective at comparing molecular shapes while being thousands of times faster than pre-existing methods (Ballester & Richards 2007a). Thus, USR offers the possibility of application to databases of much greater size using many more active templates than previously possible. There are already a number of successful applications of USR in the literature (Cannon et al. 2008; Nguyen et al. 2008; Ballester et al. 2009; Schreyer & Blundell 2009).
Figure 1.

(a) USR encoding. The shape of the molecule is characterized by the distributions of atomic distances to four strategic reference locations. In turn, each of these distributions is described through its first three statistical moments. In this way, each molecule has associated a vector of 12 shape descriptors. (b) USR comparison. In order to establish the degree of similarity between the shape of two molecules, the Manhattan distance between the corresponding vectors of shape descriptors is calculated. Thereafter, this dissimilarity is monotonically inverted so as to define a normalized similarity score, where greater shape similarity is represented by scores nearer to 1. USR uses this score to determine which are the most similarly shaped molecules in a database to a given query molecule.
Here we present the first prospective virtual screening application of USR. A prerequisite for such application is the availability of a database of compounds that are either commercially available or are synthetically tractable. Using more than five million commercially available compounds extracted from the ZINC online repository (http://zinc7.docking.org/, last accessed on 25 August 2008; Irwin & Shoichet 2005), we generated a multi-conformational molecular database of about 690 million molecular conformers with Omega v. 2.1 (OpenEye Scientific Software, Inc., http://www.eyesopen.com). It is in databases of this size where USR becomes extremely useful. Indeed, USR performs 100 searches on such a large molecular database, a total of 69 billion shape comparisons, in just 83 min using a single 2.93 GHz dual-core processor. By contrast, ESshape3D, the shape comparison tool from one of the most widely used molecular modelling software packages MOE, would take almost three months under the same conditions (Ballester et al. 2009).
We are interested in a member of an important family of drug targets known as arylamine N-acetyltransferases (NATs). Arylamine NATs have been identified (Russell et al. 2009) as drug- and carcinogen-metabolizing enzymes. Human NAT1 (hNAT1) is one of the two functional NAT enzymes in humans. hNAT1 and its murine homologue mouse Nat2 (mNat2) are expressed in many different adult tissues (Ohsako & Deguchi 1990; Cribb et al. 1991; Risch et al. 1996; Stanley et al. 1996; Hickman et al. 1998; Wu et al. 2007). Endogenous roles relating to acetyl coenzyme A (AcCoA) lipid homeostasis (Richards et al. 2004) or folate catabolism (Minchin et al. 1995) have been proposed for hNAT1. mNat2 has been shown to acetylate the folate catabolite p-aminobenzoylglutamate (pABAglu) in vivo (Wakefield et al. 2007). Nevertheless, the precise endogenous role of hNAT1 remains unknown. Recent microarray work has confirmed that the hNAT1 gene is one of the 10 most highly overexpressed genes in oestrogen-receptor positive (ER+) breast cancer cells (Tozlu et al. 2006). It has been also identified using protein detection that hNAT1 is overexpressed in certain ER+ breast cancer cell lines (Wakefield et al. 2008). The complex relationship between hNAT1 polymorphisms and expression, breast cancer and neural tube development may result from a functional link in vivo between NAT1 acetylation activity and folate metabolism (Cribb et al. 1991; Wakefield et al. 2007; Sim et al. 2008). Moreover, it has been demonstrated (Minchin 1995) that the intra-tumoral dysregulation of xenobiotic-metabolizing enzyme expression in breast cancer can explain drug resistance, by altered drug metabolism and bioavailability. Among these drugs, tamoxifen has also been shown to inhibit the acetylation activity of hNAT1 (Lee et al. 1997, 2004; Lu et al. 2001). As suggested by these studies, a better understanding of the functional link between hNAT1 and ER+ has become crucial in order to evaluate hNAT1 as an attractive potential biomarker in human breast cancer. The discovery of novel NAT inhibitors could contribute to understanding this link better as well as potentially providing novel therapeutical agents that overcome drug resistance. In this study, we will be using mNat2 as a model for hNAT1 based on its homology to hNAT1 at the level of sequence identity, particularly at the C-terminus. In addition, mNat2 is considered functionally analogous to hNAT1 in terms of tissue and developmental expression as well as sharing a very similar substrate specificity profile (Chung et al. 1993; Boukouvala et al. 2002; Kawamura et al. 2005; Hein et al. 2006; Loehle et al. 2006; Walraven et al. 2007; Kawamura et al. 2008; Sim et al. 2008). Although hNAT1 has been produced in sufficient quantities for structural studies (Wu et al. 2007), in this laboratory we have found for screening purposes that mNat2 is more stable and can be produced in higher quantities as a recombinant protein (Kawamura et al. 2008; Russell et al. 2009).
The prospective virtual screening was carried out as follows. USR was used to search our database for molecules similar in shape to a competitive inhibitor of mNat2 (IC50 = 1.1 µM). This template molecule was the most potent compound among a small manual screen of 5000 cherry-picked compounds (full details of this screen can be found in Russell et al. (2009)), and it is the subject of an ongoing patent application. The confirmed hit rate of this empirical screen was five hits specific for mNat2 at less than 10 µM out of the 5000 compounds. From the ranking of conformers according to USR similarity to the template, we formed a ranking of compounds by considering the USR similarity score of the highest ranking conformer of each compound. As we assigned a very modest budget (£500) for this proof of concept, we selected just 23 compounds from the very top of the ranked list based on costs and availability (all but the last compound were within the top 0.003% of the ranked list). The purchased compounds were empirically tested for pure recombinant mouse Nat2 activity at an inhibitor concentration of 10 µM. Nine out of the 23 tested compounds exhibited a mean percentage of inhibition greater than 50 per cent at 10 µM, as can be observed in figure 2.
Figure 2.

Percentage of inhibition of the solution without any compound (NIL), the query molecule (compound 0) and the 23 USR hits (compounds 1–23) against pure recombinant mouse Nat2 at 10 µM inhibitor concentration. The activity of mouse Nat2 was determined in the presence of AcCoA by measuring the rate of depletion of the arylamine pABA with the reagent DTNB as described in §1.5. Bars in the plot represent the mean ± s.d. of quadruplicate measurements. Assays were carried out over a 15 min time period in a 96-well microplate. Nine out of the 23 USR hits exhibited mean percentage of inhibition greater than 50 at this concentration.
In order to validate the results from the primary screening, all 23 compounds were re-tested at various inhibitor concentrations (the resulting IC50 values are reported in table 1). By comparing with the primary screening, it is observed that there are three false positives (compounds 12, 16 and 18) and three false negatives (compounds 4, 6 and 14). Therefore, with activity criterion IC50 less than 10 µM, there are nine confirmed actives out of the 23 tested compounds (compounds 1, 2, 3, 4, 5, 6, 8, 14 and 17). This constitutes a confirmed hit rate of 39.1 per cent and represents an outstanding performance for a prospective virtual screening experiment. The latter becomes evident when compared with the 0.1 per cent confirmed hit rate obtained by the empirical screen against the same target using the same activity criterion.
Table 1.
IC50 values and MACCS Tanimoto score with respect to the template molecule (compound 0) for each of the 23 compounds found with USR. IC50 values were determined as described in the Methods section. Structural similarity with respect to the query molecule was calculated with the MACCS fingerprint search implemented at MOE molecular modelling software. The low scores obtained demonstrate the ability of USR to find biologically active compounds with different chemical structure. In particular, all four USR hits with IC50 below 3 µM have a MACCS Tanimoto score below 0.38, which demonstrates that these found actives are remarkably dissimilar in chemical structure to the query molecule and thus can be considered as alternative starting points for the lead optimization process.
| compound | IC50 (µM) | MACCS | USR |
|---|---|---|---|
| 0 | 1.10 | 1.000 | 1.000 |
| 1 | 1.17 | 0.333 | 0.969 |
| 2 | 7.71 | 0.691 | 0.954 |
| 3 | 2.05 | 0.222 | 0.966 |
| 4 | 9.22 | 0.691 | 0.954 |
| 5 | 3.08 | 0.563 | 0.960 |
| 6 | 5.35 | 0.300 | 0.955 |
| 7 | 15.87 | 0.318 | 0.954 |
| 8 | 2.88 | 0.319 | 0.955 |
| 9 | >50 | 0.311 | 0.956 |
| 10 | >50 | 0.310 | 0.956 |
| 11 | 23.24 | 0.280 | 0.963 |
| 12 | >50 | 0.301 | 0.966 |
| 13 | 41.77 | 0.379 | 0.956 |
| 14 | 4.54 | 0.642 | 0.956 |
| 15 | >50 | 0.606 | 0.950 |
| 16 | 14.13 | 0.373 | 0.952 |
| 17 | 2.33 | 0.377 | 0.950 |
| 18 | 15.70 | 0.457 | 0.951 |
| 19 | >50 | 0.346 | 0.925 |
| 20 | >50 | 0.345 | 0.956 |
| 21 | >50 | 0.345 | 0.956 |
| 22 | >50 | 0.247 | 0.954 |
| 23 | >50 | 0.337 | 0.964 |
It could be found surprising that a method based on ligand–receptor shape complementarity alone can in some cases perform so well. After all, including additional chemical information relevant to binding, beyond that implicitly included in shape, should enhance its ability to discriminate between active and inactive molecules. Following this rationale, molecular docking, which typically ranks molecules according to the evaluation of a very detailed binding energy formula, should consistently perform better than methods using less chemical information. Unfortunately, as discussed by Shoichet (2004), docking has the drawback that accurate binding affinity calculation for many thousands of diverse molecules remains beyond our reach to date and hence it is only feasible to use less accurate binding energy estimation in large-scale virtual screening, which harms the effectiveness of these techniques.1 In practice, it has been shown (Hawkins et al. 2007; Kirchmair et al. 2009) that shape similarity performs at least as well as a range of docking methods. Moreover, a previous prospective virtual screening study concluded (Rush et al. 2005) that an accurate description of shape alone is unexpectedly powerful. These results demonstrate that, although the incorporation of additional chemical information into a method has the potential to improve its performance, the inaccuracies in such a challenging process can make simpler, but more reliable, methods perform better.
Another important performance criterion is the ability of a virtual screening method to find active molecules with chemical scaffolds that are substantially different from that of the query molecule. Figure 3 shows the active compound used as the template along with the three most potent compounds found with USR, with all these compounds having potency similar to that of the template. We observed that, while all actives are very similar in shape, their chemical structure is remarkably different from that of the template (we are unable to show the structure of the molecule used as the template since it is currently being patented). This is evidenced by the corresponding similarity scores, which are above 0.96 in the case of shape and below 0.38 in terms of chemical structure (both scores are between 0 and 1, with higher values indicating higher similarity). Moreover, as these first three active hits belong to three different chemical series, each of them can potentially be considered as alternative starting points for the lead optimization process. In fact, we observed that none of the nine actives share a common scaffold with the template, which is corroborated by their low structural similarity scores (see electronic supplementary material, table S2). These results demonstrate that USR is particularly useful for scaffold hopping.
Figure 3.

(a) Shapes, (b) chemical structure and (c) half-maximal inhibitory concentration against pure recombinant mouse Nat2 for the query molecule and the three most potent active molecules found by USR (from left to right: S0USR = 1.000, S1USR = 0.969, S3USR = 0.966 and S17USR = 0.950). The shapes of these conformers are aligned manually in order to appreciate their similarity (alignments are not a byproduct of USR operation, as this method does not require alignments to compare molecules). While being very similarly shaped, these USR hits have no common scaffold and thus belong to different chemical series. These are also remarkably different in structure with respect to the query molecule, as evidenced by the corresponding MACCS Tanimoto score (S0MACCS = 1.000, S1MACCS = 0.333, S3MACCS = 0.222 and S17MACCS = 0.377). Such scaffold hopping is a very valuable feature of a virtual screening method, as each chemical series can be considered as an alternative starting point for the lead optimization process.
USR is a new technology that is able to computationally screen much larger molecular databases using many more template molecules than previously possible. The expected increase in active molecules in the public domain thanks to programs such as the US NIH Molecular Libraries Initiative (Kaiser 2008) allied with the use of very large and fast growing public databases such as ZINC opens the door to very exciting prospects for virtual screening methods able to cope with this data explosion. Indeed, as larger databases of diverse molecules cover wider regions of the chemical space, the widespread application of USR to very large databases is expected to result in significantly higher numbers of bioactive molecules being discovered. This has been the case in this first prospective virtual screening study, where USR has discovered an unusually high proportion of structurally novel bioactive molecules among more than five million database molecules. The results in this paper are directly relevant to those scientists interested in NAT targets, who could be interested in using the reported active structures as probes to investigate relevant cellular pathways or as alternative starting points for the drug lead optimization process. As some degree of ligand–receptor shape complementarity is a universal requirement for binding, USR could be useful for any target with at least one known potent inhibitor, although hit rates will vary greatly depending on a number of factors (Ballester et al. 2009). Looking more broadly, USR is also of interest for those working on shape selectivity in zeolite catalysis (Smit & Maesen 2008), exploring the potential energy surface of molecular clusters (Nguyen et al. 2008) or comparing protein binding sites (Sommer et al. 2007).
1. Methods
1.1. Ultrafast Shape Recognition
USR is based on the observation that the shape of a molecule is uniquely determined by the relative position of its atoms. Such positions are in turn determined by the set of all interatomic distances. This set contains more information than is needed to describe the shape of the molecule accurately, so it is possible to significantly reduce the associated computational cost while maintaining accuracy by selecting a suitable subset of interatomic distances. Namely, the set of all atomic distances from four molecular locations are considered: the molecular centroid (ctd), the closest atom to ctd (cst), the farthest atom from ctd (fct) and the farthest atom from fct (ftf). In this way, each molecular conformation is described by four distributions of atomic distances, where the number of atomic distances is proportional to the number of atoms. This raises the obvious question of how to compare molecules with different number of atoms. That difficulty is circumvented by defining a fixed number of rotationally invariant moments of the one-dimensional distributions, whose values characterize the shape of the molecule considered.
The calculation of USR descriptors is as follows: for each molecule in the database, first, the three dimensional position vector for each atom is read. Thereafter, the geometrical center (centroid) of the molecule is determined from the atomic positions. Next, the set of Euclidean distances of all atoms to the molecular centroid is calculated. These are regarded as the full population of the distribution of all atomic distances from the molecular centroid:
 |
1.1 |
where N is the number of atoms of the molecule.
The next stage of the process is to calculate the moments of this discrete distribution in order to characterize the geometry of the molecule and thus its shape. The first moment μ1ctd is the average atomic distance to the molecular centroid and thus it provides an estimate of the molecular size. The second moment μ2ctd is the square root of the variance of these atomic distances about μ1ctd. The third moment μ3ctd is the cube root of the skewness of these atomic distances about μ1ctd, i.e. a measure of the asymmetry of the distribution. These roots are intended to provide all moments with linear space dimension, typically angstroms, in order to avoid differences in higher order moments overshadowing the contribution to the similarity score of lower order moments (this is an improvement over the original version (Ballester & Richards 2007b) and it is fully described in Ballester (2007)). To calculate the remaining nine descriptors, we repeat the process for each of the three remaining distributions: {djcst}j =1N, {djfct}j =1N and {djftf}j =1N, where the superscript indicates the location from where the atomic distances are calculated. Of course, one can include more reference locations or higher order moments leading to more descriptors and thus an even more accurate description of shape. However, we selected the first three moments from each of four considered one-dimensional distributions to describe a molecule M = (μ1ctd, μ2ctd, μ3ctd, μ1cst, μ2cst, μ3cst, μ1fct, μ2fct, μ3fct, μ1ftf, μ2ftf, μ3ftf), since this choice provided an excellent compromise between the efficiency and the effectiveness of the method.
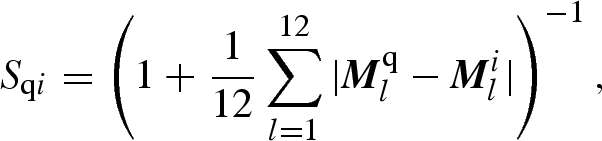
Once the USR descriptors are available (these are calculated only once at a rate of over 16 000 conformers per second using a single processing core), a score quantifying the similarity between molecules based on these descriptors is required to rank the conformers in a database according to their shape similarity to a given template. First, the Manhattan distance between the vectors of shape descriptors of the query and the currently screened conformer is calculated and divided by the number of descriptors. The resulting dissimilarity measure is transformed into a normalized similarity score by translating the dissimilarity by one unit and inverting the resulting value. Other ways to define a normalized similarity score could be of course adopted, as long as the similarity score is inverse monotonic with respect to the dissimilarity, so as to preserve the ranking order. The similarity score function Sqi is therefore
 |
1.2 |
where Mq and Mi are the vectors of shape descriptors for the query and ith screened conformer, respectively.
1.2. Molecular database
The multi-conformational molecular database used in this study was generated from the ZINC online repository (http://zinc7.docking.org/, last accessed on 25 August 2008; Irwin & Shoichet 2005), a publicly available and free resource. We downloaded all chemical structures in subsets 4–6, which constituted a set of more than 5.3 million molecules. Conformer generation software Omega 2.1 was used with the default settings, except that the maximum number of conformers per molecule was set to 30 000. The resulting database had 690 309 132 conformers and hence contained an average of 130 conformers per compound.
1.3. MACCS structural similarity
Each chemical structure is described in this method by a bit string called MACCS fingerprint, where each bit or feature indicates the presence or absence of one of the 166 public MDL structural key (essentially, a set of pre-selected functional groups). The degree of similarity of two structures is thereafter established by calculating the Tanimoto score of both strings. We use the implementation of MACCS fingerprint available at the Molecular Operating Environment (MOE) molecular modelling software package (MOE v. 2006.08; Chemical Computing Group Inc., Montreal, Canada; http://www.chemcomp.com).
1.4. Chemical purity and provenance of purchased compounds
Each of the compounds purchased was identified as greater than 95 per cent pure by high-performance liquid chromatography (HPLC) and the identification was assessed by 1H NMR at a concentration of between 2.5 and 4 mg ml−1 to prove that they were as stated from the manufacturer. For two of the compounds, their identity could not be unambiguously determined by 1H NMR, and for these compounds, 13C NMR and low-resolution mass spectrometry was carried out and the spectra obtained in each case were compatible with the compound purchased. These data are the subject of a separate communication.
1.5. Activity assays
The measurement of NAT activity used pure recombinant mNat2 and the rate of hydrolysis of AcCoA in the presence of substrate was identified (Brooke et al. 2003a). Inhibition of the hydrolysis of AcCoA was measured as described by Brooke et al. (2003b). The rate of formation of coenzyme A (CoA) as a result of AcCoA hydrolysis was determined spectrophotometrically using the colorimetric agent 5,5′-dithio-bis(2-nitrobenzoic acid) (Ellman's reagent, DTNB) as previously described (Brooke et al. 2003a), with the following modifications. The extent of reaction is measured by detecting the coloured 5-thio-2-nitrobenzoic acid, which is produced by the reaction of DTNB with free thiol CoA formed during the NAT reaction and has a maximum absorbance at 412 nm (Riddles et al. 1983; Brooke et al. 2003a). Samples of pure mNat2 (5 ng) were pre-incubated with pABA (500 µM final concentration) in assay buffer (20 mM Tris-HCl, pH 8.0) for 5 min at 37°C in a 96-well plate (Corning). Pre-warmed (37°C) AcCoA (400 µM final concentration) in assay buffer was added to start the reaction (final volume of 100 µl), which was allowed to proceed at 37°C. Simultaneous quenching and colour development was achieved by addition of the stop reagent: 25 µl DTNB solution (5 mM DTNB in 100 mM Tris-HCl, 6.4 M guanidine-HCl, pH 7.3). The absorbance was read immediately after addition of the stop reagent at the wavelength closest to 412 nm, which is available using a plate reader (Tecan Sunrise), i.e. at 405 nm. The rate of reaction was determined from the linear initial section of graphs of absorbance versus time and by reference to a standard curve. In the inhibitor assays, minor alterations were introduced in order that 5 µl of the requisite compound could be added at various concentrations without changing the final assay volume or reagent concentrations. All the tested compounds were dissolved in dimethylsulphoxide (DMSO) and the final percentage of DMSO in the assay was 5 per cent (v/v). Inhibition percentages were determined as the ratio of the specific activity with the requisite compound to the specific activity without inhibitor. IC50 values were estimated graphically from plots of specific activities versus inhibitor concentration by using Kyplot software. A dose–response function was used as a model of regression for the data, and the curves were estimated by the method of the least squares analysis.
Acknowledgements
We thankfully acknowledge funding from the US National Foundation for Cancer Research, the Wellcome Trust and Oxford University. We would also like to thank John Irwin and Brian Shoichet for making the ZINC database freely available and Openeye Scientific Software for an academic license of the Omega software granted to Edith Sim. We are grateful to Angela Russell for help with characterization of the purity and identity of the purchased compounds.
Authors' contributions statement. P.J.B. devised and implemented USR as well as carried out the virtual screening. I.W. generated the multi-conformational molecular database and selected the USR hits to be purchased as explained in the manuscript. N.L. and I.W. tested the purchased compounds. E.S. supervised the binding assays and provided a detailed description of target and assay properties. P.J.B. wrote the manuscript, using figures generated by N.L. and P.J.B. All authors discussed results and commented on the manuscript.
Footnotes
Of course, the value of docking is not limited to its performance on targets with previously known actives. Unlike ligand-based techniques, docking can be applied to cases where there are still no known active molecules provided that the structure of the target is available. Also, docking models are useful to predict how ligands bind to their receptor, which is important at the drug lead optimization stage.
References
- Ballester P. J. 2007. Shape recognition methods and systems for searching molecular databases. US Patent No. 12/127559. [Google Scholar]
- Ballester P. J., Richards W. G. 2007a. Ultrafast shape recognition for similarity search in molecular databases. Proc. R. Soc. A 463, 1307–1321. ( 10.1098/rspa.2007.1823) [DOI] [Google Scholar]
- Ballester P. J., Richards W. G. 2007b. Ultrafast shape recognition to search compound databases for similar molecular shapes. J. Comput. Chem. 28, 1711–1723. ( 10.1002/jcc.20681) [DOI] [PubMed] [Google Scholar]
- Ballester P. J., Finn P. W., Richards W. G. 2009. Ultrafast shape recognition: evaluating a new ligand-based virtual screening technology. J. Mol. Graph. Model. 27, 836–845. ( 10.1016/j.jmgm.2009.01.001) [DOI] [PubMed] [Google Scholar]
- Boukouvala S., Price N., Sim E. 2002. Identification and functional characterization of novel polymorphisms associated with the genes for arylamine N-acetyltransferases in mice. Pharmacogenetics 12, 385–394. ( 10.1097/00008571-200207000-00006) [DOI] [PubMed] [Google Scholar]
- Brooke E. W., Davies S. G., Mulvaney A. W., Pompeo F., Sim E., Vickers R. J. 2003a. An approach to identifying novel substrates of bacterial arylamine N-acetyltransferases. Bioorg. Med. Chem. 11, 1227–1234. ( 10.1016/S0968-0896(02)00642-9) [DOI] [PubMed] [Google Scholar]
- Brooke E. W., Davies S. G., Mulvaney A. W., Okada M., Pompeo F., Sim E., Vickers R. J., Westwood I. M. 2003b. Synthesis and in vitro evaluation of novel small molecule inhibitors of bacterial arylamine N-acetyltransferases (NATs). Bioorg. Med. Chem. Lett. 13, 2527–2530. ( 10.1016/S0960-894X(03)00484-0) [DOI] [PubMed] [Google Scholar]
- Cannon E. O., Nigsch F., Mitchell J. B. O. 2008. A novel hybrid ultrafast shape descriptor method for use in virtual screening. Chem. Cent. J. 2, 3 ( 10.1186/1752-153X-2-3) [DOI] [PMC free article] [PubMed] [Google Scholar]
- Chung J. G., Levy G. N., Weber W. W. 1993. Distribution of 2-aminofluorene and p-aminobenzoic acid N-acetyltransferase activity in tissues of C57BL/6J rapid and B6.A-NatS slow acetylator congenic mice. Drug Metab. Dispos. 21, 1057–1063. [PubMed] [Google Scholar]
- Cribb A. E., Grant D. M., Miller M. A., Spielberg S. P. 1991. Expression of monomorphic arylamine N-acetyltransferase (NAT1) in human leukocytes. J. Pharmacol. Exp. Ther. 259, 1241–1246. [PubMed] [Google Scholar]
- Dobson C. M. 2004. Chemical space and biology. Nature 432, 824–828. ( 10.1038/nature03192) [DOI] [PubMed] [Google Scholar]
- Hawkins P. C. D., Skillman A. G., Nicholls A. 2007. Comparison of shape-matching and docking as virtual screening tools. J. Med. Chem. 50, 74–82. ( 10.1021/jm0603365) [DOI] [PubMed] [Google Scholar]
- Hein D. W., Doll M. A., Nerland D. E., Fretland A. J. 2006. Tissue distribution of N-acetyltransferase 1 and 2 catalyzing the N-acetylation of 4-aminobiphenyl and O-acetylation of N-hydroxy-4-aminobiphenyl in the congenic rapid and slow acetylator Syrian hamster. Mol. Carcinog. 45, 230–238. ( 10.1002/mc.20164) [DOI] [PubMed] [Google Scholar]
- Hickman D., Pope J., Patil S. D., Fakis G., Smelt V., Stanley L. A., Payton M., Unadkat J. D., Sim E. 1998. Expression of arylamine N-acetyltransferase in human intestine. Gut 42, 402–409. ( 10.1136/gut.42.3.402) [DOI] [PMC free article] [PubMed] [Google Scholar]
- Irwin J. J., Shoichet B. K. 2005. ZINC—a free database of commercially available compounds for virtual screening. J. Chem. Inf. Model. 45, 177–182. ( 10.1021/ci049714+) [DOI] [PMC free article] [PubMed] [Google Scholar]
- Kaiser J. 2008. Industrial-style screening meets academic biology. Science 321, 764–766. ( 10.1126/science.321.5890.764) [DOI] [PubMed] [Google Scholar]
- Kawamura A., Graham J., Mushtaq A., Tsiftsoglou S. A., Vath G. M., Hanna P. E., Wagner C. R., Sim E. 2005. Eukaryotic arylamine N-acetyltransferase: investigation of substrate specificity by high-throughput screening. Biochem. Pharmacol. 69, 347–359. ( 10.1016/j.bcp.2004.09.014) [DOI] [PubMed] [Google Scholar]
- Kawamura A., Westwood I., Wakefield L., Long H., Zang N., Walters K., Redfield C., Sim E. 2008. Mouse N-acetyltransferase type 2, the homologue of human N-acetyltransferase type 1. Biochem. Pharmacol. 75, 1550–1560. ( 10.1016/j.bcp.2007.12.012) [DOI] [PMC free article] [PubMed] [Google Scholar]
- Kirchmair J., Distinto S., Markt P., Schuster D., Spitzer G. M., Liedl K. R., Wolber G. 2009. How to optimize shape-based virtual screening: choosing the right query and including chemical information. J. Chem. Inf. Model. 49, 678–692. ( 10.1021/ci8004226) [DOI] [PubMed] [Google Scholar]
- Kortagere S., Krasowski M. D., Ekins S. 2009. The importance of discerning shape in molecular pharmacology. Trends Pharmacol. Sci. 30, 138–147. ( 10.1016/j.tips.2008.12.001) [DOI] [PMC free article] [PubMed] [Google Scholar]
- Lee J. H., Chung J. G., Lai J. M., Levy G. N., Weber W. W. 1997. Kinetics of arylamine N-acetyltransferase in tissues from human breast cancer. Cancer Lett. 111, 39–50. ( 10.1016/S0304-3835(96)04491-6) [DOI] [PubMed] [Google Scholar]
- Lee J. H., Lu H. F., Wang D. Y., Chen D. R., Su C. C., Chen Y. S., Yang J. H., Chung J. G. 2004. Effects of tamoxifen on DNA adduct formation and arylamines N-acetyltransferase activity in human breast cancer cells. Res. Commun. Mol. Pathol. Pharmacol. 115–116, 217–233. [PubMed] [Google Scholar]
- Loehle J. A., Cornish V., Wakefield L., Doll M. A., Neale J. R., Zang Y., Sim E., Hein D. W. 2006. N-acetyltransferase (Nat) 1 and 2 expression in Nat2 knockout mice. J. Pharmacol. Exp. Ther. 319, 724–728. ( 10.1124/jpet.106.108662) [DOI] [PubMed] [Google Scholar]
- Lu K. H., Lin K. L., Hsia T. C., Hung C. F., Chou M. C., Hsiao Y. M., Chung J. G. 2001. Tamoxifen inhibits arylamine N-acetyltransferase activity and DNA-2-aminofluorene adduct in human leukemia HL-60 cells. Res. Commun. Mol. Pathol. Pharmacol. 109, 319–331. [PubMed] [Google Scholar]
- Minchin R. F. 1995. Acetylation of p-aminobenzoylglutamate, a folic acid catabolite, by recombinant human arylamine N-acetyltransferase and U937 cells. Biochem. J. 307, 1–3. [DOI] [PMC free article] [PubMed] [Google Scholar]
- Nguyen Q. C., Ong Y. S., Soh H., Kuo J. L. 2008. Multiscale approach to explore the potential energy surface of water clusters (H2O)nn≤8. J. Phys. Chem. A 112, 6257–6261. ( 10.1021/jp802118j) [DOI] [PubMed] [Google Scholar]
- Ohsako S., Deguchi T. 1990. Cloning and expression of cDNAs for polymorphic and monomorphic arylamine N-acetyltransferases from human liver. J. Biol. Chem. 265, 4630–4634. [PubMed] [Google Scholar]
- Peakman T., Franks S., White C., Beggs M. 2003. Delivering the power of discovery in large pharmaceutical organizations. Drug Discov. Today 8, 203–211. ( 10.1016/S1359-6446(03)02612-6) [DOI] [PubMed] [Google Scholar]
- Richards V. E., Chau B., White M. R., McQueen C. A. 2004. Hepatic gene expression and lipid homeostasis in C57BL/6 mice exposed to hydrazine or acetylhydrazine. Toxicol. Sci. 82, 318–332. ( 10.1093/toxsci/kfh232) [DOI] [PubMed] [Google Scholar]
- Riddles P. W., Blakeley R. L., Zerner B. 1983. Reassessment of Ellman's reagent. Methods Enzymol. 91, 49–60. ( 10.1016/S0076-6879(83)91010-8) [DOI] [PubMed] [Google Scholar]
- Risch A., Smelt V., Lane D., Stanley L., van der Slot W., Ward A., Sim E. 1996. Arylamine N-acetyltransferase in erythrocytes of cystic fibrosis patients. Pharmacol. Toxicol. 8, 235–240. ( 10.1111/j.1600-0773.1996.tb00211.x) [DOI] [PubMed] [Google Scholar]
- Rush T. S., III, Grant J. A., Mosyak L., Nicholls A. 2005. A shape-based 3-D scaffold hopping method and its application to a bacterial protein–protein interaction. J. Med. Chem. 48, 1489–1495. ( 10.1021/jm040163o) [DOI] [PubMed] [Google Scholar]
- Russell A. J., et al. 2009. Selective small molecule inhibitors of the potential breast cancer marker, human arylamine N-acetyltransferase 1, and its murine homologue, mouse arylamine N-acetyltransferase 2. Bioorg. Med. Chem. 17, 905–918. ( 10.1016/j.bmc.2008.11.032) [DOI] [PubMed] [Google Scholar]
- Schreyer A., Blundell T. L. 2009. CREDO: a protein-ligand interaction database for drug discovery. Chem. Biol. Drug Des. 73, 157–167. ( 10.1111/j.1747-0285.2008.00762.x) [DOI] [PubMed] [Google Scholar]
- Shoichet B. K. 2004. Virtual screening of chemical libraries. Nature 432, 862–865. ( 10.1038/nature03197) [DOI] [PMC free article] [PubMed] [Google Scholar]
- Sim E., Walters K., Boukouvala S. 2008. Arylamine N-acetyltransferases: from structure to function. Drug Metab. Rev. 40, 479–510. ( 10.1080/03602530802186603) [DOI] [PubMed] [Google Scholar]
- Smit B., Maesen T. L. M. 2008. Towards a molecular understanding of shape selectivity. Nature 451, 671–678. ( 10.1038/nature06552) [DOI] [PubMed] [Google Scholar]
- Sommer I., Müller O., Domingues F. S., Sander O., Weickert J., Lengauer T. 2007. Moment invariants as shape recognition technique for comparing protein binding sites. Bioinformatics 23, 3139–3146. ( 10.1093/bioinformatics/btm503) [DOI] [PubMed] [Google Scholar]
- Stanley L. A., Coroneos E., Cuff R., Hickman D., Ward A., Sim E. 1996. Immunochemical detection of arylamine N-acetyltransferase in normal and neoplastic bladder. J. Histochem. Cytochem. 44, 1059–1067. [DOI] [PubMed] [Google Scholar]
- Tozlu S., Girault I., Vacher S., Vendrell J., Andrieu C., Spyratos F., Cohen P., Lidereau R., Bieche I. 2006. Identification of novel genes that co-cluster with estrogen receptor alpha in breast tumor biopsy specimens, using a large-scale real-time reverse transcription-PCR approach. Endocr. Relat. Cancer 13, 1109–1120. ( 10.1677/erc.1.01120) [DOI] [PubMed] [Google Scholar]
- Wakefield L., Cornish V., Long H., Griffiths W. J., Sim E. 2007. Deletion of a xenobiotic-metabolizing gene in mice affects folate metabolism. Biochem. Biophys. Res. Commun. 364, 556–560. ( 10.1016/j.bbrc.2007.10.026) [DOI] [PMC free article] [PubMed] [Google Scholar]
- Wakefield L., Robinson J., Long H., Ibbitt J. C., Cooke S., Hurst H. C., Sim E. 2008. Arylamine N-acetyltransferase 1 expression in breast cancer cell lines: a potential marker in estrogen receptor-positive tumors. Genes Chromosomes Cancer 47, 118–126. ( 10.1002/gcc.20512) [DOI] [PubMed] [Google Scholar]
- Walraven J. M., Barker D. F., Doll M. A., Hein D. W. 2007. Tissue expression and genomic sequences of rat N-acetyltransferases rNat1, rNat2, rNat3, and functional characterization of a novel rNat3*2 genetic variant. Toxicol. Sci. 99, 413–421. ( 10.1093/toxsci/kfm159) [DOI] [PMC free article] [PubMed] [Google Scholar]
- Wu H., Dombrovsky L., Tempel W., Martin F., Loppnau P., Goodfellow G. H., Grant D. M., Plotnikov A. N. 2007. Structural basis of substrate-binding specificity of human arylamine N-acetyltransferases. J. Biol. Chem. 282, 30 189–30 197. ( 10.1074/jbc.M704138200) [DOI] [PubMed] [Google Scholar]
- Zauhar R. J., Moyna G., Tian L., Li Z., Welsh W. J. 2003. Shape signatures, a new approach to computer-aided ligand- and receptor-based drug design. J. Med. Chem. 46, 5674–5690. ( 10.1021/jm030242k) [DOI] [PubMed] [Google Scholar]