Abstract
We generalize a recently proposed model for cholera epidemics that accounts for local communities of susceptibles and infectives in a spatially explicit arrangement of nodes linked by networks having different topologies. The vehicle of infection (Vibrio cholerae) is transported through the network links that are thought of as hydrological connections among susceptible communities. The mathematical tools used are borrowed from general schemes of reactive transport on river networks acting as the environmental matrix for the circulation and mixing of waterborne pathogens. Using the diffusion approximation, we analytically derive the speed of propagation for travelling fronts of epidemics on regular lattices (either one-dimensional or two-dimensional) endowed with uniform population density. Power laws are found that relate the propagation speed to the diffusion coefficient and the basic reproduction number. We numerically obtain the related, slower speed of epidemic spreading for more complex, yet realistic river structures such as Peano networks and optimal channel networks. The analysis of the limit case of uniformly distributed population sizes proves instrumental in establishing the overall conditions for the relevance of spatially explicit models. To that extent, the ratio between spreading and disease outbreak time scales proves the crucial parameter. The relevance of our results lies in the major differences potentially arising between the predictions of spatially explicit models and traditional compartmental models of the susceptible–infected–recovered (SIR)-like type. Our results suggest that in many cases of real-life epidemiological interest, time scales of disease dynamics may trigger outbreaks that significantly depart from the predictions of compartmental models.
Keywords: SIR-like models, optimal channel network and Peano network, travelling waves, scaling laws, reproduction number
1. Introduction
Cholera epidemics are still a major public health concern in many areas of the world, especially in Africa (Bhattacharya et al. 2009), as recently documented with reference to the current Zimbabwe public health crisis (Koenig 2009). Improvements in planning and epidemiological decision-making have been argued to need parallel, reliable forecasting of the impact of the ecosystem state on the spreading of disease (Clark et al. 2001). In fact, several issues of great societal and scientific relevance concerning cholera epidemics remain unexplained. Among these, the spatial variability of incidence/prevalence and the role of environmental drivers in determining the seasonal patterns of the disease are generally deemed the most critical (Colwell 1996; Pascual et al. 2000, 2002; Faruque et al. 2005; Ruiz-Moreno et al. 2007; Codeço et al. 2008).
Cholera is an intestinal disease caused by the bacterium Vibrio cholerae, which colonizes the human intestine. The transmission of the disease is mediated by water. In fact, V. cholerae is a natural member of the coastal aquatic microbial community and can survive outside the human host in the aquatic environment in association with chitinaceous zooplankton such as copepods, shellfish and also with the aquatic vegetation (Colwell 1996; Lipp et al. 2002; Islam et al. 2004). Therefore, V. cholerae (and thus the disease) can spread from the coastal region, where it is autochthonous, to the inland area through waterways and river networks. In the same manner, the infection can spread from inland regions with epidemic outbursts into the surrounding areas. Two routes of transmission for cholera are identified in the literature (Miller et al. 1985). The so-called primary transmission occurs from a natural reservoir of pathogens in the aquatic environment to the human hosts. The secondary transmission route is mediated by the ingestion of faecally contaminated water or food (Miller et al. 1985). Therefore, the infection is always caused by ingestion of water either contaminated by V. cholerae present in a natural reservoir (primary route) or contaminated by humans (secondary infection), and thus the role of the aquatic environment is crucial for the transmission as well as for the spreading of the disease. In fact, spatial and temporal patterns of cholera epidemics are strongly related to the ecology of the bacterium in the environment driven by hydrological and climatic variability. Time-series analysis of cholera cases in endemic regions such as Bangladesh shows a time variability with subannual, annual and interannual components. The low-frequency variability has been linked to long-term climatic oscillations (Pascual et al. 2000; Koelle et al. 2005; Cazelles et al. 2007), and the overall seasonality has been found to experience competing effects with two routes of transmissions: one enhanced by increasing rainfall and the other buffered by increasing water pools (Ruiz-Moreno et al. 2007).
Besides seasonality and the complex dynamics that link rainfall and cholera, an important determinant of the disease spatio-temporal variability is the environmental matrix in which the disease spreads into disease-free regions. The matrix is constituted by different human communities and their hydrological interconnections. Each community is characterized by its spatial position, population size, water resource availability and hygiene conditions. Three main characteristics of the environmental matrix can significantly affect the epidemic dynamics: (i) the topological and geometrical features of the pathogen pathways that connect different communities; (ii) the spatial distribution of the population; and (iii) the nature and distribution of water resources and public health conditions, and how they vary with population size. These factors proved crucial in reproducing the space–time evolution of a cholera epidemic that occurred in KwaZulu-Natal, South Africa, in 2001–2002 (Bertuzzo et al. 2008). In the present paper, we extensively study the role of the first characteristic and we begin tackling the other two. The analysis is aimed at establishing the conditions for the environmental matrix to play a significant role in the disease dynamics or, on the contrary, for the simpler spatially implicit models to provide a good description of cholera epidemics.
Models of cholera dynamics are relatively recent, but constitute a rather elaborate field of research (e.g. Capasso & Paveri Fontana 1979; Koelle et al. 2005; Codeço et al. 2008; Pascual et al. 2008). The free-living bacteria in the aquatic reservoir have long been recognized to determine the endemic–epidemic dynamics of cholera (Codeço 2001; Pascual et al. 2002). Recent laboratory findings suggest that passage of the bacterium through the gastrointestinal tract results in a hyperinfectious state that will shortly reside in the water medium before decaying to a less infectious state. Hartley et al. (2006) incorporate the hyperinfectious state into their model to achieve a better explanation of explosive cholera outbreaks. All the above-mentioned models, however, do not consider space explicitly. They assume a unique community of interacting susceptibles who share a unique water resource. The analysis proposed in this paper is instead based on spatially explicit models that explicitly account for the environmental matrix along which the disease can spread. These models were used in Bertuzzo et al. (2008) to simulate the specific case of the KwaZulu-Natal 2001–2002 epidemic via a suitable tuning of their parameters. They are now considered in greater generality to analyse the effects of different hydrological networks and disease dynamics on the epidemic evolution.
Although the influence of networks on disease spreading has long been studied (see Riley 2007), the transport of pathogens through waterway networks has not been given the attention it deserves. Not only cholera but also other diseases such as shigellosis, rotavirus infections and typhoid are mostly spread through contaminated water. The total annual death toll of waterborne diseases is estimated to be 2.8 million people, while diarrhoeal illnesses account for approximately 20 per cent of mortality in children under the age of 5 (Bryce et al. 2005). Most of the epidemiological literature has focused on contact networks that are crucial for understanding the evolution of diseases that are directly transmitted from individual to individual or from social group to social group (Diekmann et al. 1990; Keeling 1999; Barthelemy et al. 2005; Keeling & Eames 2005; Aparicio & Pascual 2007; Colizza & Vespignani 2007). Also, a good deal of work has been done with metapopulation-like models in which the disease is transmitted from patch to patch (Bolker & Grenfell 1996; Brooks et al. 2008). Spatial models can be mapped into suitably defined contact network models (e.g. Parham & Ferguson 2006). When the transmission is mediated by water, as in the case of cholera, direct contacts between individuals are less important for the disease transmission, whereas a crucial role is played by spatial connectivity. On the other hand, hydrological networks have special features, such as the directional flow of water, which are usually not included in the metapopulation paradigm. In the framework proposed here, the environmental matrix is modelled as an oriented graph in which nodes represent water reservoirs containing bacteria and edges represent hydrological links, through which bacteria, and therefore the disease, can spread. Human communities are located at the nodes, become infected from the reservoirs and infect the water with a greatly multiplied load of bacteria.
If we consider a cholera epidemic that starts from a point and spreads through a finite system, two different time scales may be identified: (i) the spreading time scale, that is, the time needed for the disease to spread and involve all the communities in the system and (ii) the epidemic time scale, defined by the duration of the epidemic in a single community. While the latter mainly depends on biological factors, the former is controlled also by the geometry of the environmental matrix and by transport phenomena. If the epidemic time scales are comparable to or larger than the pathogens' spreading time scales, one expects that spatial variability does not play a major role and the system may be approximated by a well-mixed reactor. When the spreading time scales are larger than the local epidemic time scales, however, the overall epidemic patterns are controlled by the spatial spreading and one expects significant differences between spatially implicit and explicit models. We therefore investigate how the ratio between spreading and epidemic time scales varies under different scenarios of cholera dynamics, vibrio transport and environmental matrix arrangements. In particular, because the spreading time scale can be expressed as the ratio between the system size and a characteristic disease propagation speed, different topologies are considered as substrates for pathogen transport to derive the spreading velocity.
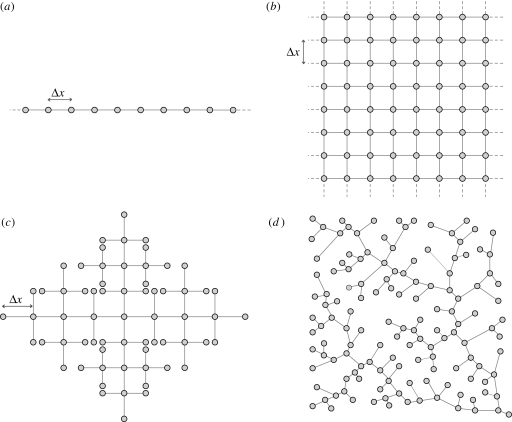
Figure 1 sketches the four topologies considered herein: one-dimensional and two-dimensional regular lattices, Peano and optimal channel networks (OCNs) (Rodriguez-Iturbe & Rinaldo 1997). Regular lattices allow us to analytically derive the spreading velocity in the diffusion limit. They prove instrumental to our understanding of the basic scaling properties of the epidemic evolution. The analysis on regular lattices is crucial to highlight similarities to, and departures from, epidemic spreading on heterogeneous, yet realistic network topologies (namely Peano and OCNs). Although Peano networks are deterministic fractals, their topological features resemble closely those of real river networks, and they have often been used in analytical studies to mimic real river networks (e.g. Campos & Mendez 2005; Campos et al. 2006; De Bartolo et al. 2009). OCNs, instead, are artificial networks obtained through a specific selection process from which one obtains a rich structure of optimal scaling forms that are known to closely conform to the scaling of real networks (Rinaldo et al. 1992; Rodriguez-Iturbe et al. 1992). In this particular study, a Peano network is useful to quantify the competitive effect owing to network topology and degree of the nodes. Inner Peano nodes have, in fact, four neighbours, while real river networks and OCNs have no more than three.
Figure 1.
Topologies on which spreading of cholera epidemics is considered herein: (a) one-dimensional lattice; (b) two-dimensional lattice; (c) Peano's network; and (d) OCN.
The paper is organized as follows. Section 2 summarizes the main features of the theoretical approach and describes the model. Section 3 is devoted to the analytical or numerical derivation of the spreading velocity in the four different topologies described earlier. Arising departures between spatially implicit and explicit models and the epidemiological potential of the tools developed are discussed in §4. Conclusions are drawn in §5.
2. Theoretical approach
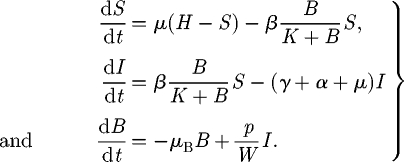
The basic theoretical scheme of the spatially explicit model relates to recent advances in hydrochory, migration fronts and infection spreading (Campos et al. 2006; Bertuzzo et al. 2007; Muneepeerakul et al. 2008). Nodal reactions describe the dynamics of cholera, described via a compartmental susceptible–infective–recovered (SIR)-like model (Bertuzzo et al. 2008). Transport through network links provides the coupling of the nodal disease dynamics. Spreading of epidemics in networks is addressed by viewing the environmental matrix as an oriented graph (i.e. a directed graph having no symmetric pair of directed edges). Nodes represent water reservoirs and human communities (cities, towns and villages) in which the disease can diffuse and grow. The edges represent links between the communities, typically hydrological links. Edge direction is chosen according to the flow direction. The model is assembled by coupling two models: (i) a local epidemic model at nodes of the graph and (ii) a transport model for the spreading of the disease vector through the edges of the network. As for the local dynamics, we use a continuous SIR-like model with a reservoir of free-living infective agents. It is obtained by a slight modification of the susceptible–infective–bacteria (SIB) cholera epidemic model introduced by Codeço (2001). The local epidemic model has three state variables, namely the abundance of susceptibles (S) and infected individuals (I) in a human community of size H, and the concentration of V. cholerae (B) in the aquatic environment. The temporal evolution of state variables can be described by the following system of nonlinear differential equations:
 |
2.1 |
The first equation describes the dynamics of susceptibles in a community of size H. The natality and mortality rates of susceptible individuals are identical and labelled as μ. Newborn individuals are considered susceptible. Susceptible people become infected at a rate μB/(K + B), where μ is the transmission parameter accounting for contacts with contaminated water and B/(K + B) is the logistic dose–response curve (sensu Codeço 2001). Such a curve links the probability of becoming infected to the concentration of vibrios B in water and K is the semi-saturation concentration. Infected people (whose dynamics is described by the second equation) are removed at a rate which is the sum of natural mortality rate (μ), the disease-induced mortality rate (α) and the recovery rate (γ). The third equation describes the dynamics of the free-living infective agents in the aquatic reservoir. Infected people contribute to the concentration of vibrios at a rate p/W, where p is the rate at which bacteria produced by one infected person reach and contaminate a water reservoir of volume W. Free-living vibrios can reproduce in the water, but the rate of reproduction is smaller than the rate of mortality, so they basically die at rate μB.
The hidden equation for the recovered is (dR/dt) = γI − μR. People recovered from cholera are considered immune. The model does not take into account any loss of immunity (i.e. a flux from recovered to susceptibles) because immunity usually lasts for several years (Koelle et al. 2005), a period that is longer than the typical spreading time scale we consider herein. On the contrary, immunity loss could play an important role in the long-term dynamics of cholera in regions where the disease is endemic (Koelle et al. 2005). Note also that immunity loss could be straightforwardly taken into account in the framework proposed, for example, by adding an extra compartment for the cross-immune individuals, similar to what has been done by Casagrandi et al. (2006) for influenza A.
As long as we are not interested in the numerical value of the concentration B of V. cholerae, we can introduce the dimensionless concentration B* = B/K, thus obtaining a simplified system in which one of the parameters is the ratio p/KW. This parameter summarizes social and environmental factors such as hygiene and health conditions, eating habits and lifestyle.
A linear stability analysis of the SIB model (Codeço 2001) shows that, given an initial condition of the type S(0) = H; I(0) > 0; B*(0) = 0, an epidemic outbreak occurs only if
 |
2.2 |
This requires that the population size is greater than a certain critical threshold SC, namely:
 |
2.3 |
otherwise the cholera infection fades to zero. The basic reproductive number R0 for the model described earlier can thus be expressed as the ratio between the population size H and the critical threshold (2.3). It is important to point out the notable epidemiological role of the dilution effect: the larger the volume of the water body, the higher the critical threshold.
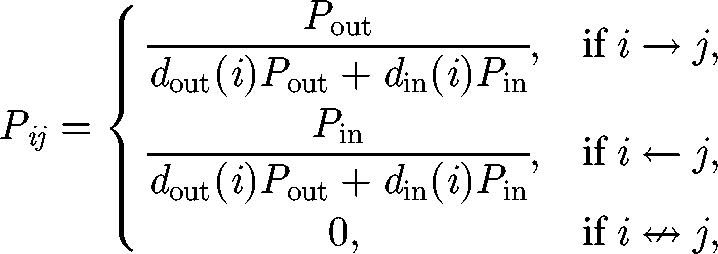
The spreading of V. cholerae can be modelled through a biased random-walk process on oriented graphs (Johnson et al. 1995) (i.e. graphs where edges have a direction). We thus present the transport model for the general case and we then particularize and apply it to the different topologies presented in figure 1. An infectious propagule can move with a certain probability from a node to one of the adjacent nodes, which are all the nodes that are connected to it through an inward or outward edge. Consider first a particular case of the network in which every node has only one inward edge and one outward edge (i.e. a one-dimensional lattice). We define as Pout (Pin) the probability that a propagule leaving a node moves to another node along an outward (inward) edge. We then have Pout + Pin = 1. On a generic oriented graph, every node can hold an arbitrary number of inward and outward edges. We assume that a propagule can move following an outward or inward edge with a probability proportional to Pout and Pin, respectively. The probability Pij for a propagule to be transported from node i to node j can thus be expressed as follows:
 |
2.4 |
where dout (i) and din (i) are, respectively, the outdegree and indegree of node i (i.e. the number of outward, respectively, inward, edges of node i). Since Pout + Pin = 1, one has ∑j=1N Pij = 1, where N is the total number of nodes. We term b = Pout − Pin = 2Pout − 1 the bias of the transport to follow the edge direction. The cholera dynamics in the ith node of the network (i = 1, … , N) can be described via the third-order epidemic model introduced earlier (Si, Ii and Bi*), so that the resulting basin-scale model must be studied in a 3N-dimensional phase space. We assume that vibrios are removed at every node with a certain rate l (d−1) and transported through the network following the transition probabilities (2.4). Then, replacing probabilities with frequencies, we obtain equations that describe the coupled process:
 |
2.5 |
 |
2.6 |
 |
2.7 |
for i = 1,2, … , N. The transport parameter l can be thought of as the inverse of the pathogens' residence time at each node. It thus defines the time scale of vibrio transport along the network. We assume that all the parameters in equations (2.5)–(2.7) are node independent, except for the population size Hi and the water volume Wi. The latter parameter represents the whole set of water supplies available to that community. The network acts as a matrix through which different sets of water supplies of different communities can be connected and contaminated. In the following, the epidemiological and demographic parameter values employed are those that best fit the real epidemics analysed in Bertuzzo et al. (2008): μ = 1 d−1, μB = 0.228 d−1, α + γ = 0.2 d−1 and μ = 4.2 · 10−5 d−1. Instead we let vary the transport parameter l, the bias b, the community size H and the value of the ratio p/KW. Epidemiologically, such parametric variations will set the basic reproductive number R0 to different values and will let us investigate the influence of the hydrological, social and environmental factors on cholera spread along river networks.
If we neglect the reaction between infected and vibrios (p = 0), equation (2.7) describes the spatio-temporal spreading of the vibrios concentration owing to the transport mechanisms and the death rate. This evolution is the result of a complex set of processes including the transport driven by the water flow, the interaction and exchange processes between vibrios in water and vibrios associated with invertebrates and algae in the plankton (Colwell 1996), the spreading of these organisms and all other possible transport phenomena. For instance, another mechanism that can enhance the spreading of the cholera bacteria is the irrigation with contaminated water that can, in turn, transmit the disease through contaminated food. Therefore, the short-range distribution of water and contaminated food may contribute to the overall transport of vibrios. We assume that all these processes result in a diffusion process (equation (2.7)) and a possible downstream drift depending on the relative importance of the above-mentioned mechanisms. We note, in fact, that when vibrios in the water interact with other organisms or substrates, their effective downstream advection can be significantly slower than the one imposed by the river flow velocity, in analogy to stream transport of solutes (Triska et al. 1993; Worman et al. 2002). In a previous application, the effective vibrios' drift was estimated at approximately 3 km d−1 (Bertuzzo et al. 2008). Therefore, the transport parameters l and b should not be thought of as physical parameters that reflect only the hydrological transport, but rather they are conceptual parameters aimed at modelling all physical, chemical and biological processes involved in the vibrios spreading.
The framework proposed directly accounts for both the primary and the secondary cholera transmission routes. Infected individuals contaminate the local water reservoir through infected stools. The vibrios in the environment can infect susceptibles in the same community where they have been produced or be transported towards the surrounding communities and contaminate the water bodies thus infecting other susceptibles. Through the imposition of suitable boundary conditions, the model can also account for the primary transmission route that occurs from a natural reservoir of free-living bacteria in the coastal aquatic environment to the human hosts. This can be done by imposing an input flux of vibrios into the coastal communities. The bacteria introduced can then be transported towards inland communities, and the spreading of the contamination can be enhanced, if an epidemic outbreak occurs, by the secondary transmission route that produces new bacteria.
3. Travelling cholera waves: the front speed in different topologies
Consider the model described in the previous section, applied to each of the topologies presented in figure 1, with a compact initial condition, that is, with water initially contaminated in a few adjacent nodes. The resulting disease evolves like a travelling wave that spreads through the system. Under the rather strong assumption that the population size and the other system parameters are uniformly distributed in space, the epidemic can be shown to travel at constant front speed c. Even though the spatial uniform distribution hypothesis can seem simplistic, it defines limit features for more realistic scenarios which shall be further investigated as the assumption of uniform distribution of the population is relaxed later in the paper.
3.1. Theoretical one- and two-dimensional lattices
It is possible to analytically derive the spreading velocity in the one-dimensional lattice by approximating the discrete process with its continuous limit. Taking the edge length Δx → 0, the transport rate l → ∞, while keeping constant the products l · Δx2 and b · l · Δx, the random-walk process becomes a diffusion process. Equation (2.7) can be therefore written as the following PDE:
 |
3.1 |
For sufficiently high l values (see discussion later), the discrete process can be well approximated by the continuous equation (3.1) with a diffusion coefficient D = l Δx2/2 and advective velocity v = bl Δx.
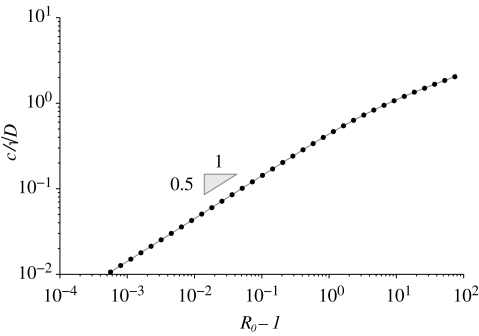
As detailed in appendix A, standard mathematical approaches make it possible to search for the velocity c of the travelling wave in the PDE model (2.5), (2.6)–(3.1) by looking for a specific parametric value in a suitable fourth-order system of ODEs. Quite expectedly, in the absence of transport biases (i.e. with b = 0), our analysis reveals that the disease propagates along one-dimensional lattices with a velocity that is proportional to the square root of the diffusion coefficient (see equation (A 12)). An important outcome of the model concerns the scaling of c/√D with respect to the epidemiological quantity that best characterizes diseases at the local scale, i.e. their reproductive number R0. Figure 2 points out that c/√D scales fairly well with R0 − 1. More precisely, the relationship is a power law and, at least for reproductive numbers lower than 4, the slope is 1/2. This result is important because, as emphasized by Hartley et al. (2006), measuring R0 is quite demanding. We thus suggest a possible indirect estimation of R0 and D from the observation of how fast a cholera infection propagates.
Figure 2.
Scaling of the quantity c/√D with R0 − 1 in a one-dimensional lattice (see text for details).
The introduction of a few infected people in a node of a two-dimensional lattice triggers, if R0 is greater than unity, an epidemic that spreads as an axial-symmetric waveform. Analogously to the previous case, we derive the continuous limit of the equation (2.7) in the two-dimensional case:
 |
3.2 |
where we express the Laplacian operator in polar coordinates. The diffusion coefficient is given in this case by D = l Δx2/4. As the expected front is axial-symmetric, equation (3.2) depends only on the distance r from the initial point and not on the direction. For large values of r, the term ∂B(r,t)/r ∂r vanishes and equation (3.2) becomes formally equal to equation (3.1) that describes the one-dimensional case. Therefore, the spreading velocity can be derived through exactly the same procedure. However, it should be noted that, if we compare the two topologies by keeping constant the transport rate l and the edge length Δx, the two-dimensional front is slower by a factor √2 with respect to the one-dimensional case. In fact, the diffusion coefficient D has different expressions for the two cases. This is somewhat intuitive because the pathogens in a node can spread towards four neighbouring nodes in the two-dimensional lattice, whereas the neighbours are only two in the one-dimensional case.
3.2. Peano and optimal channel networks
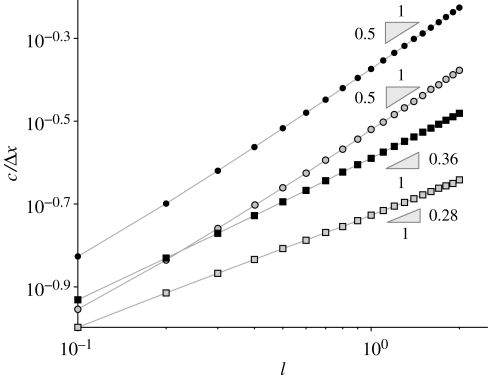
The spreading velocity in heterogeneous river network topologies, such as Peano (figure 1c) or OCN (figure 1d), is computed numerically from the discrete model (equations (2.5)–(2.7)). We start the simulation with a single infected individual in one node (typically the outlet of the network) and observe the front along a single path, typically the path that connects the outlet to the farthest leaf. When the epidemic front reaches a stable form, we start measuring its speed. A more detailed description of a cholera wave propagating through an OCN is reported in §2 of the electronic supplementary material. We compare the results for different topologies using the spatial scale of the discrete model, i.e. keeping the edge length Δx constant while varying the transport rate l. Moreover, the distance Δx models the actual distance between human communities, and this analysis is aimed at understanding how fast the disease can spread as a function of the rate at which pathogens are redistributed between communities. Figure 3 shows the results for b = 0 and R0 = 3, but different R0 values lead to qualitatively similar results. It is worth pointing out that parameter l has the physical meaning of the inverse of the retention time of the vibrios in a single node, whereas c/Δx is the spreading velocity normalized by the distance between nodes. For sufficiently large values of l, we find the results predicted earlier for the one- and two-dimensional lattices by the analytical solution. Too low values of l obviously violate the condition for the continuous approximation (l → ∞), and therefore the actual velocity slightly departs from the √l scaling (see the bottom-left corner of figure 3). Apart from numerical details, our results show that the disease propagation in the two river network topologies is remarkably slower than in the one- and two-dimensional lattices and exhibits a different scaling. This is analogous to the features of travelling waves for other reaction–diffusion processes in networked substrates (Campos et al. 2006; Bertuzzo et al. 2007).
Figure 3.
Normalized front speed c/Δx as a function of the transport rate l for the four different topologies considered. Filled circle, one-dimensional; open circle, two-dimensional; filled square, OCN; open square, Peano. All the lines refer to a basic reproductive rate R0 = 3.
As expected, the OCN's spreading velocity is greater than Peano's. In fact, while the pathogens resident within an inner Peano node are dispersed towards four adjacent nodes, the neighbours in OCN structures cannot exceed 3 and disease spread is enhanced. It is also instructive to compare the front speed computed in the two-dimensional lattice and in the Peano network, as the nodes of both structures have the same degree (i.e. four adjacent nodes). Evidently, the fragmentation of the connections in the latter network topology leads to a much slower propagation. Even more interesting is to compare OCN with two-dimensional lattices. Although nodes in OCN have a degree that cannot exceed 3, while the nodes' degree in two-dimensional lattices is strictly 4, the front is slower in OCNs owing to their particular tree-like topology. We therefore conclude that the degree distribution of the river network cannot alone explain the hierarchies of the disease spread.
3.3. Biased fronts
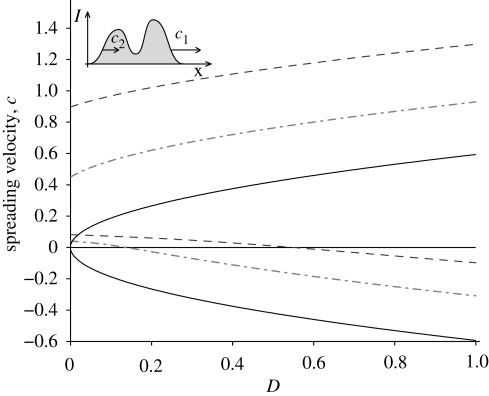
In a space-unbounded one-dimensional lattice, an epidemic that starts from a compact support initial condition (e.g. with a few infected in one of the midstream nodes) spreads through the domain with two fronts that travel at velocities c1 and c2, respectively (see inset in figure 4). For unbiased processes (b = 0 thus v = 0), the two fronts travel along opposite directions with the same speed. The presence of a drift for the vibrio's transport (v > 0) breaks this symmetry. Figure 4 shows how the drift affects the speed of the two fronts. For each value of the drift velocity v, the disease-spreading speed is a function of the diffusion coefficient D represented by two branches; the upper and lower branches refer to velocities c1 and c2, respectively. As expected, a positive drift increases the signed values of both velocities. For large D values, the front speed still scales with √D, whereas for small values, the scaling is broken. It is noticeable that the front speeds do not tend to the drift velocity v for D → 0. This is owing to the fact that while the spatio-temporal dynamics of vibrios B is subject to advection and diffusion, changes of susceptible and infected abundances are not. In a model with pure advection (D = 0 and v > 0), this implies that the progressive wave propagates with a speed c1 lower than the drift velocity and the retrogressive front has a small positive speed c2. Qualitatively similar results (not shown for brevity) are obtained with the OCN and the Peano network via numerical simulations.
Figure 4.
Effect of the drift v on the spreading velocity in a one-dimensional lattice. For each value of v, the spreading velocity is a function of the diffusion coefficient D represented by two branches. The upper and lower branches refer to the velocity of the two originating fronts c1 and c2, respectively (see upper left inset and text for details). Values are obtained through the solution of equation (A 11) with R0 = 3. Solid line, v = 0; dashed-dotted line, v = 0.5; dashed line, v = 1.
Of special interest is the retrogressive front. If c2 is negative, it indicates how fast upstream communities are reached by an infection started downstream. For increasing values of the diffusion coefficient D, there exists a threshold value D* at which c2 = 0 and, for D > D*, the epidemic can spread inland against the river flow. Figure 4 shows that for an effective vibrios drift of 1 km d−1 (see discussion in §2), the corresponding D* is approximately equal to 0.55 km2 d−1. Recalling that in a diffusion process the average distance travelled by a particle at time t scales as √Dt, we can state that, in order to have cholera-spreading inland, vibrios should be transported at approximately 0.74 km in 1 day. With the stronger drift of 3 km d−1 (as in Bertuzzo et al. 2008), this distance is 2.2 km d−1. These are plausible values given the transport processes involved.
4. Spatio-temporal cholera dynamics
After having studied the effects of topology and of epidemiological and transport parameters on wavefronts, we now investigate the spatio-temporal dynamics of cholera in greater generality. These analyses are aimed at establishing the effects of spatial variability of the disease on the resulting temporal patterns and the conditions for the relevance of spatially explicit models.
The first set of simulations deals with a Peano network whose 1025 nodes are populated by a uniform number of individuals. Reflecting boundary conditions of the so-called blind ant type (Hughes 1995) are assumed for all the leaf nodes and for the outlet. This kind of condition prescribes that walkers are not aware of being at a boundary node. Thus, if they try to go beyond it, they are reflected and stay still in the same node. These boundary conditions ensure that the steady state solution of our random walk is a non-null uniform distribution and that vibrios are removed from the system only by death, without considering sources or sinks of pathogens. The latter conditions can straightforwardly be modified to mimic more realistic scenarios, but they are necessary to compare in a proper way spatially explicit and implicit models. The initial condition is one infected individual at the outlet of the basin. This case is obviously deemed representative of the inland propagation of the infection from coastal regions where pathogens are autochthonous.
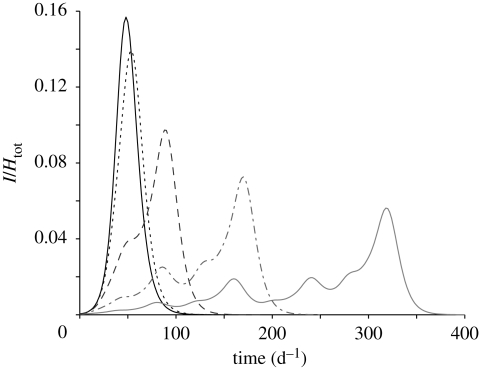
Figure 5 shows the temporal evolution of the basin-scale prevalence (i.e. the total abundance of infected normalized by the total population for the whole basin). Different lines correspond to different values of the transport rate l. All the simulations are performed with no drift (b = 0). The l = ∞ case corresponds to the spatially implicit SIB model; results are obtained by simulating equations (2.1) with a population size equal to the total population of the basin and a water volume equal to the sum of the water volumes of all nodes. As expected, the higher the transport rate, the better the system is approximated by a well-mixed model (i.e. by a spatially implicit scheme). Nevertheless, at lower values of the transport rate, the spatial variability is reflected in epidemic evolutions that significantly depart from those of the well-mixed case. The secondary peaks of infected individuals that emerge at low transport rates depend on the number of susceptibles that are reached by the epidemic wave per unit time. The latter depends, in turn, on the number of nodes that are located at the same distance from the outlet (and thus reached simultaneously by the epidemic wave). The relative proportion of the number of nodes placed at a certain distance from the outlet (distance being computed along the network) is called the geomorphologic width function (Rodriguez-Iturbe & Rinaldo 1997) and is characteristic of the type of network considered. In particular, Peano width function is multimodal and this is reflected in the secondary peaks of prevalence curves (figure 5).
Figure 5.
Temporal evolution of the total number of infected normalized by the total population in a Peano basin with 1025 nodes (Lmax = 32) populated by a uniform number of susceptible individuals. Different lines correspond to different values of the transport rate l as reported in the legend. The l = ∞ (thick solid line) case corresponds to the spatially implicit model (equation (2.1)). Solid line, l = ∞; dotted line, l = 100 d−1; dashed line, l = 10 d−1; dashed-dotted line, l = 1 d−1; thin solid line, l = 0.1 d−1. All the simulations are performed with R0 = 3.
As discussed in §1, the relevance of considering spatially explicit models is controlled by the ratio between spreading and epidemic time scales. The time required for the disease to spread throughout the system is controlled by the spreading velocity c and can be expressed as TS = L/c, where L is a characteristic length of the system (e.g. the maximum of the distances between the initial node and each of the others). The epidemic time scale can be defined as the average duration of the epidemics in different communities. A measure of such a duration can be obtained from the prevalence time series at a specific location, for example, as the time elapsed between the 2.5th and the 97.5th percentile. Since the prevalence curves in the various nodes are approximately normal with the same variance (see figure S2 in the electronic supplementary material and discussion therein), we can adopt the 2.5–97.5 interpercentile range as a measure of the epidemic time scale, approximately equal to TE = 4σE, where σE is the standard deviation of the prevalence curve, i.e.
 |
4.1 |
where t̄i = ∫0∞tIi(t) dt/∫0∞Ii(t) dt is the average time of infection in the ith node.
To measure the departures of the spatially explicit model from its well-mixed, spatially implicit counterpart, we define the similarity index SI as
 |
4.2 |
where I(t) is the total abundance of infected according to the network model, and I0(t) is the total abundance of infected as predicted by the spatially implicit SIB model. The index SI assumes value 1 if the models predict the same response and decreases as the departures between the outcomes of the two models increase.
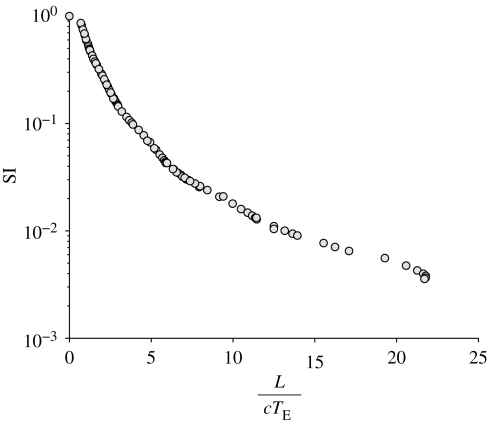
Figure 6 shows the dependence of the similarity index SI on the time-scale ratio. Different points correspond to different simulations obtained by varying the size of the system L, the basic reproductive number of the epidemics R0 and the transport rate l. The results show how the differences between spatially explicit and implicit models are indeed controlled by the time-scale ratio. We note, moreover, that the range of reliability of spatially implicit models is rather narrow. To provide a reference scale, note that the curves in figure 5 have an SI of 0.96, 0.44, 0.14 and 0.04 for a transport rate l equal to 100, 10, 1 and 0.1, respectively.
Figure 6.
Similarity index SI, see equation (4.2), versus time-scale ratio L/cTE. Different points correspond to different simulations obtained by varying the size of the system L of the Peano basin, the basic reproductive number of the epidemic R0 and the transport rate l.
Up to now, we have assumed a homogeneous network (same community size H and water volume W in each node). To achieve greater realism, we can analyse the effects of heterogeneity on the disease dynamics. When dealing with heterogeneous distributions of population size, one needs to consider also how the water resources availability and hygiene conditions vary in space. One of the simplest hypotheses is to assume a model that relates the water resource availability of a community to its population size. For instance, a linear relationship between these two quantities (i.e. Wi ∝ Hi) corresponds to the case in which communities manage to increase their own set of water supplies so that the per capita available water is kept constant. This assumption seems reasonable for many developed regions. In this particular case, the basic reproductive number R0 is constant for all the communities (see equation (2.2)), and the epidemic prevalence (i.e. the number of infected individuals normalized by the population size of each node) still evolves like a waveform that spreads through the system. The prediction of the front speed obtained in the uniform case (§3) proves robust even in this particular case (see electronic supplementary material), thus emphasizing the relevance of the study of the uniform case. However, a plausible hypothesis is that in many developing regions, where cholera is still a major threat, the per capita water availability decreases with the population density (e.g. Wi ∝ Hia, a < 1). In this case, the basic reproductive number increases with the population size (R0 ∝ Hi(1−a)), thus implying that the larger the community, the more severe and rapid the local epidemic. In this case, the spreading velocity is not constant but accelerates or decelerates depending on the size of the communities involved. In the electronic supplementary material, we show that the mean spreading velocity averaged over the network is slightly larger than the front speed predicted in a uniformly distributed system.
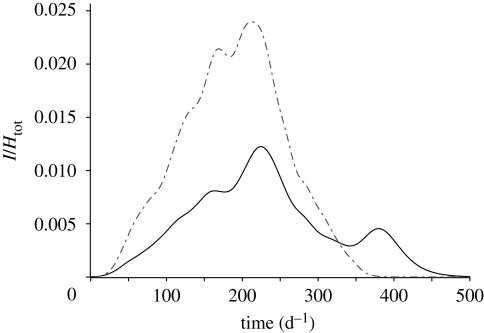
Although the uniformly distributed case provides robust predictions of the spreading velocity, we note that the spatial heterogeneity of susceptibles could significantly affect the resulting epidemic patterns. An example of these effects is presented in figure 7, in which the temporal evolutions of an epidemic that spreads through an OCN with either uniform or heterogeneous population distributions are compared. In the heterogeneous network, the population sizes of each node Hi are sampled from Zipf's probability distribution: p(H) ∝ H−2, which appears to hold in virtually all countries for which data exist (Zipf 1949). The heterogeneous case presents a secondary peak that has nothing to do with the disease dynamics, but depends only on the delay with which the disease reaches large communities. Note that we report only one particular realization of the process (one set of population sizes extracted from Zipf's distribution), whereas different realizations can lead to very different results. Hence, the spatial arrangement of susceptible sites intertwined with the travel time for the disease to reach them may often play an important role in the time evolution of epidemic outbreaks. The analysis of the impact of the heterogeneous distribution of the population size, along with the seasonal and spatial distribution of water resources and epidemiological and demographic parameters, represents, in our view, the next important step towards a better understanding of cholera epidemic patterns.
Figure 7.
Effects of population heterogeneity on the dynamics of an epidemic that spreads on an OCN construct. The two lines refer to the temporal evolution of the total number of infected normalized by the total population with uniform (dot-dashed line) and Zipf (solid line) population distribution. The total population and all the other parameters are the same in the two cases. The dynamical parameters employed are l = 1 d−1 and R0 = 3.
It would be interesting for future research to develop a spatially implicit scheme that indirectly accounts for the effect of the spatial spreading, in analogy to Aparicio & Pascual (2007) building a modified mean field model that implicity accounts for the influence of the network contact structure on the disease spread. A possible way to include the effect of the propagation of the infection into disease-free regions is to split the susceptibles compartment into two classes: (i) the number of susceptibles that have not been reached yet by the contamination and (ii) the number of susceptibles that are exposed to the environmental contamination and that can potentially become infected. The flux of individuals from the first to the second pool would mimic the rate at which spatially distributed susceptibles are reached by the epidemic wave. This rate is not constant, but it varies depending on the spreading velocity, the spatial distribution of population, hygiene conditions and water resources and network topology.
Finally, we deem spatial explicit models particularly relevant to study epidemics in regions where cholera usually starts along the coast and spreads inland. These communities are usually less prepared to face an epidemic than regions where cholera is endemic, and the time scale of emergency and control measures is comparable to that of the epidemic evolution. In endemic regions, instead, other factors such as climatic oscillations (Pascual et al. 2000) or immunity loss (Koelle et al. 2005) play a major role in controlling the long-term behaviour of the seasonal cholera outbreaks. Thus prevention and control measures therein operate on long-term perspectives.
5. Conclusions
The following conclusions are worth mentioning.
We have investigated how the front speed c of cholera propagation along rivers can be influenced by the network topology, the transport parameters and the epidemiological characteristics of the disease. To this aim, we have generalized a spatially explicit model of cholera first proposed by Bertuzzo et al. (2008) for discussing the outbreaks that occurred in the KwaZulu-Natal province, South Africa, from 2000 to 2002. To keep our analysis as general as possible and to provide a theoretical understanding of the reaction–advection–diffusion process, we have used here four different topologies, namely, one- and two-dimensional regular lattices, Peano networks and OCNs. For the regular lattices, we have analytically derived the wavefront speed as a function of the epidemiological parameters, in particular the disease diffusion coefficient D and the basic reproductive number R0. Interestingly, we found that, in a one-dimensional lattice, c/√D scales fairly well with √(R0 − 1). Also, the disease spreading in realistic networks, such as a Peano network and an OCN, proves much slower than in one- and two-dimensional lattices. The front speeds in these topologies scale with D according to irrational exponents (smaller than 1/2) that perhaps deserve further investigation.
The analysis of the front speed has been performed in the cases of both unbiased (i.e. drift velocity v = 0 and D > 0) and biased (v > 0 and D > 0) vibrios transport. We have found that, in the biased case, an occasional infection occurring in a node produces two waves of infected individuals that propagate with two different velocities at the progressive and the regressive fronts. For sufficiently large values of vibrios diffusion D, the regressive front speed can be negative; therefore, cholera can spread inland from the river outlet. Analysing the front speeds has been instrumental to determining the spreading time scales (defined as the time needed for the disease to spread from the initially infected node to all the communities along the river) for the four topologies considered herein.
Spreading time scales need to be compared with local epidemic outbreak time scales to establish conditions for the relevance of spatially explicit models. The higher the ratio between spreading and epidemic time scales, the larger the differences between the predictions of spatially implicit (SIB model) and spatially explicit schemes. Conditions for reliability of implicit models appear to be rather stringent, thus providing weight to generalized applications of the proposed scheme. Moreover, the slower the front speed, the higher the ratio between spreading and epidemic time scales, thus implying that spatially explicit schemes rapidly become crucial in the case of river networks.
We have finally shown the potential of our approach for tackling the problem of spatially heterogeneous networks. In real systems, in fact, communities placed along the river links of the networks obviously do not have the same size. Under somewhat conservative hypotheses on the distributions of water resources and hygiene conditions, we have shown that the spreading velocity of the infected wave in rivers with heterogeneous population sizes might be roughly approximated by front speeds obtained in the equivalent uniformly distributed case. However, our preliminary findings have demonstrated that some characteristics of the spatial patterns of the disease, such as secondary peaks, can be captured only by including the heterogeneities of the environmental matrix.
Acknowledgements
The authors wish to acknowledge the helpful comments and suggestions made by three anonymous referees. E.B. and A.R. gratefully acknowledge the support provided by the ERC advanced grant programme through the project RINEC-227612. I.R.-I. gratefully acknowledges the support of the James S. McDonnell Foundation through a grant for Studying Complex Systems (220020138). R.C. and M.G. acknowledge the support provided by the Italian Ministry of Research (Interlink project no. II04CE49G8). We thank Mercedes Pascual and Andy Dobson for the stimulating discussions with E.B. during his seminar at ICTP, Trieste.
Appendix A: Analytical results for the wave speed in the PDE model
As discussed in §3, the continuous limit of the system of equations (2.5)–(2.7) in one dimension is
 |
A 1 |
 |
A 2 |
 |
A 3 |
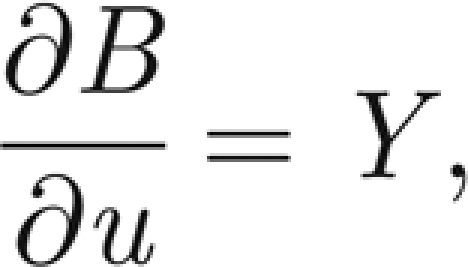
where S* = S/H and I* = I/H are the normalized susceptibles and infected, respectively. In the following, we will refer only to the normalized variables. Therefore, in order to simplify the notation, we remove star superscripts. First, we further simplify the notation by introducing the positive parameters η = γ+ α +μ and θ = pH/KW; second, we introduce the variable u = x − ct to find travelling wave solutions of model (A 1)–(A 3), with c being the speed of the travelling wave; third, we reduce the corresponding nonlinear model of ordinary differential equations in u to the following four-dimensional system:
 |
A 4 |
 |
A 5 |
 |
A 6 |
 |
A 7 |
Model (A 4>)–(A 7) has two equilibria corresponding to the spatially homogeneous stationary solutions of model (A 1)–(A 3). The equilibrium  (T indicates matrix transposition) corresponds to the absence of infection over all space, while
  stands for the endemic equilibrium. This latter solution is non-negative, thus acceptable, if and only if the parameter values satisfy the constraint μθ > ημB or equivalently R0 > 1 (see equation (2.2)).
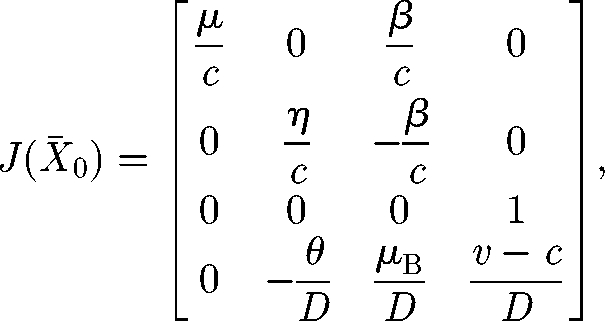
Any travelling wave solution of model (A 1)–(A 3) can be seen in model (A 4)–(A 7) as a heteroclinic orbit connecting X̄0 and X̄+. For a progressive wave, X̄0 is a saddle and the heteroclinic orbit goes from X̄+ to X̄0. For obvious reasons, it is not acceptable that such an orbit exits from the positive orthant of the three-dimensional subspace (I(u), B(u), Y(u)) centred at X̄0. This requires that the value of c is such that X̄0 is a saddle node, not a saddle focus. For a retrogressive wave, the heteroclinic orbit goes from X̄0 to X̄+ and X̄0 must be an unstable node. In other words, all the eigenvalues of the Jacobian J(X̄0) must be real for a wavefront to exist.
Let c1 be the value of c that determines the transition of X̄0 from a saddle-node to a saddle-focus equilibrium (progressive wave). It can be shown (Aronson & Weinberger 1978) that, among the infinite possible waves propagating at speeds c ≥ c1, the selected velocity for large t is exactly c1. Let c2 be the analogous value for the retrogressive front, then all the speeds c ≤ c2 are possible, but the stable front is that corresponding to c2.
The Jacobian matrix of model (A 4)–(A 7) at the generic equilibrium  reads as
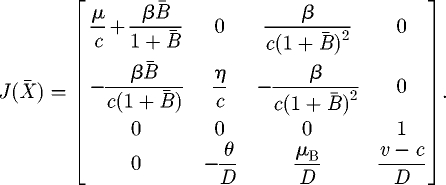 |
A 8 |
Thus in X̄0, we have
 |
A 9 |
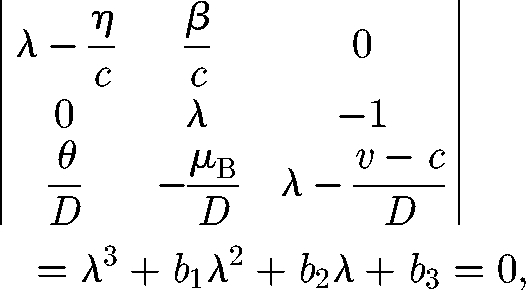
which is an upper triangular block matrix whose eigenvalues are λ1 = μ/c and the three solutions of the algebraic equation
 |
A 10 |
with b1 = −(ηD + c(v − c))/cD, b2 = −(η(v − c) − μBc)/cD and b3 = −(ημB (R0 − 1))/cD.
In order to determine the above-mentioned transitions from saddle focus to saddle node or from unstable focus to unstable node, we must find the relationship that must hold among the coefficients bi of the cubic equation (A 10) so that it has two real coinciding solutions. The condition is deducible from Abramowitz & Stegun (1965) as
| A 11 |
In the case of v = 0, one obtains an equation of the form
 |
A 12 |
whose coefficients depend, in an intricate way, on the model parameters η, μB and R0 − 1. However, γ0 and γ1 are negative, while γ3 is positive. Therefore, by Descartes' rule of signs, there exists only one positive solution of equation (A 12) that provides the wave speed. Also, equation (A 12) shows that c ∝ √D, as expected in a diffusion model. The intriguing relationship obtained while solving that equation is the scaling of c/√D with R0 − 1, as documented in figure 2.
If v > 0, the corresponding equation is more complicated, but it can be solved numerically and the results are shown in figure 4.
References
- Abramowitz M., Stegun I. 1965. Handbook of mathematical functions. New York, NY: Dover Publications. [Google Scholar]
- Aparicio J. P., Pascual M. 2007. Building epidemiological models from R0: an implicit treatment of transmission in networks. Proc. R. Soc. B. 274, 505–512. ( 10.1098/rspb.2006.0057) [DOI] [PMC free article] [PubMed] [Google Scholar]
- Aronson D., Weinberger H. 1978. Multidimensional nonlinear diffusion arising in population genetics. Adv. Math. 30, 33–76. [Google Scholar]
- Barthelemy M., Barrat A., Pastor-Satorras R., Vespignani A. 2005. Dynamical patterns of epidemic outbreaks in complex heterogeneous networks. J. Theor. Biol. 235, 275–288. ( 10.1016/j.jtbi.2005.01.011) [DOI] [PubMed] [Google Scholar]
- Bertuzzo E., Maritan A., Gatto M., Rodriguez-Iturbe I., Rinaldo A. 2007. River networks and ecological corridors: reactive transport on fractals, migration fronts, hydrochory. Water Resour. Res. 43, W04419 ( 10.1029/2006WR005533) [DOI] [Google Scholar]
- Bertuzzo E., Azaele S., Maritan A., Gatto M., Rodriguez-Iturbe I., Rinaldo A. 2008. On the space–time evolution of a cholera epidemic. Water Resour. Res. 44, W01424 ( 10.1029/2007WR006211) [DOI] [Google Scholar]
- Bhattacharya S., et al. 2009. The cholera crisis in Africa. Science 324, 885 ( 10.1126/science.1173890) [DOI] [PubMed] [Google Scholar]
- Bolker B. M., Grenfell B. T. 1996. Impact of vaccination on the spatial correlation and persistence of measles dynamics. Proc. Natl Acad. Sci. USA 93, 12 648–12 653. ( 10.1073/pnas.93.22.12648) [DOI] [PMC free article] [PubMed] [Google Scholar]
- Brooks C. P., Antonovics J., Keitt T. H. 2008. Spatial and temporal heterogeneity explain disease dynamics in a spatially explicit network model. Am. Nat. 172, 149–159. ( 10.1086/589451) [DOI] [PubMed] [Google Scholar]
- Bryce J., Boschi-Pinto C., Shibuya K., Black R. E. 2005. Who estimates of the causes of death in children. Lancet 365, 1147–1152. ( 10.1016/S0140-6736(05)71877-8) [DOI] [PubMed] [Google Scholar]
- Campos D., Mendez V. 2005. Reaction–diffusion wavefronts on comblike structures. Phys. Rev. E 71, 051104 ( 10.1103/PhysRevE.71.051104) [DOI] [PubMed] [Google Scholar]
- Campos D., Fort J., Mendez V. 2006. Transport on fractal river networks: application to migration fronts. Theor. Popul. Biol. 69, 88–93. ( 10.1016/j.tpb.2005.09.001) [DOI] [PubMed] [Google Scholar]
- Capasso V., Paveri Fontana S. 1979. Mathematical-model for the 1973 cholera epidemic in the European Mediterranean region. Rev Epidemiol Sante Publique 27, 121–132. [PubMed] [Google Scholar]
- Casagrandi R., Bolzoni L., Levin S. A., Andreasen V. 2006. The SIRC model and influenza A. Math. Biosci. 200, 152–169. ( 10.1016/j.mbs.2005.12.029) [DOI] [PubMed] [Google Scholar]
- Cazelles B., Chavez M., de Magny G. C., Guegan J.-F., Hales S. 2007. Time-dependent spectral analysis of epidemiological time-series with wavelets. J. R. Soc. Interface 4, 625–636. ( 10.1098/rsif.2007.0212) [DOI] [PMC free article] [PubMed] [Google Scholar]
- Clark J., et al. 2001. Ecological forecasts: an emerging imperative. Science 293, 657–660. ( 10.1126/science.293.5530.657) [DOI] [PubMed] [Google Scholar]
- Codeço C. 2001. Endemic and epidemic dynamics of cholera: the role of the aquatic reservoir. BMC Infect. Dis. 1, 1 ( 10.1186/1471-2334-1-1) [DOI] [PMC free article] [PubMed] [Google Scholar]
- Codeço C. T., Lele S., Pascual M., Bouma M., Ko A. I. 2008. A stochastic model for ecological systems with strong nonlinear response to environmental drivers: application to two water-borne diseases. J. R. Soc. Interface 5, 247–252. ( 10.1098/rsif.2007.1135) [DOI] [PMC free article] [PubMed] [Google Scholar]
- Colizza V., Vespignani A. 2007. Invasion threshold in heterogeneous metapopulation networks. Phy. Rev. Lett. 99, 148701 ( 10.1103/PhysRevLett.99.148701) [DOI] [PubMed] [Google Scholar]
- Colwell R. 1996. Global climate and infectious disease: the cholera paradigm. Science 274 2025–2031. ( 10.1126/science.274.5295.2025) [DOI] [PubMed] [Google Scholar]
- De Bartolo S., Dell'Accio F., Veltri M. 2009. Approximations on the Peano river network: Application of the Horton–Strahler hierarchy to the case of low connections. Phys. Rev. E 79, 026108 ( 10.1103/PhysRevE.79.026108) [DOI] [PubMed] [Google Scholar]
- Diekmann O., Heesterbeek J., Metz J. 1990. On the definition and the computation of the basic reproduction ratio R0 in models for infectious-diseases in heterogeneous populations. J. Math. Biol. 28, 365–382. ( 10.1007/BF00178324) [DOI] [PubMed] [Google Scholar]
- Faruque S., Bin Naser I., Islam M., Faruque A., Ghosh A., Nair G., Sack D., Mekalanos J. 2005. Seasonal epidemics of cholera inversely correlate with the prevalence of environmental cholera phages. Proc. Natl Acad. Sci. USA 102, 1702–1707. ( 10.1073/pnas.0408992102) [DOI] [PMC free article] [PubMed] [Google Scholar]
- Hartley D., Morris J., Smith D. 2006. Hyperinfectivity: a critical element in the ability of V. cholerae to cause epidemics? Plos Med. 3, 63–69. ( 10.1371/journal.pmed.0030007) [DOI] [PMC free article] [PubMed] [Google Scholar]
- Hughes B. 1995. Random walks and random environments Oxford, UK: Clarendon Press. [Google Scholar]
- Islam M., Mahmuda S., Morshed M., Bakht H., Khan M., Sack R., Sack D. 2004. Role of cyanobacteria in the persistence of Vibrio cholerae O139 in saline microcosms. Can. J. Microbiol. 50, 127–131. ( 10.1139/W03-114) [DOI] [PubMed] [Google Scholar]
- Johnson A., Hatfield C., Milne B. 1995. Simulated diffusion dynamics in river networks. Ecol. Model. 83, 311–325. ( 10.1016/0304-3800(94)00107-9) [DOI] [Google Scholar]
- Keeling M. 1999. The effects of local spatial structure on epidemiological invasions. Proc. R. Soc. Lond. B 266, 859–867. ( 10.1098/rspb.1999.0716) [DOI] [PMC free article] [PubMed] [Google Scholar]
- Keeling M., Eames K. 2005. Networks and epidemic models. J. R. Soc. Interface 2, 295–307. ( 10.1098/rsif.2005.0051) [DOI] [PMC free article] [PubMed] [Google Scholar]
- Koelle K., Rodo X., Pascual M., Yunus M., Mostafa G. 2005. Refractory periods and climate forcing in cholera dynamics. Nature 436, 696–700. ( 10.1038/nature03820) [DOI] [PubMed] [Google Scholar]
- Koenig R. 2009. Public health: international groups battle cholera in Zimbabwe. Science 323, 860–861. ( 10.1126/science.323.5916.860) [DOI] [PubMed] [Google Scholar]
- Lipp E., Huq A., Colwell R. 2002. Effects of global climate on infectious disease: the cholera model. Clin. Microbiol. Rev. 15, 757–770. ( 10.1128/CMR.15.4.757-770.2002) [DOI] [PMC free article] [PubMed] [Google Scholar]
- Miller C., Feachem R., Drasar B. 1985. Cholera epidemiology in developed and developing-countries—new thoughts on transmission, seasonality, and control. Lancet 1, 261–263. ( 10.1016/S0140-6736(85)91036-0) [DOI] [PubMed] [Google Scholar]
- Muneepeerakul R., Bertuzzo E., Lynch H. J., Fagan W. F., Rinaldo A., Rodriguez-Iturbe I. 2008. Neutral metacommunity models predict fish diversity patterns in Mississippi–Missouri basin. Nature 453, 220–222. ( 10.1038/nature06813) [DOI] [PubMed] [Google Scholar]
- Parham P. E., Ferguson N. M. 2006. Space and contact networks: capturing the locality of disease transmission. J. R. Soc. Interface 3, 483–493. ( 10.1098/rsif.2005.0105) [DOI] [PMC free article] [PubMed] [Google Scholar]
- Pascual M., Rodo X., Ellner S., Colwell R., Bouma M. 2000. Cholera dynamics and El Nino-Southern oscillation. Science 289, 1766–1769. ( 10.1126/science.289.5485.1766) [DOI] [PubMed] [Google Scholar]
- Pascual M., Bouma M., Dobson A. 2002. Cholera and climate: revisiting the quantitative evidence. Microbes Infect. 4, 237–245. ( 10.1016/S1286-4579(01)01533-7) [DOI] [PubMed] [Google Scholar]
- Pascual M., Chaves L. F., Cash B., Rodo X., Yunus M. 2008. Predicting endemic cholera: the role of climate variability and disease dynamics. Climate Res. 36, 131–140. ( 10.3354/cr00730) [DOI] [Google Scholar]
- Riley S. 2007. Large-scale spatial-transmission models of infectious disease. Science 316, 1298–1301. ( 10.1126/science.1134695) [DOI] [PubMed] [Google Scholar]
- Rinaldo A., Rodriguez-Iturbe I., Rigon R., Bras R., Vasquez E., Marani A. 1992. Minimum energy and fractal structures of drainage networks. Water Resour. Res. 28, 2183–2195. ( 10.1029/92WR00801) [DOI] [Google Scholar]
- Rodriguez-Iturbe I., Rinaldo A. 1997. Fractal river basins: chance and self-organization. New York, NY: Cambridge University Press. [Google Scholar]
- Rodriguez-Iturbe I., Rinaldo A., Rigon R., Bras R., Ijjaszvasquez E., Marani A. 1992. Fractal structures as least energy patterns—the case of river networks. Geophys. Res. Lett. 19, 889–892. ( 10.1029/92GL00938) [DOI] [Google Scholar]
- Ruiz-Moreno D., Pascual M., Bouma M., Dobson A., Cash B. 2007. Cholera seasonality in Madras (1901–4940): dual role for rainfall in endemic and epidemic regions. Ecohealth 4, 52–62. ( 10.1007/s10393-006-0079-8) [DOI] [Google Scholar]
- Triska F., Duff J., Avanzino R. 1993. Patterns of hydrological exchange and nutrient transformation in the hyporheic zone of a gravel-bottom stream—examining terrestrial aquatic linkages. Freshwater Biol. 29, 259–274. ( 10.1111/j.1365-2427.1993.tb00762.x) [DOI] [Google Scholar]
- Worman A., Packman A., Johansson H., Jonsson K. 2002. Effect of flow-induced exchange in hyporheic zones on longitudinal transport of solutes in streams and rivers. Water Resour. Res. 38, 1001 ( 10.1029/2001WR000769) [DOI] [Google Scholar]
- Zipf G. K. 1949. Human behavior and the principle of least effort: an introduction to human ecology. Cambridge, MA: Addison–Wesley. [Google Scholar]


