Abstract
There is a history dependence of skeletal muscle contraction: stretching activated muscles induces a long-lasting force enhancement, while shortening activated muscles induces a long-lasting force depression. These history-dependent properties cannot be explained by the current model of muscle contraction, and its mechanism is unknown. The purposes of this study were (i) to evaluate if force enhancement and force depression are present at short lengths (the ascending limb of the force–length (FL) relationship), (ii) to evaluate if the history-dependent properties are associated with sarcomere length (SL) non-uniformity and (iii) to determine the effects of cross-bridge (de)activation on force depression. Rabbit psoas myofibrils were isolated and attached between two microneedles for force measurements. Images of the myofibrils were projected onto a linear photodiode array for measurements of SL. Myofibrils were activated by either Ca2+ or MgADP; the latter induces cross-bridge attachment to actin independently of Ca2+. Activated myofibrils were subjected to three stretches or shortenings (approx. 4% SL at approx. 0.07 µm s−1 sarcomere−1) along the ascending limb of the FL relationship separated by periods (approx. 5 s) of isometric contraction. Force after stretch was higher than force after shortening at similar SLs. The differences in force could not be explained by SL non-uniformity. The FL relationship produced by Ca2+- and MgADP-activated myofibrils were similar in stretch experiments, but after shortening MgADP activation produced forces that were higher than Ca2+ activation. Since MgADP induces the formation of strongly bound cross-bridges, this result suggests that force depression following shortening is associated with cross-bridge deactivation.
Keywords: myofibrils, sarcomeres, instability, force–length relationship
1. Introduction
There is a well-documented history dependence of force production when skeletal muscles contract along the descending limb of the force–length (FL) relation. The force produced following shortening or stretching of activated muscles is lower (force depression) or higher (force enhancement), respectively, than the force produced during isometric contractions at the corresponding length (Julian & Morgan 1979; Marechal & Plaghki 1979; Sugi & Tsuchiya 1988; Granzier & Pollack 1989; Edman et al. 1993; Rassier et al. 2003b). In contrast, history-dependent properties along the ascending limb of the FL relation are a matter of debate. Some authors observed significant levels of force enhancement (Peterson et al. 2004) and force depression (Granzier & Pollack 1989) in this region while others detect small effects of muscle shortening and/or stretching on force production (Julian & Morgan 1979; Edman et al. 1993). The reason for the discrepancy is unknown, but it may rely on the experimental preparations: isolated fibres commonly tested in these studies lack direct information on individual sarcomeres. Length measurements are based on the average profile of many sarcomeres, which vary largely during activation (Julian & Morgan 1979; Edman & Reggiani 1984; Telley et al. 2006a,b). Some sarcomeres might contract on the descending limb while the average sarcomere length (SL) exhibits properties associated with the ascending limb of the FL relation.
Although the history dependence of force production has been recognized for more than 50 years (Abbot & Aubert 1952), its mechanism remains elusive, which represents a significant gap in our understanding of muscle contraction. History-dependent properties cannot be explained by the cross-bridge model of contraction (Huxley 1957) or the sliding filament theory (Huxley & Hanson 1954; Huxley & Niedergerke 1954), and thus its understanding has far-reaching implications. A hypothesis that receives much attention in the literature proposes that force enhancement and force depression are caused by SL non-uniformity and instability along the descending limb of the FL relation (Julian & Morgan 1979; Morgan 1994; Morgan et al. 2000). Accordingly, shortening and/or stretching of muscle fibres would lead to sarcomeres with distinct lengths, which would equilibrate at force levels considerably different from those obtained during isometric contractions (Morgan 1994). However, there is mounting evidence suggesting that SL non-uniformity and instability cannot solely explain the history-dependent properties of force production (Rassier et al. 2003a; Pinniger et al. 2006; Roots et al. 2007; Joumaa et al. 2008). An alternative mechanism to explain force depression proposed many years ago has not yet been rejected: force depression would be caused by an inhibition of cross-bridges entering a new zone of filament overlap during shortening (Marechal & Plaghki 1979), which may result from actin filament deformation (Daniel et al. 1998). Indirect evidence suggests that such mechanism may work (Herzog & Leonard 1997; Herzog et al. 2000), but studies with direct SL measurements are still lacking.
The regulation of cross-bridge attachment to actin is commonly associated with the effects of Ca2+ on the thin filament (Gordon et al. 2000). When Ca2+ binds to the regulatory protein troponin C (TnC), it causes the displacement of tropomyosin allowing cross-bridge attachment to actin, forming a weakly bound myosin–actin–ATP complex. ATP is then hydrolysed and phosphate is released, forming a strongly bound myosin–actin–ADP complex. The strongly bound complex causes conformational changes in the thin filament, increasing the probability of new cross-bridges to attach to actin. Therefore, activation of the thin filament is coordinated by Ca2+ binding to TnC and also strong binding of cross-bridges to actin filaments.
In this study, we evaluated the history-dependent properties of force production on the ascending limb of the FL relation using isolated myofibrils activated with Ca2+ or MgADP. Myofibrils allow the evaluation of individual SLs to test the relationship between force and SL non-uniformity. Activation with MgADP generates strong binding of cross-bridges and actin independently of Ca2+ (Bremel & Weber 1972; Greene et al. 1987; Zhang et al. 2000), allowing the evaluation of cross-bridge (de)activation during force production. We tested the following hypotheses: (i) stretching of skeletal muscles activated along the ascending limb of the FL relation produces force enhancement, (ii) shortening of skeletal muscles activated along the ascending limb of the FL relation produces force depression, (iii) force enhancement and force depression are associated with the degree of SL non-uniformity and (iv) force depression is inhibited by MgADP-induced cross-bridge activation.
2. Material and Methods
(a). Preparation of myofibrils
Small sections of rabbit psoas muscle were dissected and tied to wood sticks. The samples were stored in rigor solution (pH = 7.0) for 4 h, after which they were transferred to a rigor : glycerol (50 : 50) solution for 15 h. Specimens were subsequently placed in a fresh rigor : glycerol (50 : 50) solution with the addition of protease inhibitors (Roche Diagnostics) and stored in a freezer (−20°C) for at least 7 days. On the day of an experiment, a muscle sample was transferred to rigor solution. Single myofibrils were obtained by cutting a small section of the sample (approx. 2 mm in length) and homogenizing (Troemer/VWR Power Max AHS 250, Oxford, USA) using the following sequence: twice for 5 s at 7500 r.p.m.; once for 2 s at 15 000 r.p.m., once for 2 s at 18 000 r.p.m.).
(b). Solutions
The rigor solution (pH 7.0) was composed of (in mM): 50 Tris, 100 NaCl, 2 KCl, 2 MgCl2 and 10 EGTA. The relaxing solution (pH 7.0) was composed of (in mM): 10 MOPS, 64.4 K+ propionate, 5.23 Mg2+ propionate, 9.45 Na2SO4, 10 EGTA, 7 ATP, 10 creatine phosphate. The Ca2+-activating solution (pH 7.0; pCa2+ = 4.5) was composed of (in mM): 10 MOPS, 45.1 K+ propionate, 5.21 Mg2+ propionate, 9.27 Na2SO4, 10 EGTA, 7.18 ATP, 10 creatine phosphate. The ADP-activating solution (pH 7.0) was composed of (in mM): 2 Mg2+, 20 MOPS, 4 EGTA, 1 ATP and 10 MgADP. We performed pilot experiments with Ca2+ (n = 4) and MgADP concentrations of 5 mM (n = 2), 10 mM (n = 2) and 20 mM (n = 2). The force produced by 10 mM MgADP closely approximated forces produced by the Ca2+-activated myofibrils during isometric contractions at a similar SL, and thus this concentration was used during the main experiments.
(c). Experimental setup
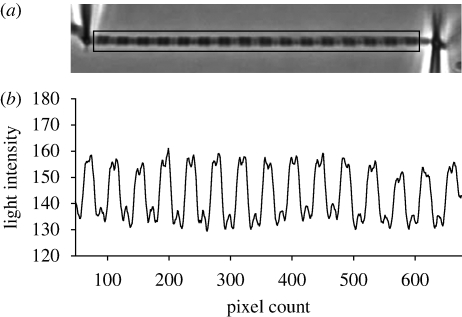
The homogenized sample was transferred into a chamber with the bottom made of a grease vacuum-sealed glass coverslip (thickness: approx. 0.15 mm). The bath was kept at a constant temperature of 15°C. The sample was rinsed several times with rigor solution, and then the relaxing solution was added to the sample. Myofibrils were chosen based on striation pattern and number of sarcomeres (between 10 and 20). A single myofibril or a doublet of myofibrils was grabbed using two glass microneedles produced with a pipette puller (KOPF 720, David Kopf Inst., Tujunga, USA) and lifted off the glass slide by approx. 2 µm (figure 1). One microneedle used during the experiments had a high stiffness (more than 2000 nN µm−1) which made it rigid during the contractions and was connected to a motor arm, allowing for computer-controlled length changes in the myofibrils. The other microneedle was flexible to allow for force measurements (stiffness between 210 and 295 nN µm−1). Calibration of the microneedle was performed by the cross-bending method (Ayittey et al. 2009), using pairs of cantilevers of stiffness varying between 22 and 348 nm µm−1, similar to those used previously in our laboratory for force measurements (Rassier 2008). The cantilevers were produced with nanofabrication techniques and were pre-calibrated before use (Fauver et al. 1998).
Figure 1.
(a) Photograph of a myofibril attached between a pre-calibrated, flexible glass needle and a rigid glass needle. The striation pattern of the myofibril is produced by the arrangement of myosin and actin filaments, and is projected onto a linear photodiode array, represented by the box around the myofibril. (b) One representative scan of the same myofibril. The striation pattern results in a light intensity patterns, in which the big peaks correspond to the dark A-bands, the valleys correspond to the I-bands, and the small peaks correspond to the Z-lines. Note that even the M-line is visible in some sarcomeres, in the centre of the A-bands. By tracking the position of the intensity peaks in consecutive scans produced during the experiments, changes in SL can be analysed as a function of time.
Under low magnification (10–20×), the attached myofibril was centred in the microscope optical field. Under high magnification provided by a phase contrast lens (Nikon plan-fluor, 60×, NA 0.70), the image of the myofibril was projected onto a linear photodiode array (Schafter + Kirchhoff SK4096DJR, Germany) with 4096 pixels (pixel size: 10 µm × 10 µm). The images of the myofibril were magnified an additional 1.5× by an internal microscope function and were scanned to produce peak tracings of light intensity. The contrast between the dark bands of myosin (A-bands) and the light bands of actin (I-bands) provided a dark–light intensity pattern representing the striation pattern produced by the individual sarcomeres (figure 1). The peaks produced by the microneedles were also tracked by the linear photodiode array. When the myofibril contracts, the microneedle is displaced and the force (F) can be calculated based on the known stiffness and amount of microneedle displacement as follows:
where Δd = absolute difference between the initial and the final distance between the two microneedles, K = stiffness, 1 and 2 = micro-needles 1 and 2, respectively. SL was calculated using a modified minimum average risk algorithm, based on the distance between adjacent A-band centroids (Sokolov et al. 2003; Rassier 2008). The image of the myofibril was also collected by a CCD camera (Go-3, QImaging, USA; pixel size: 3.2 µm × 3.2 µm) used for calculation of myofibril diameter, radius (r) and cross-sectional area (CSA), which was estimated assuming circular symmetry: CSA = πr2. The final resolution of the camera is 0.035 µm, which makes the error around the diameter measurements small (approx. 3.5%).
Exchange of solutions during the experiments was achieved using a computer-controlled, multi-channel perfusion system (VC–6M, Harvard Apparatus, USA) attached to a double-barreled pipette (de Tombe et al. 2007; Rassier 2008). The double-barreled pipette was produced by the same pipette puller that was used for producing the microneedles and was subsequently polished to reach an inner diameter of approx. 600 µm, each of the two channels with an inner diameter of approx. 300 µm. The pipette was placed close to the myofibrils (approx. 100 µm) with the two channels having solutions flowing uninterruptedly throughout the experiments. The pipette was moved horizontally to the myofibrils' plane in order to change the solutions, which produced a quick solution exchange. The solutions were continuously dragged from the experimental chamber through a back channel by using a peristaltic pump (Instech P720, Harvard Apparatus, USA); the flow rate achieved with this system was approx. 5 µl s−1.
(d). Experimental protocol
During the main set of experiments, the initial, average SL at rest was adjusted to approx. 2.6 µm for stretch experiments and approx. 3.0 µm for shortening experiments. The lengths were chosen after pilot experiments so to provide full activation data along the ascending limb of the FL relation during subsequent length changes. The myofibrils were passively stretched to the desired SL before activation, while the position of the microneedles was continuously scanned for the evaluation of passive forces. In the range of lengths that were used in these experiments passive force development was not usually observed. Myofibrils (n = 30) were divided into four groups: (i) Ca2+-activated myofibrils that were stretched during the experimental protocol (Ca2+-STR, n = 8), (ii) Ca2+-activated myofibrils that were shortened during the experimental protocol (Ca2+-SHO, n = 7), (iii) MgADP-activated myofibrils that were stretched during the experimental protocol (ADP-STR, n = 8) and (iv) MgADP-activated myofibrils that were shortened during the experimental protocol (ADP-SHO, n = 7). The reason for using four groups was the low repeatability typically observed in experiments with myofibrils; we were able to perform three to four activation–relaxation cycles with each myofibril activated with Ca2+ or MgADP without significant force loss (less than 95%). We decided to increase the intra-variability observed among myofibrils while decreasing the inter-variability observed in a given experiment.
After the myofibrils were suspended from the coverslip by the microneedles, relaxing solution was flown through the myofibrils for approx. 10 s. The relaxing solution was replaced by an activating solution containing either high Ca2+ or MgADP. Activation was held isometric for at least 5 s, after which three successive length changes (stretching or shortening) were imposed, each separated by approx. 5 s to achieve steady-state forces. Length changes were made at nominal amplitude of 4 per cent of the initial rest SL, at a speed of 0.07 µm s−1 sarcomere−1. This procedure lead to differences in the length change induced during stretch and shortening, as the SLs during the isometric period of contractions before the length perturbations were slightly different. However, the absolute difference was small (0.02 µm or less), and it is unlikely that it caused large discrepancies in the steady-state forces measured after the imposed length changes. After the final isometric period, the myofibril was relaxed.
(e). Data analysis and statistics
Forces normalized by the CSA and SL were calculated before activation, after initial activation, during steady-state force development at approx. 4.6 s after each length change (stretch/shortening) and after myofibril relaxation. The degree of SL dispersion (SLdis) in each myofibril was calculated by subtracting the individual SLi from the average SL, and it was used as an indication of SL non-uniformity, which is defined as the difference among individual SLs at a given time during the contractions.
Differently from experiments performed along the descending limb of the FL relation, activation of myofibrils along the ascending limb of the FL relation often produces different degrees of sarcomere shortening. Furthermore, nominal length changes induced during the experiment resulted in varying levels of sarcomere shortening and/or stretching. Therefore, we performed an analysis of covariance (ANCOVA) comparing methods (stretch or shortening) and conditions (Ca2+- or MgADP-activation) using SL measures as covariates. The same analysis was performed to compare the SLdis among the different methods and conditions.
3. Results
(a). MgADP-induced isometric contractions
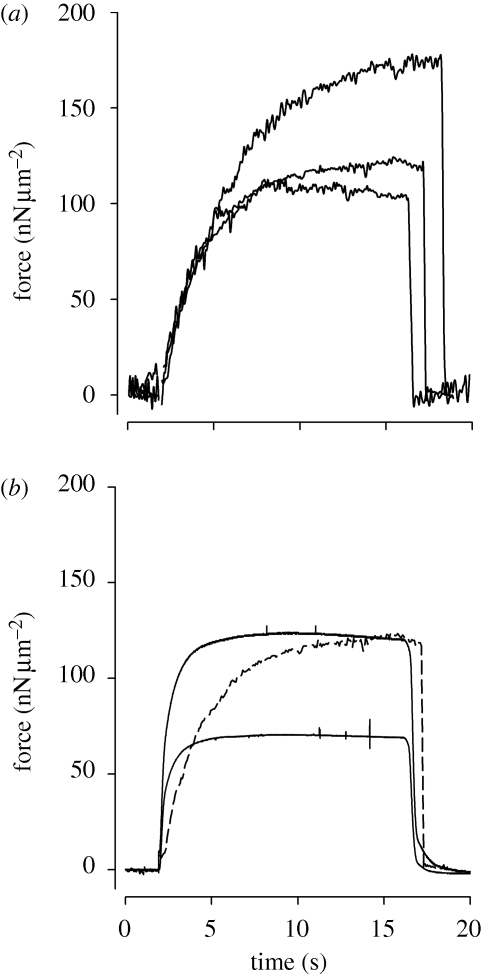
The maximal isometric forces produced by the myofibrils after MgADP-activation differed depending on the concentration, such that higher MgADP levels produced higher forces (figure 2). We used 10 mM MgADP for the remaining experiments as it provided forces that were similar to that of Ca2+-activated myofibrils. All MgADP concentrations used in this study elicited similar rates of force development (rate constant: 0.18 ± 0.04 s−1), that were nevertheless lower than that observed in Ca2+-activated myofibrils (rate constant: 4.7 ± 0.07 s−1), similar to previous studies looking at MgADP activation of myofibrils (Shimamoto et al. 2007).
Figure 2.
(a) Forces produced by a myofibril activated with 5, 10 and 20 mM of MgADP at an average rest SL of 2.5 µm. (b) Forces produced by a myofibril activated with Ca2+ at average rest SLs of 2.5 and 1.9 µm (high and low forces shown with solid lines). The figure also shows the contraction induced with 10 mM of MgADP (traced line); after full development, the force is similar to that produced with Ca2+ at a similar SL.
(b). History dependence of force production
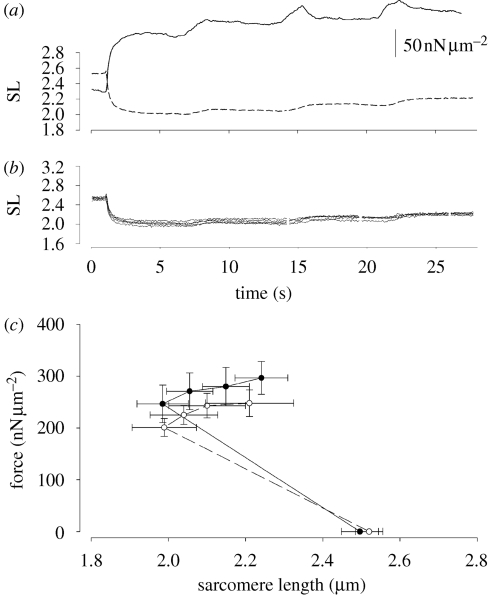
Figure 3a shows a typical experiment produced with a Ca2+-activated myofibril stretched along the ascending limb of the FL relation. During the initial activation, all sarcomeres shortened, albeit by different amounts, causing a smooth shortening in the average SL tracing. Sarcomere shortening was likely caused by a combination of series visco-elasticity at the two attachment sites of the myofibrils, and the compliance of one of the microneedles. Therefore, strictly isometric contractions were not produced—in this study, we assume that a contraction is isometric when length changes are not imposed externally to the myofibrils. In figure 3a, the average SL shortening was 0.49 µm from the initial length. There is an increase in the degree of SLdis during activation, similar to the results observed previously when contractions are performed at longer lengths (Telley et al. 2006a; Rassier 2008). Each stretch step caused an increase in force, which was maintained elevated after the stretch. The degree of SL non-uniformity remained relatively constant throughout the consecutive stretches (figure 3b). Although the total imposed stretch was of approx. 0.33 µm, the actual length change was smaller (approx. 0.22 µm), suggesting that some of the length perturbations were taken by the myofibril attachment sites. This difference makes lengths changes less predictable, but still do not affect the main result of this study; stretch increases the force beyond the isometric levels during the contractions.
Figure 3.
(a) Experiment performed with a myofibril activated with Ca2+ and stretched along the ascending limb of the FL relation. Solid line represents the force and the dashed line represents the average SL. During stretches, force increases and remains elevated during the isometric period of the contractions. (b) Individual SLs from the same myofibril. The SLdis increases during activation but it does not change significantly after the stretches. (c) Average force values for all experiments performed with myofibrils activated with Ca2+ (open symbols) and MgADP (closed symbols) at rest (low forces, close to zero), activation and after three stretches. All results are mean ± s.e.m.
The averaged forces produced during initial myofibril activation with Ca2+ or MgADP, and throughout the stretches during experiments are shown in figure 3c. We started the experiments at lengths that would lead to full force development along the ascending limb of the FL relation during the entire protocol. Small differences in the degree of myofibril shortening during activation lead to variations in the average SLs during the isometric period of contraction, before the lengths perturbations, and consequently, the SLs achieved during stretching. Nonetheless, in both Ca2+- and ADP-activated myofibrils, the force increased during consecutive stretches.
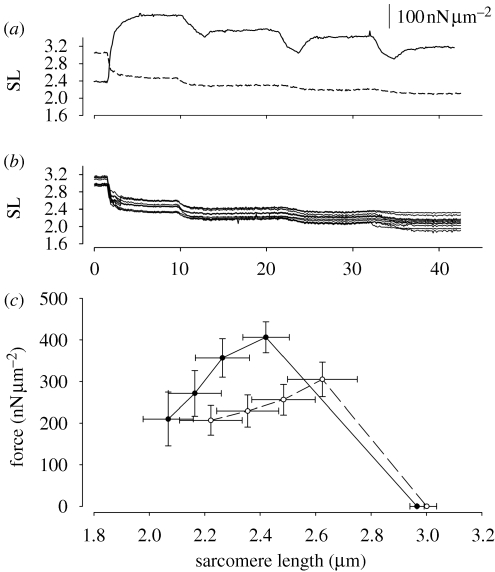
Figure 4a shows a typical experiment produced with an MgADP-activated myofibril shortened along the ascending limb of the FL relation. All sarcomeres shorten during activation, albeit by different amounts. In this example, the average amount of shortening was 0.55 µm from the initial length. There was an increase in SLdis during activation, which remained similar throughout the consecutive shortenings except after the third shortening step, when the degree of SLdis increased slightly (figure 4b). Opposite to the stretch experiments, each shortening step caused a decrease in force, which was maintained lower during the isometric contractions. The averaged forces produced during the experiments are shown in figure 4c. Similar to the stretch experiments, we tried to set the myofibrils in a rest SL such that the isometric forces would be similar for any given condition, but small differences were still observed between groups.
Figure 4.
(a) Experiment performed with a myofibril activated with MgADP and shortened along the ascending limb of the FL relation. Solid line represents the force and the dashed line represents the average SL. During shortening, force decreases and remains low during the isometric period of the contractions. (b) Individual SLs from the same myofibril. The SLdis increases during activation but it remains relatively constant after the shortenings. (c) Average force values for experiments performed with myofibrils activated with Ca2+ (open symbols) and MgADP (closed symbols) at rest (low forces, close to zero), activation and after three shortenings. Activation induced different levels of shortening in the two groups. As a result, the forces were different at the beginning of the protocol and some myofibrils remained mostly along the plateau of the FL relation until a second shortening step was imposed. However, the general FL relation still reflects mostly the force produced at lengths below the plateau of the FL relation. All results are mean ± s.e.m.
(c). The force–sarcomere length relation
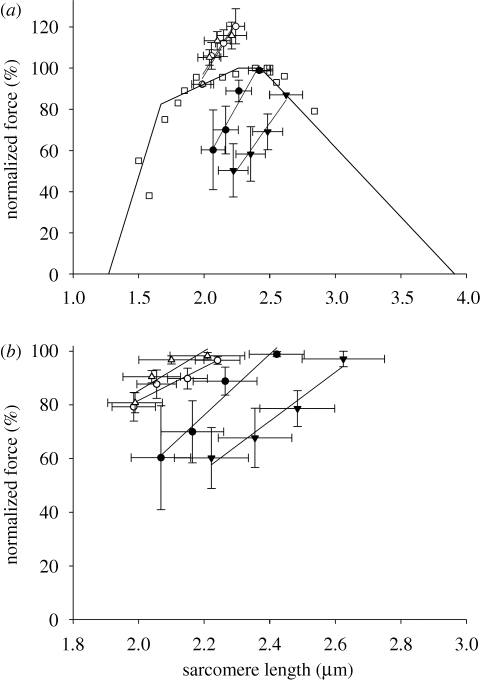
The FL relation was originally used to describe steady-state forces during isometric contractions achieved at different SL upon activation (Gordon et al. 1966). In the current study, we measured isometric forces achieved after length perturbations. Thus, we refer to the relation between force and SL in this study as ‘dynamic FL relation’—obtained after dynamic length changes. Figure 5a shows the dynamic FL relation for all conditions investigated in this study, and also the theoretical FL (Gordon et al. 1966). The ANCOVA results failed to detect a significant interaction among factors. The methods differed significantly, such that stretches always produced higher forces than shortening. Furthermore, the ADP-SHO group was different from all other groups—including the Ca2+-SHO group. We also normalized the data for the maximum force produced in each experiment, either at the end of the three stretches or at the beginning of the shortening protocol (figure 5b). This way we can compare the dynamic FL relations taking into account that force may be influenced by the cumulative effect of the consecutive length changes. The conclusion is similar to that of figure 5a; the dynamic FL relation differs when constructed through shortening or stretch contractions.
Figure 5.
The dynamic FL relation produced by the four groups investigated in this study. (a) Force was normalized by the isometric forces produced before the first length change in each experiment (approx. 5 s after the initial activation). Solid line shows the theoretical FL relation (Gordon et al. 1966) using the filament lengths from the rabbit psoas muscle (Sosa et al. 1994). The results of four experiments with myofibrils activated with Ca2+ to produce purely isometric contractions are also shown. The shapes of the dynamic FL relations are significantly different, except by the two stretch conditions that were similar to each other. (b) Force normalized by the maximal force produced during the protocol. The shapes of the FL relation are significantly different, except by the two stretch conditions that were similar to each other. All results are mean ± s.e.m. Filled circle, ADP-SHO; open circle, ADP-STR; filled inverted triangle, Ca2+-SHO; open triangle, Ca2+-STR; open square, isometric.
(d). Sarcomere length dispersion
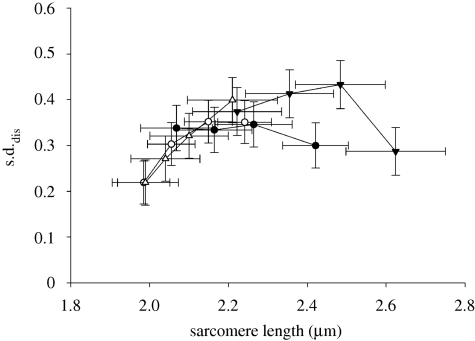
SLdis was calculated at the same times as force during the experiments by subtracting the deviation of individual SL (SLi) from the average SL in each myofibril. Assuming that the averaged SLdis values in different myofibrils presents a Gaussian distribution, the s.d. of these calculated differences (s.d.dis) was compared among conditions (figure 6). A significant statistical interaction was not observed, but there was an overall increase in the s.d.dis from rest to activation, which did not change throughout contractions. There was no difference between methods and conditions.
Figure 6.
The s.d. of the SLdis (s.d.dis) calculated during the experiments. The s.d.dis increased from the rest to activation, but it did not change throughout contractions and it was not significantly different among conditions. All results are means ± s.e.m. Filled circle, ADP-SHO; open circle, ADP-STR; filled inverted triangle, Ca2+-SHO; open triangle, Ca2+-STR.
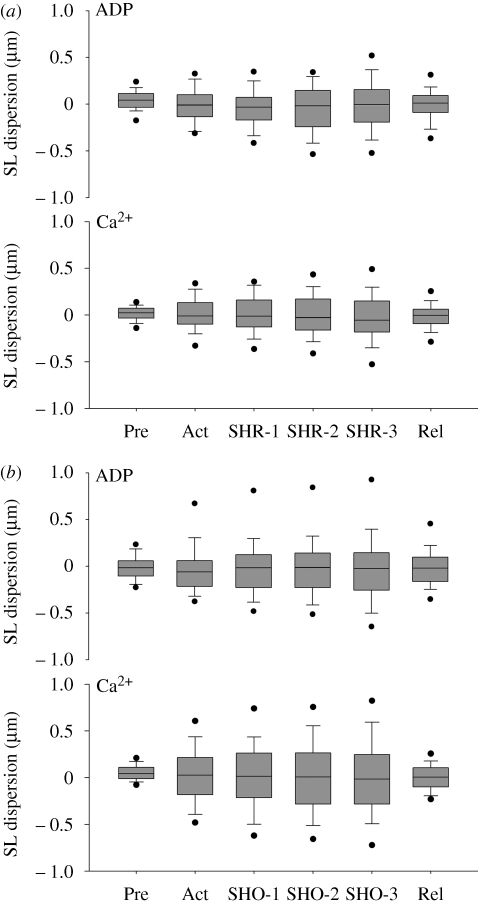
Since the SLdis might vary according to the average SL at which the protocol started (i.e. longer lengths for the shortening protocol than for the stretching protocol), we also analysed the SLdis taking into account the length steps independent from the absolute SLs (figure 7). The results were similar to those shown in figure 6; there was a lack of statistical interaction among factors, but overall the SLdis increased from rest to activation, without further changes throughout the contractions. There was no difference between methods and conditions.
Figure 7.
SLdis plotted against the step change during the experiments with (a) stretch and (b) shortening. SLdis increases with activation but it remains constant throughout the contractions, with no significant differences between treatments. All sarcomeres from all myofibrils are represented in the box plots. The line inside each box plot represents the median, the boundaries represent the 25th and 75th percentiles and the outliners (dots) represent the 95% confidence interval. Pre, pre-activation; Act, activation; Rel, relaxation; STR, stretch; SHO, shortening.
4. Discussion
The main findings of this study were that (i) stretching of skeletal muscles activated along the ascending limb of the FL relation produced force enhancement, (ii) shortening of skeletal muscles activated along the ascending limb of the FL relation produced force depression, (iii) force enhancement and force depression were not associated with SL non-uniformity and (iv) force depression was inhibited by MgADP-induced cross-bridge activation. Thus, hypothesis (iii) as raised in the beginning of this study was rejected. Of particular interest was the fact that activation of myofibrils with MgADP changed the dynamic FL relation after shortening contractions, such that it was shifted to the left when compared with Ca2+-activated myofibrils.
(a). History-dependent properties
The effects of previous stretch and shortening on isometric forces have been broadly investigated on the descending limb of the FL relation. It is well accepted that shortening induces a long-lasting (more than 15 s) force depression and that stretch induces a long-lasting (more than 15 s) force enhancement (Rassier & Herzog 2004). However, little is known about history-dependent properties of contractions performed along the ascending limb of the FL relation. A few studies performed in this region with single fibres show contradictory results; while some observed force enhancement (Peterson et al. 2004) and force depression (Granzier & Pollack 1989), others detected small effects of muscle shortening and/or stretching on force (Julian & Morgan 1979; Edman et al. 1993). The discrepant results may be associated with the experimental preparations used in past studies. Measuring SL along the ascending limb of the FL relation is challenging, as the striation spacing becomes poorly defined among sarcomeres arranged in series and in parallel within the fibres. Even when experiments are successful, muscle fibres allow only measurements of the average SL profile, taken from millions of sarcomeres. SL shows a high degree of variability and dispersion during muscle activation (Julian & Morgan 1979; Edman & Reggiani 1984; Rassier et al. 2003a; Telley et al. 2006a,b), which leads to results that are difficult to interpret. In the current study, we used single myofibrils, which allow the evaluation of individual sarcomeres. We observed that forces are in fact dependent on the history of contraction: shortening and stretch leads to force depression and force enhancement, respectively. The differences are remarkable, with substantial shifts along the dynamic FL relation. The mechanisms behind the history dependence of force production are unclear and a matter of intense debate, but could be associated with SL non-uniformity or cross-bridge kinetics (Rassier & Herzog 2004).
(b). SLdis and non-uniformity
It has been proposed that SL non-uniformity associated with mechanical instability is responsible for the history-dependent force production following stretching and shortening. When muscles are stretched or shortened during activation, the degree of SL non-uniformity that develops at the beginning of contraction would increase due to an intrinsic instability of the sarcomeres—strong sarcomeres would continuously shorten at the expense of sarcomeres that would stretch. As a result, sarcomeres would contract at lengths that are different from those induced during purely isometric contractions, providing conditions that cause force enhancement and force depression (Morgan 1994; Morgan et al. 2000). Such a mechanism would work primarily on the descending limb of the FL relation, a region conceptually ‘unstable’ given its negative slope. On the other hand, history dependence of force production should not be observed along the ascending limb of the FL relation, a region conceptually ‘stable’. This assumption was not confirmed in the current study. The degree of SLdis increased with activation, but it did not change significantly after consecutive length changes, even if the forces changed. It is possible that small length changes of sarcomeres after the length perturbations (e.g. figures 3b and 4b, Telley et al. 2006b) may change the forces and the sarcomeres may never reach a steady state. However, such changes are considerably smaller than those predicted to happen in models that incorporate SLdis and instability to explain force enhancement and force depression (Morgan 1994). Also, it is noteworthy that shortening induces a slightly larger SLdis than stretching (figure 7), suggesting that stretching may stabilize the sarcomeres rather than producing instability. More investigation is necessary to investigate this issue, as such a difference did not attain a statistical significance in the current study. Overall, the results of these experiments confirm previous studies in which stretches were applied to myofibrils contracting along the plateau and descending limb of the FL relation (Rassier et al. 2003a,b; Telley et al. 2006b; Joumaa et al. 2008; Rassier 2008). SL non-uniformity and SLdis cannot explain, at least entirely, the changes in force produced by shortening and/or stretch.
(c). Effects of ADP, cross-bridges deactivation and force depression
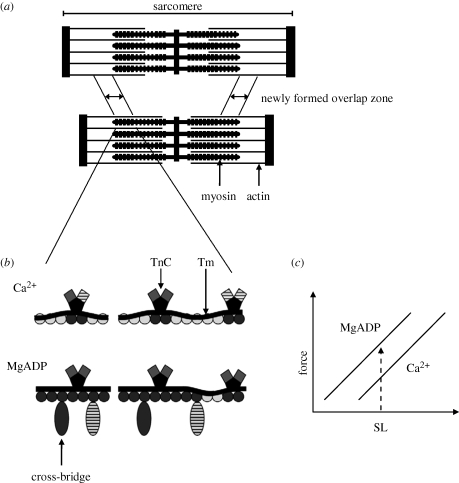
The mechanisms of force depression may be intrinsic to the contractile machinery (Marechal & Plaghki 1979; Sugi & Tsuchiya 1988). Marechal & Plaghki (1979) suggested that force depression is caused by an inhibition of cross-bridge attachment in the overlap zone newly formed during muscle shortening. When muscle is activated, stress may cause angular distortions in the actin filaments, misaligning myosin binding sites (Daniel et al. 1998). When the muscle is shortened, the stress in the thin filaments is maintained and the probability of cross-bridge attachment in the newly formed overlap zone would be reduced. Although the hypothesis received indirect support in experiments with whole muscles (Herzog & Leonard 1997; Herzog et al. 2000), it has never been tested systematically in studies including SL measurements. Our results suggest that such a mechanism may work, as when myofibrils were activated with MgADP, which potentially decreases the inhibition of cross-bridge attachment in the overlap zone newly formed during shortening, they produced a dynamic FL relation that was left-shifted when compared to that induced by Ca2+ activation (figure 8). A leftward shift in the dynamic FL relation produced with MgADP activation suggests that, for a given SL, the force is higher than that produced by Ca2+ activation.
Figure 8.
(a) Diagram showing the overlap zone newly formed during shortening (Marechal & Plaghki 1979). When activated muscles (top) are shortened (bottom), the newly formed overlap zone inhibits cross-bridge attachment to actin, and thus the force is less than that produced during isometric contractions at the corresponding length. (b) A representation of one regulatory unit containing a thin filament with seven actin monomers and one Tm–TnC complex (left) (based on Gordon et al. 2000), along with the nearest-neighbour filaments (right)—all in the newly formed overlap zone after shortening. Hatched squares represent TnC units with bound Ca2+, moving the Tm away from the actin binding sites. Dark actin monomers (circles) are uncovered by Tm and exposed to cross-bridge binding and light actin monomers are not exposed to cross-bridge binding. With Ca2+ activation, the Tm in the newly overlap zone covers most of the actin-binding sites. With MgADP activation, cross-bridges are strongly bound to actin (dark oval), opening the possibility for new cross-bridges attachment to actin (hatched oval). (c) As a result of more cross-bridge attachment to actin, MgADP activation produces more force at a given SL when compared with Ca2+ activation, causing a leftward shift in the dynamic FL relation.
MgADP competes with MgATP for the myosin-binding site, thereby inducing strong binding of cross-bridges to actin. Strongly bound cross-bridges cause conformational changes of the thin filaments that may enhance Pi release and/or other step(s) of isomerization of the AM–ADP–Pi complex. The MgADP activation through strongly bound cross-bridges is a positive, cooperative process. Studies performed in solution with reconstituted filaments show that binding of myosin cross-bridges to the actin filament induces the binding of adjacent cross-bridges (Bremel & Weber 1972; Greene & Eisenberg 1980). Furthermore, the myofilament lattice is compressed when the number of strongly bound cross-bridges increases upon muscle activation (Brenner & Yu 1985), approximating thick and thin filaments and increasing the probability of cross-bridge attachment to actin. Finally, the rigidity of the actin filament is likely to be reduced upon binding of myosin cross-bridges (Yanagida et al. 1984), which would release the stress caused by activation.
We proposed that the main difference in the shortening-induced force depression when muscles are activated by Ca2+ or MgADP is the myosin–actin binding probability. In Ca2+-activated muscles, the new overlap zone formed during shortening is inhibited owing to actin filament stress and misalignment of myosin binding sites. When myofibrils are activated with continuous flow of MgADP, the strong binding of cross-bridges that are responsible for cooperativity will be enhanced while decreasing the lattice spacing and the rigidity of the actin filaments. The newly formed overlap zone is then better aligned for myosin binding. If the mechanism is correct, force enhancement should not be changed when muscles are activated with MgADP, as observed in our experiments—there is no evidence that stretch during activation changes the myosin binding probability. Force enhancement may be related to an increase in the number of cross-bridges attached to actin that is independent of the mode of activation, a hypothesis not tested in the current study.
(d). Summary and limitations
The force produced by skeletal muscle myofibrils is clearly affected by the history of contraction: consecutive stretches lead to force enhancement and consecutive shortenings lead to force depression. Our data indicate that force depression is directly linked to changes in the properties of myosin–actin attachment, such that shortening causes an inhibition of myosin-binding probability that decreases the force produced by the muscles. The major limitation of this study was that myofibrils did not contract exactly at the same SLs throughout the different protocols. Such difficulty depicts the challenge of working on the ascending limb of the FL relation—sarcomere shortening is not easily predicted, and changes in SL induced by changes in myofibril length may vary considerably. We surpassed this difficulty adjusting the ANCOVA analysis using SL changes as covariates, a procedure used in similar datasets in which independent variables will change continuously. We are currently developing a system to control the SL isometric through a feedback system, and in the near future, we intend to perform experiments in which the amount of sarcomere shortening can be controlled. Although the current experiments do not allow control of SL, they resemble closely physiological situations, in which there is no feedback control of sarcomere shortening, and thus may have physiological implications.
Acknowledgements
This study was supported by the ‘Canadian Institutes of Health Research’. C.P. is supported by the ‘Natural Sciences and Engineering Research Council’ of Canada. D.R. is supported by ‘Fonds de la Recherche en Santé du Quebec’ of Canada.
References
- Abbot B. C., Aubert X.1952The force exerted by active striated muscle during and after change of length. J. Physiol. 117, 77–86 [PMC free article] [PubMed] [Google Scholar]
- Ayittey P. N., Walker J. S., Rice J. J., de Tombe P. P.2009Glass microneedles for force measurements: a finite-element analysis model. Pflugers Arch. 457, 1415–1422 (doi:10.1007/s00424-008-0605-3) [DOI] [PMC free article] [PubMed] [Google Scholar]
- Bremel R. D., Weber A.1972Cooperation within actin filament in vertebrate skeletal muscle. Nat. New Biol. 238, 97–101 [DOI] [PubMed] [Google Scholar]
- Brenner B., Yu L. C.1985Equatorial x-ray diffraction from single skinned rabbit psoas fibers at various degrees of activation. Changes in intensities and lattice spacing. Biophys. J. 48, 829–834 (doi:10.1016/S0006-3495(85)83841-8) [DOI] [PMC free article] [PubMed] [Google Scholar]
- Daniel T. L., Trimble A. C., Chase P. B.1998Compliant realignment of binding sites in muscle: transient behavior and mechanical tuning. Biophys. J. 74, 1611–1621 (doi:10.1016/S0006-3495(98)77875-0) [DOI] [PMC free article] [PubMed] [Google Scholar]
- de Tombe P. P., Belus A., Piroddi N., Scellini B., Walker J. S., Martin A. F., Tesi C., Poggesi C.2007Myofilament calcium sensitivity does not affect cross-bridge activation–relaxation kinetics. Am. J. Physiol. Regul. Integr. Comp. Physiol. 292, R1129–R1136 [DOI] [PubMed] [Google Scholar]
- Edman K. A., Reggiani C.1984Redistribution of sarcomere length during isometric contraction of frog muscle fibres and its relation to tension creep. J. Physiol. 351, 169–198 [DOI] [PMC free article] [PubMed] [Google Scholar]
- Edman K. A., Caputo C., Lou F.1993Depression of tetanic force induced by loaded shortening of frog muscle fibres. J. Physiol. 466, 535–552 [PMC free article] [PubMed] [Google Scholar]
- Fauver M. E., Dunaway D. L., Lilienfeld D. H., Craighead H. G., Pollack G. H.1998Microfabricated cantilevers for measurement of subcellular and molecular forces. IEEE Trans. Biomed. Eng. 45, 891–898 (doi:10.1109/10.686797) [DOI] [PubMed] [Google Scholar]
- Gordon A. M., Huxley A. F., Julian F. J.1966The variation in isometric tension with sarcomere length in vertebrate muscle fibres. J. Physiol. 184, 170–192 [DOI] [PMC free article] [PubMed] [Google Scholar]
- Gordon A. M., Homsher E., Regnier M.2000Regulation of contraction in striated muscle. Physiol. Rev. 80, 853–924 [DOI] [PubMed] [Google Scholar]
- Granzier H. L., Pollack G. H.1989Effect of active pre-shortening on isometric and isotonic performance of single frog muscle fibres. J. Physiol. 415, 299–327 [DOI] [PMC free article] [PubMed] [Google Scholar]
- Greene L. E., Eisenberg E.1980Cooperative binding of myosin subfragment-1 to the actin–troponin–tropomyosin complex. Proc. Natl Acad. Sci. USA 77, 2616–2620 (doi:10.1073/pnas.77.5.2616) [DOI] [PMC free article] [PubMed] [Google Scholar]
- Greene L. E., Williams D. L., Jr, Eisenberg E.1987Regulation of actomyosin ATPase activity by troponin–tropomyosin: effect of the binding of the myosin subfragment 1 (S-1). ATP complex. Proc. Natl Acad. Sci. USA 84, 3102–3106 (doi:10.1073/pnas.84.10.3102) [DOI] [PMC free article] [PubMed] [Google Scholar]
- Herzog W., Leonard T. R.1997Depression of cat soleus-forces following isokinetic shortening. J. Biomech. 30, 865–872 (doi:10.1016/S0021-9290(97)00046-8) [DOI] [PubMed] [Google Scholar]
- Herzog W., Leonard T. R., Wu J. Z.2000The relationship between force depression following shortening and mechanical work in skeletal muscle. J. Biomech. 33, 659–668 (doi:10.1016/S0021-9290(00)00008-7) [DOI] [PubMed] [Google Scholar]
- Huxley A. F.1957Muscle structure and theories of contraction. Prog. Biophys. Biophys. Chem. 7, 255–318 [PubMed] [Google Scholar]
- Huxley H., Hanson J.1954Changes in the cross-striations of muscle during contraction and stretch and their structural interpretation. Nature 173, 973–976 (doi:10.1038/173973a0) [DOI] [PubMed] [Google Scholar]
- Huxley A. F., Niedergerke R.1954Structural changes in muscle during contraction; interference microscopy of living muscle fibres. Nature 173, 971–973 (doi:10.1038/173971a0) [DOI] [PubMed] [Google Scholar]
- Joumaa V., Leonard T. R., Herzog W.2008Residual force enhancement in myofibrils and sarcomeres. Proc. Biol. Sci. 275, 1411–1419 (doi:10.1098/rspb.2008.0142) [DOI] [PMC free article] [PubMed] [Google Scholar]
- Julian F. J., Morgan D. L.1979The effect on tension of non-uniform distribution of length changes applied to frog muscle fibres. J. Physiol. 293, 379–392 [DOI] [PMC free article] [PubMed] [Google Scholar]
- Marechal G., Plaghki L.1979The deficit of the isometric tetanic tension redeveloped after a release of frog muscle at a constant velocity. J. Gen. Physiol. 73, 453–467 (doi:10.1085/jgp.73.4.453) [DOI] [PMC free article] [PubMed] [Google Scholar]
- Morgan D. L.1994An explanation for residual increased tension in striated muscle after stretch during contraction. Exp. Physiol. 79, 831–838 [DOI] [PubMed] [Google Scholar]
- Morgan D. L., Whitehead N. P., Wise A. K., Gregory J. E., Proske U.2000Tension changes in the cat soleus muscle following slow stretch or shortening of the contracting muscle. J. Physiol. 522, 503–513 (doi:10.1111/j.1469-7793.2000.t01-2-00503.x) [DOI] [PMC free article] [PubMed] [Google Scholar]
- Peterson D. R., Rassier D. E., Herzog W.2004Force enhancement in single skeletal muscle fibres on the ascending limb of the force–length relationship. J. Exp. Biol. 207, 2787–2791 (doi:10.1242/jeb.01095) [DOI] [PubMed] [Google Scholar]
- Pinniger G. J., Ranatunga K. W., Offer G. W.2006Crossbridge and non-crossbridge contributions to tension in lengthening rat muscle: force-induced reversal of the power stroke. J. Physiol. 573, 627–643 (doi:10.1113/jphysiol.2005.095448) [DOI] [PMC free article] [PubMed] [Google Scholar]
- Rassier D. E.2008Pre-power stroke cross bridges contribute to force during stretch of skeletal muscle myofibrils. Proc. Biol. Sci. 275, 2577–2586 (doi:10.1098/rspb.2008.0719) [DOI] [PMC free article] [PubMed] [Google Scholar]
- Rassier D. E., Herzog W.2004Considerations on the history dependence of muscle contraction. J. Appl. Physiol. 96, 419–427 (doi:10.1152/japplphysiol.00653.2003) [DOI] [PubMed] [Google Scholar]
- Rassier D. E., Herzog W., Pollack G. H.2003aDynamics of individual sarcomeres during and after stretch in activated single myofibrils. Proc. Biol. Sci. 270, 1735–1740 (doi:10.1098/rspb.2003.2418) [DOI] [PMC free article] [PubMed] [Google Scholar]
- Rassier D. E., Herzog W., Pollack G. H.2003bStretch-induced force enhancement and stability of skeletal muscle myofibrils. Adv. Exp. Med. Biol. 538, 501–515 [DOI] [PubMed] [Google Scholar]
- Roots H., Offer G. W., Ranatunga K. W.2007Comparison of the tension responses to ramp shortening and lengthening in intact mammalian muscle fibres: crossbridge and non-crossbridge contributions. J. Muscle Res. Cell Motil. 28, 123–139 (doi:10.1007/s10974-007-9110-0) [DOI] [PubMed] [Google Scholar]
- Shimamoto Y., Kono F., Suzuki M., Ishiwata S.2007Nonlinear force–length relationship in the ADP-induced contraction of skeletal myofibrils. Biophys. J. 93, 4330–4341 (doi:10.1529/biophysj.107.110650) [DOI] [PMC free article] [PubMed] [Google Scholar]
- Sokolov S. Y., Grinko A. A., Tourovskaia A. V., Reitz F. B., Yakovenko O., Pollack G. H., Blyakhman F. A.2003‘Minimum average risk’ as a new peak-detection algorithm applied to myofibrillar dynamics. Comput. Methods Programs Biomed. 72, 21–26 (doi:10.1016/S0169-2607(02)00114-1) [DOI] [PubMed] [Google Scholar]
- Sosa H., Popp D., Ouyang G., Huxley H. E.1994Ultrastructure of skeletal muscle fibers studied by a plunge quick freezing method: myofilament lengths. Biophys. J. 67, 283–292 (doi:10.1016/S0006-3495(94)80479-5) [DOI] [PMC free article] [PubMed] [Google Scholar]
- Sugi H., Tsuchiya T.1988Stiffness changes during enhancement and deficit of isometric force by slow length changes in frog skeletal muscle fibres. J. Physiol. 407, 215–229 [DOI] [PMC free article] [PubMed] [Google Scholar]
- Telley I. A., Denoth J., Stussi E., Pfitzer G., Stehle R.2006aHalf-sarcomere dynamics in myofibrils during activation and relaxation studied by tracking fluorescent markers. Biophys. J. 90, 514–530 (doi:10.1529/biophysj.105.070334) [DOI] [PMC free article] [PubMed] [Google Scholar]
- Telley I. A., Stehle R., Ranatunga K. W., Pfitzer G., Stussi E., Denoth J.2006bDynamic behaviour of half-sarcomeres during and after stretch in activated rabbit psoas myofibrils: sarcomere asymmetry but no ‘sarcomere popping'. J. Physiol. 573, 173–185 (doi:10.1113/jphysiol.2006.105809) [DOI] [PMC free article] [PubMed] [Google Scholar]
- Yanagida T., Nakase M., Nishiyama K., Oosawa F.1984Direct observation of motion of single F-actin filaments in the presence of myosin. Nature 307, 58–60 (doi:10.1038/307058a0) [DOI] [PubMed] [Google Scholar]
- Zhang D., Yancey K. W., Swartz D. R.2000Influence of ADP on cross-bridge-dependent activation of myofibrillar thin filaments. Biophys. J. 78, 3103–3111 (doi:10.1016/S0006-3495(00)76847-0) [DOI] [PMC free article] [PubMed] [Google Scholar]


