Abstract
The largest perturbation on upper trophic levels of many marine ecosystems stems from fishing. The reaction of the ecosystem goes beyond the trophic levels directly targeted by the fishery. This reaction has been described either as a change in slope of the overall size spectrum or as a trophic cascade triggered by the removal of top predators. Here we use a novel size- and trait-based model to explore how marine ecosystems might react to perturbations from different types of fishing pressure. The model explicitly resolves the whole life history of fish, from larvae to adults. The results show that fishing does not change the overall slope of the size spectrum, but depletes the largest individuals and induces trophic cascades. A trophic cascade can propagate both up and down in trophic levels driven by a combination of changes in predation mortality and food limitation. The cascade is damped as it comes further away from the perturbed trophic level. Fishing on several trophic levels leads to a disappearance of the signature of the trophic cascade. Differences in fishing patterns among ecosystems might influence whether a trophic cascade is observed.
Keywords: size spectrum, community model, ecosystem approach to fisheries management
Trophic cascades are the signature of indirect effects of changes in the abundance of individuals in one trophic level on other trophic levels (Pace et al. 1999). Trophic cascades can occur when the abundance of a top predator is decreased, releasing the trophic level below from predation. The released trophic level reacts by an increase in abundance, which imposes an increased predation pressure on the next lower trophic level, etc. In the case of marine systems the outside perturbation typically stems from fishing, which can easily exceed the ‘natural’ predation mortality. Trophic cascades had not been thought to occur in marine systems (Steele 1998), but recently trophic cascades have been demonstrated in several large marine systems: the Black Sea (Daskalov et al. 2007), the Baltic Sea (Casini et al. 2008; Möllmann et al. 2008) and parts of the Northwest Atlantic (Frank et al. 2005, 2006; Myers et al. 2007). These trophic cascades cover up to four trophic levels and reach all the way down to primary production. Despite the evidence for trophic cascades in some systems, trophic cascades appear to be absent in other systems, even though they are heavily perturbed by fishing—in particular, the North Sea (Reid et al. 2000). The presence or absence of trophic cascades can be attributed to high temperature (which leads to faster growth rates and therefore less sensitivity to fishing) or to a large diversity that stabilizes the system (Frank et al. 2007).
Trophic cascades emanating from perturbations on top predators have been described using simple box-type models, with each box representing a species at a given trophic level (May et al. 1979; Daskalov 2002). Box-type models do not account for the special life history of fish, where an individual can cover several trophic levels from the larval stage at around 1 mg to maturation at 10 g to 50 kg depending on the species (Werner & Gilliam 1984). This ontogenetic development can be resolved either using stage-structured models (de Roos et al. 2008a) or size-structured models of each species (Hall et al. 2006; Pope et al. 2006). Here we apply a novel size- and trait-based model that is able to account for the change in trophic level during ontogeny and is readily applicable to study the effects of a size-based fishing mortality.
The model is an extension of general size- and trait-based models of marine ecosystems (Andersen & Beyer 2006; Pope et al. 2006). The model is mathematically complex, but based on simple ecological assumptions. The governing principle is that large fish eat smaller fish (Ursin 1973; Cohen et al. 1993; Jennings et al. 2002). This rule combined with a standard bioenergetic budget determines both the growth of individuals and the corresponding predation mortality on the smaller prey. Prey can be either fish in the community or zooplankton, which is modelled as an external resource. Model parameterization is based on general size-based scalings of search rate, ingestion, standard metabolism and mortality. The model does not resolve specific species, but represents life-history diversity through the distribution of individuals with a given individual and asymptotic (maximum) size. The model is used to investigate the effect of fishing on individuals within a given size range or within a range of asymptotic sizes.
Three fishing scenarios are simulated: (i) a consumer fishery targeting individuals larger than 1 kg; (ii) an industrial fishery targeting smaller forage fish species; and (iii) a fully developed fishery targeting fish of all sizes.
1. Model formulation
The model is a dynamical version of the ‘charmingly simple model’ by Pope et al. (2006), based on the principles of classical multi-species fishery models (Andersen & Ursin 1977) and community size spectrum models (Benoît & Rochet 2004). The model is extended to include food-dependent growth and a theoretical justification for the stock recruitment relation. The model is formulated using processes at the individual level that make it possible to estimate most parameters using the physiology of individual fish and scaling relations with individual size m or asymptotic (maximum) size M. The equations in the model are given in table 1.
Table 1.
Model equations. m is individual weight, and M is asymptotic (maximum) size.
| community size spectrum |  |
(M1) |
| size selection of food items |  |
(M2) |
| volumetric search rate |  |
(M3) |
| encountered food |  |
(M4) |
| feeding level |  |
(M5) |
| maximum consumption |  |
(M6) |
| allocation to reproduction |  |
(M7) |
| somatic growth |  |
(M8) |
| predation mortality |  |
(M9) |
| background mortality |  |
(M10) |
| resource spectrum |  |
(M11) |
| resource carrying capacity |  |
(M12) |
The two central assumptions of the model are (i) that food is selected on the basis of the size difference between individuals and is therefore not dependent upon species identity, and (ii) that the most important trait of a fish species is its asymptotic size M. The model is therefore not a traditional food-web model where species are represented explicitly, but rather a trait-based model (Norberg et al. 2001) with the trait being asymptotic size. The trait dimension is split into discrete asymptotic size classes. The result of the model is the size distribution of each asymptotic size class Ni(m) measured in units of number per volume per mass. The number of individuals in the size range [m, m + dm] and asymptotic size range [Mi, Mi+1] is therefore Ni(m) dm. The dynamics of the spectrum of asymptotic size class i is governed by the conservation equation (McKendrick 1926; von Foerster 1959):
| 1.1 |
where gi(m) and μi(m) are the somatic growth and the total mortality of an individual of size m, respectively. The central processes of growth and mortality are prescribed at the level of individuals, and integrated up to the population level using equation (1.1). In this manner the need for explicit individual-based simulations is bypassed.
Encounter of food (M4) is modelled by a classical formulation where food is selected from the community spectrum (M1) by a log-normal size preference function (M2) with a fixed preferred predator–prey mass ratio β (Ursin 1973; Andersen & Ursin 1977). Consumption is determined by a Holling type-II functional response (M5).
Somatic growth is modelled by a standard bioenergetic model. Consumed food is assimilated with an efficiency α and used for standard metabolism ks wp. The remaining energy is split between somatic growth and reproduction by a function ψ(m) that switches from 0 to 1 around the size of maturation (M7–8; Pedersen et al. submitted). This formulation leads to von Bertalanffy-like growth curves when food conditions are constant and independent of size, and a constant mass-specific allocation to gonads once the individual is mature.
Mortality comes from predation (M9) and a background mortality accounting for mortality not arising from predation or fishing (M10).
The resource spectrum is modelled dynamically using a semi-chemostat growth equation with allometric scaling of the regeneration rate (M11) and a carrying capacity given by the theoretical equilibrium spectrum (M12; Andersen & Beyer 2006).
Recruitment is ‘hockey-stick’ such that the number density at the size of recruitment m0 is determined by the egg production of the ith asymptotic size class, limited by an upper level N0.i. The upper level is calculated using equilibrium size spectrum theory for an unexploited system (Andersen & Beyer 2006; appendix A).
The conservation equation (1.1) is discretized by a standard first order in time and semi-implicit upwind finite differences scheme (Press et al. 1992). The individual size axis is discretized with 100 size groups. Asymptotic size is discretized with 20 asymptotic size classes in the range 10 g to 100 kg. The time step is 0.02 years. It has been checked that the results do not depend on the discretization of mass, time or the number of asymptotic size classes used. After around 50 years of integration the solutions converge to a dynamical steady state regardless of initial conditions.
2. Model analysis
The use of scaling based on individual and asymptotic size make the number of governing parameters in the model relatively small. Most are determined from basic physiological scaling relations or cross-species analyses of fish communities (table 2). Three related parameters are the coefficients of maximum consumption h, search rate γ and carrying capacity of the resource spectrum κr. Taken together these parameters determine the feeding level (M6; functional response) of small individuals who only feed from the resource spectrum. Assuming that the resource spectrum is at the carrying capacity, the value of γ can be determined from h and κr as
| 2.1 |
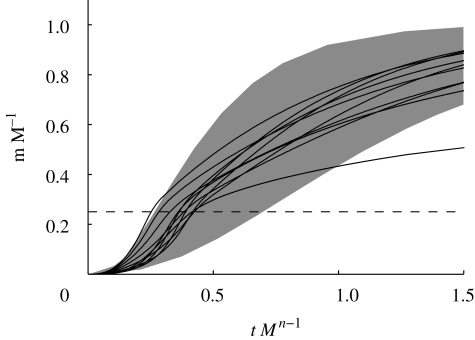
where  (Andersen & Beyer 2006) and f0 ≈ 0.5 is the expected average feeding level. In this manner the effective fundamental parameters are reduced to the prey selection parameters β and σ together with h and κr. The latter two parameters effectively work as scaling parameters, scaling time and abundances. They are therefore not important for the qualitative dynamics of the model, only for making the dynamics occur on the right time scale and ensuring the abundances are in the correct order of magnitude. Getting the timescale reasonably correct is important to compare levels of fishing mortality used in the model with realistic levels, and getting the abundances right matters for getting yield estimates in the correct order of magnitude. Runs of the model lead to growth curves roughly equal to expected von Bertalanffy growth curves, confirming that the time scale is in the right range (figure 1).
Table 2.
Parameters in the model. Time is expressed in years, weight in grams, and biomass density in grams per unit volume.
| individual physiology | ||
| α | 0.6 | assimilation efficiencya |
| n |  |
exponent of max. intakeb |
| h | 30 | factor for max. intakec |
| p |  |
exponent of standard metabolismd |
| ks | 4 | factor for standard metabolisme |
| μ0 | 0.6 | background mortality factorf |
| η | 0.25 | size at maturation rel. to Mg |
| individual foraging | ||
| β | 100 | preferred predator–prey weight ratioh |
| σ | 1.3 | width of selection functioni |
| γ | 526 | factor for search volumej |
| q | 0.9 | exponent of search volumek |
| primary production | ||
| κr | 0.005 | resource spectrum carrying capacity |
| r0 | 4 | growth rate of resource spectruml |
bJobling (1994) states that  . We have used n=
  to be consistent with von Bertalanffy growth curves.
cAdjusted such that emergent growth rates are in the range of those observed in the North Sea (figure 1).
eThe data of Winberg (1956) indicate a standard (resting) metabolism factor for fish of about 4 g0.25 yr−1 at 10°C.
fThis has been adjusted to lead to a background mortality of the same order as the predation mortality, but still lower than the predation mortality.
iUrsin (1973) finds σ = 1 for a single species. To account for species diversity within an asymptotic size class, this has been increased to σ = 1.3.
jSee equation (2.1).
kConsiderations on the bioenergetic budget of swimming predict a value of q between  and 1 (Andersen & Beyer 2006).
lSavage et al. (2004; temperature: 10°C).
Figure 1.
Growth curves of 10 asymptotic size classes with varying asymptotic sizes (thin lines) together with expected range of von Bertalanffy growth curves in the North Sea (grey patch). The thin dashed line is the size at maturation. Weight is normalized by the asymptotic size M and age t is normalized by the expected life time ∝ M1−n. The data from the North Sea are calculated using growth curves with von Bertalanffy growth rates KL∞ within ± 1 s.d. of the mean growth of the species listed in Gislason et al. (2008).
3. Results
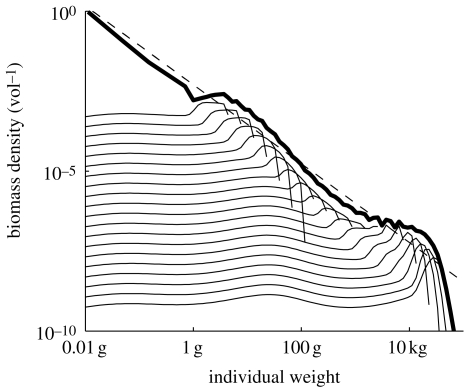
The starting point is an unexploited system represented by asymptotic size classes with asymptotic sizes from 4 g to 100 kg (figure 2). Each of these spectra represents the abundance of all species with asymptotic size within the corresponding asymptotic size class. The community spectrum is the sum of all asymptotic size classes. The community spectrum oscillates around the theoretically expected spectrum, which is a straight line on a log–log scale (Andersen & Beyer 2006). The oscillation is induced by the largest individuals that are not affected by predation and that therefore have a larger abundance than expected in a theoretical, infinitely large, spectrum. This oscillation is not crucial for the general reaction of the system to fishing.
Figure 2.
Biomass spectra of 20 asymptotic size classes in an unexploited ecosystem (thin lines) and community spectrum including the resource (thick line). The theoretically expected total spectrum from equilibrium size spectrum theory is the carrying capacity for the resource spectrum (dashed line).
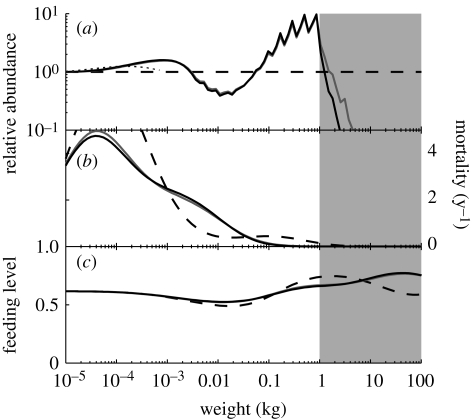
Fishing on large fish is the natural starting point for exploitation of a marine system, as the largest fish typically return the highest price per kilo (figure 3a). The fishing pressure lowers the abundance of the large fish, but the abundance in the lower part of the fished range actually increases. Due to the reduction in predation mortality (figure 3b), the abundance of individuals in the size range below the fished range increases substantially. That increase in abundance leads to an increase in the predation pressure further down in the size range among the smallest fishes and the juveniles of the larger fishes. The increase in abundance of fish in some ranges is not only due to a release from predation pressure, but is also due to changes in food availability and thus growth of individuals (figure 3c). As the increased population exerts a larger predation pressure on its prey population, the prey population diminishes, leading to food limitation on the predators. Lower growth rates mean that the individuals are growing more slowly out of their size range, and individuals therefore ‘pile up’ within the size range with slower-than-average growth, thus further exacerbating the increase in abundance and the predation pressure on their prey. The lowering of growth rates is also the effect partly responsible for the increase in abundance in the lower end of the fished range. The opposite effect occurs among individuals in size ranges with decreased abundance. As the abundance of their prey is increased these individuals experience increased growth rates and are thus growing more quickly out of their size ranges. The oscillations in the cascade are therefore created by a combination of the changes in predation pressure and food limitation. The end result is a trophic cascade that extends all the way into the resource spectrum representing zooplankton, where it is finally dissipated. As the oscillations are diminishing in magnitude the further they are away from the fished range, the cascade is a damped trophic cascade.
Figure 3.
The unexploited system from figure 2 (dashed lines) compared to systems with fishing mortality on fish larger than 1 kg (grey patches). Fishing mortality is 0.5 yr−1 (grey line) and 1 yr−1 (black line). (a) Abundance in the fished spectrum relative to abundance in the unexploited spectrum Nc(F)/Nc(F = 0) for fish (solid lines) and resource (dotted lines), (b) predation mortality and (c) feeding level.
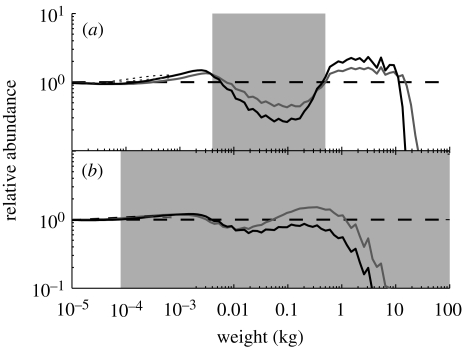
If the largest fish have been removed from the system by fishing, the fishery targets the intermediate size range. The fishery on the intermediately sized species might also have become more profitable due to the increase in abundance brought about by the release from predation by the larger species. This ‘fishing down the food web’ goes on until fish of all asymptotic sizes are being exploited (Pauly et al. 1998). We have used the description of an ecosystem-wide fishing mortality by Pope et al. (2006), inspired by the fishing pattern in the North Sea. This fishing pattern targets individuals larger than a fraction of their asymptotic size with a fishing mortality that is slightly larger for small than for large species. The result of the ecosystem-wide fishing is that the trophic cascades almost disappear and the spectrum looks like the unexploited case, except that the largest fish are now completely removed, a state that reflects that of the North Sea today (figure 4b).
Figure 4.
Comparison between the unexploited system from figure 2 (dashed lines) and one with industrial fishing on life histories with (a) an asymptotic size smaller than 0.5 kg, or (b) ecosystem-wide fishing. Solid lines: normalized size spectra: Nc(F)/Nc(F = 0); dotted lines: resource. Fishing mortality is 0.35 yr−1 (grey lines) and 0.70 yr−1 (black lines).
Industrial fishing targets the small zooplanktivorous species that are typically used for fishmeal production. This fishing pattern is represented in the model by a fishing mortality that acts only on asymptotic size classes with small asymptotic size (figure 4a). Industrial fishing naturally lowers the abundance of small fish, but not to the same degree that large fish were lowered by the same amount of fishing mortality. This is because predation mortality on small fish is already high, so the relative effect of fishing is smaller. The depletion of smaller fishes affects the availability of food for their predators, which, as a consequence, experience lowered growth rates, which again leads to an increase in the abundance of intermediate to large-sized fish. In this example, fishing again triggered a trophic cascade, but now in both directions. The cascade upwards is driven by the lack of food for the predators leading to smaller realized maximum sizes. The mechanism for the cascade downwards is similar to that from fishing on large fish, namely through the combination of predation mortality and food limitation.
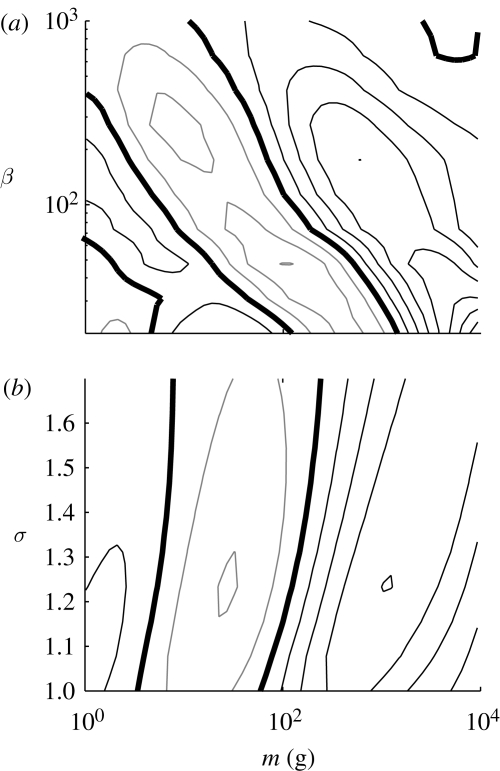
The length (in mass space) and the damping of the cascade depends on the parameters describing the prey preference selection: preferred predator–prey mass ratio β and width σ (figure 5). Qualitatively β determines the relation between trophic level and size, while σ controls the degree of smoothing of differences between trophic levels. The distance from the point of exploitation (10 kg) to the next trough indeed scales roughly with β, but the distance from the trough to the peak is apparently independent of β. Increasing σ weakens the cascade, but does not change the wavelength.
Figure 5.
The influence of (a) β and (b) σ on the cascades initiated by a fishing pressure on individuals larger than 10 kg. The contour lines depict the log of Nc(fished)/Nc(unfished), with the thick line being the zero contour line (no impact of fishing), and black and grey contour lines being positive and negative impact respectively. The distance between the contour lines is 0.1.
4. Discussion
The model simulations demonstrate how fishing has the potential to trigger damped trophic cascades both up and down in trophic levels. The downward cascades are driven by changes in predation mortality and enhanced by food limitation. The fluctuations in abundance diminish with distance from the fished size range. This means that even if the impact of fishing on the largest fish can be seen in the plankton spectrum, the disturbance is expected to be small. Trophic cascades can also propagate upwards from industrial fishing in the middle of the size spectrum. This increase in abundance of the smallest fish species is expected to lead to an increase in abundance of intermediate-sized predators, but a decrease in productivity of the largest fish. A fully developed fishery with fishing on all trophic levels removes the oscillation that is a signature of the trophic cascade. The dependence of the signature of the cascade on fishing pattern may play a role in why trophic cascades are observed in some systems but not in others (Frank et al. 2005, 2007); for example, cascades have not been found in the North Sea (Reid et al. 2000), which has a well-developed industrial fishery, but have been observed in the northwest Atlantic, where fishery for fishmeal is not allowed. The differences in growth rates between unexploited and fished systems was remarkably small (figure 3c), lending support to the use of community models with fixed growth (Lewy & Vinther 2004; Hall et al. 2006; Pope et al. 2006).
Empirical studies have pointed to two aspects of marine ecosystems that may influence the potential cascading effects of fishing, namely species diversity and temperature (Frank et al. 2007). Systems with large species diversity are expected to have a high degree of redundancy of ecological function between species. Therefore if some species are depleted, either by fishing or by increased predation pressure, other species will be able to occupy their niche and consequently avoid or dampen a trophic cascade. As the present size spectrum model is trait- and not species-based, it is not able to deal explicitly with the effects of diversity. In this respect the model therefore represents a species-poor system (like the Baltic Sea or the Barents Sea) or a species-rich system where all species of a given trophic level are exploited (like the North Sea). An examination of the influence of diversity may be done by including a specific food web in the model and performing a community viability analysis (Ebenman et al. 2004). Describing the effects of diversity therefore requires knowledge of the interaction matrix for the specific system, or at least the statistical properties of interaction matrices in marine systems. An alternative to the explicit food web is to introduce a higher dimensional trait space (Savage et al. 2007).
Temperature affects the system either through a correlation between temperature and diversity (higher diversity in warm than in cold systems) or through the direct influence of temperature on physiological rates. The latter can be implemented in the model by a scaling of the physiological rates with temperature by a Q10 of about 1.8 (Clarke & Johnston 1999). The most important physiological parameter in the model is the factor for maximum consumption rate h. Scaling h with temperature effectively leads to a relation between the timescale of the dynamics and temperature. Thus, in the model, an increase of 10°C leads to roughly twice as large growth rates and productivity, and consequently the ability to tolerate twice as high fishing mortality. Temperature in itself is therefore expected to make warm systems more resilient to a given fishing mortality than cold systems, but the qualitative effects (e.g. cascades) remain the same.
The results of the size spectrum model suggest that marine ecosystems possess a mechanism for damping trophic cascades independently of the buffering effects of species diversity. This ‘trophic damping’ is an inherent feature of the trophic transfer of energy through predation and food-dependent growth of individuals. The damping was quantified as the change in the deviation of abundance induced by fishing between two trophic levels. The trophic damping was found to be about 50 per cent per trophic level. Measuring the damping of a trophic cascade from empirical data is difficult, as results of absolute densities have to be compared between different gears with different catchabilities. Existing empirical data gives different indications about the trophic damping. In the northwest Atlantic a halving of cod biomass resulted in a modest increase in large zooplankton, indicating a strong damping (Frank et al. 2005). On the other hand, analysis of data from the Baltic indicates almost no damping of the trophic cascade (Casini et al. 2008).
The degree of trophic damping depends on the parameters of the prey size selection function, in particular on the width of the size selection function σ. Systems dominated by species with a large trophic breadth in their diet are expected to have strongly damped trophic cascades. A systematic variation of the trophic diet breadth with size may also influence how far a trophic cascade can propagate down the size spectrum. To our knowledge, analysis of the trophic breadth of individuals only exists for fish larvae in particular systems (Munk 1997; Østergaard et al. 2005), but a more systematic analysis may be carried out using larger data compilations (Barnes et al. 2008).
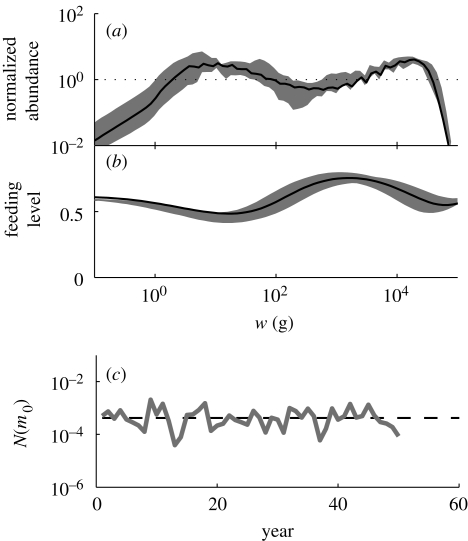
Environmental stochasticity influencing recruitment can be added to the stock–recruitment relationship (appendix A). It was found that noise did not influence the model appreciably, and, more importantly, that noise is not able to induce different stable states, as shown in, for example, the Baltic (Casini et al. 2009). The lack of different stable states is due to the use of a stock–recruitment relationship to stabilize the model. If recruitment is determined only by egg production, the model system would allow for different stable states (de Roos et al. 2008b; van Leeuwen et al. 2008), but would have difficulties with co-existence of species (van de Wolfshaar et al. 2006).
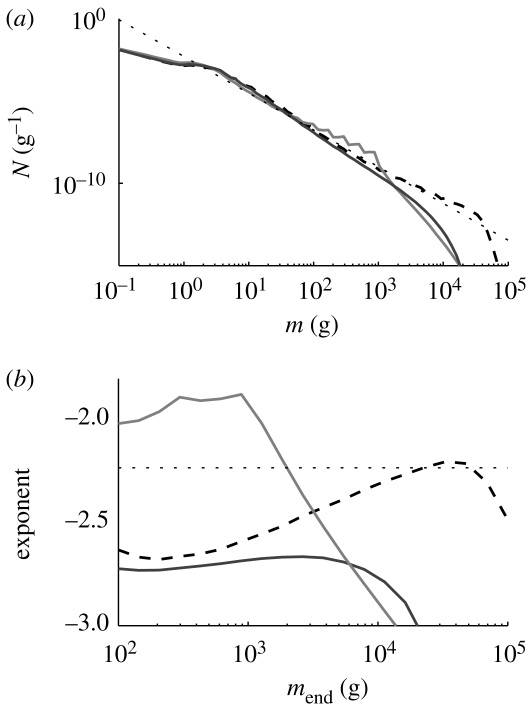
A commonly used indicator for the severity of ecosystem-wide fishing is the slope of the community size spectrum. Historical analyses of the size spectrum of the North Sea fish community demonstrate an increase in the slope (Rice & Gislason 1996; Daan et al. 2005), which has been linked to the disappearance of the largest fish, which in turn leads to an increase in the abundance of the smallest fish. A change in slope of the community size spectrum appears to be at odds with the prediction from the present model, where ecosystem-wide fishing does not change the overall slope of the size spectrum appreciably, but leads to the disappearance of large fish (figure 4b). The reason for the change in slope of the community spectrum found by data analysis may be the relatively small size range that is accessible by trawl surveys (10–100 cm). The surveys may therefore only reveal one oscillation in a trophic cascade, which appears as a change in the overall slope of the spectrum. If the line that is being fitted includes points among the disappearing large fish, or if the length of the oscillation is shorter than the fitted range, the fitting of a straight line to the size spectrum depends on details of how the fit is done (figure 6). The power law scaling of abundance with size in an ecosystem is a concept that is only borne out by observations if a size range larger than the oscillations around the ideal scaling is fitted (i.e. a size range several times larger than β). The solution employed in the analysis of the results from the model has been to focus on relative changes in the size composition. This method can be robustly employed in empirical analysis as well (Daan et al. 2005). An alternative to fitting a power law to determine a slope is to compare the abundance or biomass between two fixed size ranges (ICES 2007).
Figure 6.
Illustration of the influence of the upper size limit mend of data used for fitting a power law exponent to abundance size spectra. (a) The size spectra of the fish community for unexploited (dashed), large-fish fishing (light grey; figure 3) and ecosystem-wide fishing systems (dark grey; figure 4b). (b) Fitted exponent to abundances in the range from 10 g (approx. 10 cm) to mend. The dotted line is the theoretically expected exponent.
Figure 7.
Comparisons of results from the unexploited system without noise (black line, solid in (a,b) and dashed in (c)) and with stochastic recruitment, σξ = 1 (grey area). (a) Community spectra normalized with the theoretically expected spectrum Nc(m)w−2−q+n, (b) feeding level and (c) N(m0) for the asymptotic size class with M = 500 g as a function of time.
Acknowledgements
KHA acknowledges financial support from the EU programmes IMAGE and MEECE, and the ICES PWG for discussions. M.P. is supported by the Marie Curie Research Training Network FishACE through the European Community's 6th Framework Program (Contract MRTN-CT-2004-005578). We also acknowledge the helpful review of three anonymous reviewers.
Appendix A. Calculation of recruitment
Here the details of the calculation of the recruitment of the ith asymptotic size class Ni (m0) is given. The recruitment is calculated using a hockey-stick function:
| A 1 |
where Ri is the egg production, Ni.0 is the level of the flat part of the hockey-stick curve, gi(m0) is the somatic growth of larvae and ξ(t) is a stochastic component.
The egg production of an individual is found from the growth equation (M8) as gi.r (m) = ψ (m)(α f(m)Cmax − ksmp). Integrating over the whole population gives the total egg production and multiplying by a combined efficiency and egg survival factor ϵ = 0.01 gives Ri = ϵ∫gr Ni(m) dm/2.
The upper limit to recruitment is found using equilibrium size spectrum theory under the assumption that the feeding level is a constant f0 (Andersen & Beyer 2006). From this the abundance at recruitment is given as Ni(m0) = κ0 Mi2n−q−2+a/dMi, where a = (f0h)/(αf0h − ks)β2n−q−1 e(2n(q−1)−q2 + 1)σ2/2, dMi ∝ Mi is the width of the asymptotic size class, and κ0 is a measure of the abundance of the resource. The value of κ0 is adjusted such that the community spectrum formed by the spectra of the fish populations roughly forms a continuation of the resource spectrum (figure 2).
The stochastic term ξ (t) is log-normal distributed with a spread σξ, independently for each asymptotic size class, and the value is renewed each year. In the simulations presented in the main text of the article there is no noise (i.e. ξ = 1). This was because adding noise was found only to induce variation of abundances and feeding levels around the mean value of the system without noise (figure 7).
References
- Andersen K. H., Beyer J. E.2006Asymptotic size determines species abundance in the marine size spectrum. Am. Nat. 168, 54–61 (doi:10.1086/504849) [DOI] [PubMed] [Google Scholar]
- Andersen K. P., Ursin E.1977A multispecies extension to the Beverton and Holt theory of fishing, with accounts of phosphorus circulation and primary production. Meddelelser fra Danmarks Fiskeri- og Havundersøgelser 7, 319–435 [Google Scholar]
- Barnes C., et al. 2008Predator and prey body sizes in marine food webs. Ecology 89, 881 (doi:10.1890/07-1551.1) [Google Scholar]
- Benoît E., Rochet M.-J.2004A continuous model of biomass size spectra governed by predation and the effects of fishing on them. J. Theor. Biol. 226, 9–21 (doi:10.1016/S0022-5193(03)00290-X) [DOI] [PubMed] [Google Scholar]
- Beverton R. J. H.1992Patterns of reproductive strategy parameters in some marine teleost fishes. J. Fish Biol. 41, 137–160 (doi:10.1111/j.1095-8649.1992.tb03875.x) [Google Scholar]
- Casini M., Lövgren J., Hjelm J., Cardinale M., Molinero J.-C., Kornilovs G.2008Multi-level trophic cascades in a heavily exploited open marine ecosystem. Proc. R. Soc. B 275, 1793–1801 (doi:10.1098/rspb.2007.1752) [DOI] [PMC free article] [PubMed] [Google Scholar]
- Casini M., Hjelm J., Molinero J. C., Lövgren J., Cardinale M., Bartolino V., Belgrano A., Kornilovs G.2009Trophic cascades promote threshold-like shifts in pelagic marine ecosystems. Proc. Natl Acad. Sci. USA 106, 197 (doi:10.1073/pnas.0806649105) [DOI] [PMC free article] [PubMed] [Google Scholar]
- Clarke A., Johnston N. M.1999Scaling of metabolic rate with body mass and temperature in teleost fish. J. Anim. Ecol. 68, 893–905 (doi:10.1046/j.1365-2656.1999.00337.x) [DOI] [PubMed] [Google Scholar]
- Cohen J. E., Pimm S. L., Yodzis P., Saldaña J.1993Body sizes of animal predators and animal prey in food webs. J. Anim. Ecol. 62, 67–78 (doi:10.2307/5483) [Google Scholar]
- Daan N., Gislason H., Pope J. G., Rice J. C.2005Changes in the North Sea fish community: evidence of indirect effects of fishing? ICES J. Mar. Sci. 62, 177 (doi:10.1016/j.icesjms.2004.08.020) [Google Scholar]
- Daskalov G. M.2002Overfishing drives a trophic cascade in the Black Sea. Mar. Ecol. Prog. Ser. 225, 53–63 (doi:10.3354/meps225053) [Google Scholar]
- Daskalov G. M., Grishin A. N., Rodionov S., Mihneva V.2007Trophic cascades triggered by overfishing reveal possible mechanisms of ecosystem regime shifts. Proc. Natl Acad. Sci. USA 104, 10 518 (doi:10.1073/pnas.0701100104) [DOI] [PMC free article] [PubMed] [Google Scholar]
- de Roos A. M., Schellekens T., van Kooten T., van de Wolfshaar K., Claessen D., Persson L.2008aSimplifying a physiologically structured population model to a stage-structured biomass model. Theor. Popul. Biol. 73, 47–62 (doi:10.1016/j.tpb.2007.09.004) [DOI] [PubMed] [Google Scholar]
- de Roos A. M., Schellekens T., Van Kooten T., Persson L.2008bStage-specific predator species help each other to persist while competing for a single prey. Proc. Natl Acad. Sci. 105, 13 930–13 935 (doi:10.1073/pnas.0803834105) [DOI] [PMC free article] [PubMed] [Google Scholar]
- Ebenman B., Law R., Borrvall C.2004Community viability analysis: the response of ecological communities to species loss. Ecology 85, 2591–2600 (doi:10.1890/03-8018) [Google Scholar]
- Frank K. T., Petrie B., Choi J. S., Leggett W. C.2005Trophic cascades in a formerly cod-dominated ecosystem. Science 308, 1621–1623 (doi:10.1126/science.1113075) [DOI] [PubMed] [Google Scholar]
- Frank K. T., Petrie B., Shackell N. L., Choi J. S.2006Reconciling differences in trophic control in mid-latitude marine ecosystems. Ecol. Lett. 9, 1096–1105 (doi:10.1111/j.1461-0248.2006.00961.x) [DOI] [PubMed] [Google Scholar]
- Frank K. T., Petrie B., Shackell N. L.2007The ups and downs of trophic control in continental shelf ecosystems. Trends Ecol. & Evol. 22, 236–242 (doi:10.1016/j.tree.2007.03.002) [DOI] [PubMed] [Google Scholar]
- Gislason H., Pope J., Rice J., Daan N.2008Coexistence in North Sea fish communities—implications for growth and natural mortality. Mar. Ecol. Prog. Ser. 65, 514–530 [Google Scholar]
- Hall S. J., Collie J. S., Duplisea D. E., Jennings S., Bravington M., Link J.2006A length-based multispecies model for evaluating community responses to fishing. Can. J. Fish. Aquat. Sci. 63, 1344–1359 (doi:10.1139/F06-039) [Google Scholar]
- ICES 2007Report of the working group on ecosystem effects of fishing activities (WGECO). Technical report ICES CM 2007/ACE:04. Copenhagen, Denmark: International Council for the Exploration of the Sea
- Jennings S., Pinnegar J. K., Polunin N. V. C., Boon T. W.2001Weak cross-species relationships between body size and trophic level belie powerful size-based trophic structuring in fish communities. J. Anim. Ecol. 70, 934–944 (doi:10.1046/j.0021-8790.2001.00552.x) [Google Scholar]
- Jennings S., Warr K. J., Mackinson S.2002Use of size-based production and stable isotope analyses to predict trophic transfer efficiencies and predator–prey body mass ratios in food webs. Mar. Ecol. Prog. Ser. 240, 11–20 (doi:10.3354/meps240011) [Google Scholar]
- Jobling M.1994Fish bioenergetics Fish and Fisheries Series, no. 13 London, UK: Chapman & Hall [Google Scholar]
- Kitchell J. F., Stewart D. J., Weininger D.1977Applications of a bioenergetics model to yellow perch (Perca flavescens) and walleye (Stizostedion vitreum vitreum). J. Fish. Res. Board. Can. 34, 1922–1935 [Google Scholar]
- Lewy P., Vinther M.2004A stochastic age-length-structured multispecies model applied to North Sea stocks ICES document CM/FF:20, p. 33 [Google Scholar]
- May R. M., Beddington J. R., Clark C. W., Holt S. J., Laws R. M.1979Management of multispecies fisheries. Science 205, 267–277 (doi:10.1126/science.205.4403.267) [DOI] [PubMed] [Google Scholar]
- McKendrick A. G.1926Applications of mathematics to medical problems. Proc. Edinb., Math. Soc. 44, 98–130 (doi:10.1017/S0013091500034428) [Google Scholar]
- Möllmann C., Muller-Karulis B., Kornilovs G., St John M. A.2008Effects of climate and overfishing on zooplankton dynamics and ecosystem structure: regime shifts, trophic cascade, and feedback loops in a simple ecosystem. ICES J. Mar. Sci. 65, 302 (doi:10.1093/icesjms/fsm197) [Google Scholar]
- Munk P.1997Prey size spectra and prey availability of larval and small juvenile cod. J. Fish Biol. 51, 340–351 (doi:10.1111/j.1095-8649.1997.tb06107.x) [Google Scholar]
- Myers R. A., Baum J. K., Shepherd T. D., Powers S. P., Peterson C. H.2007Cascading effects of the loss of apex predatory sharks from a coastal ocean. Science 315, 1846 (doi:10.1126/science.1138657) [DOI] [PubMed] [Google Scholar]
- Norberg J., Swaney D. P., Dushoff J., Lin J., Casagrandi R., Levin S. A.2001Phenotypic diversity and ecosystem functioning in changing environments: a theoretical framework. Proc. Natl Acad. Sci. USA 98, 11 376–11 381 (doi:10.1073/pnas.171315998) [DOI] [PMC free article] [PubMed] [Google Scholar]
- Østergaard P., Munk P., Janekarn V.2005Contrasting feeding patterns among species of fish larvae from the tropical Andaman Sea. Mar. Biol. 146, 595–606 (doi:10.1007/s00227-004-1458-8) [Google Scholar]
- Pace M. L., Cole J. J., Carpenter S. R., Kitchell J. F.1999Trophic cascades revealed in diverse ecosystems. Trends Ecol. Evol. 14, 483–488 (doi:10.1016/S0169-5347(99)01723-1) [DOI] [PubMed] [Google Scholar]
- Pauly D., Christensen V., Dalsgaard J., Froese R., Torres F., Jr1998Fishing down marine food webs. Science 279, 860 (doi:10.1126/science.279.5352.860) [DOI] [PubMed] [Google Scholar]
- Pedersen M., Andersen K. H., Beyer J. E. Submitted. Food web framework for size-structured populations. [DOI] [PubMed]
- Pope J. G., Rice J. C., Daan N., Jennings S., Gislason H.2006Modelling an exploited marine fish community with 15 parameters—results from a simple size-based model. ICES J. Mar. Sci. 63, 1029–1044 [Google Scholar]
- Press W. H., Teukolsky S. A., Vetterling W. T., Flannery B. P.1992Numerical recipes in C, 2nd edn.Cambridge, UK: Cambridge University Press [Google Scholar]
- Reid P. C., Battle E. J. V., Batten S. D., Brander K. M.2000Impacts of fisheries on plankton community structure. ICES J. Mar. Sci. 57, 495–502 (doi:10.1006/jmsc.2000.0740) [Google Scholar]
- Rice J., Gislason H.1996Patterns of change in the size spectra of numbers and diversity of the North Sea fish assemblages, as reflected in surveys and models. ICES J. Mar. Sci. 53, 1214–1225 (doi:10.1006/jmsc.1996.0146) [Google Scholar]
- Savage V. M., Gillooly J. F., Brown J. H., West G. B., Charnov E. L.2004Effects of body size and temperature on population growth. Am. Nat. 163, 429–441 (doi:10.1086/381872) [DOI] [PubMed] [Google Scholar]
- Savage V. M., Webb C. T., Norberg J.2007A general multi-trait-based framework for studying the effects of biodiversity on ecosystem functioning. J. Theor. Biol. 247, 213–229 (doi:10.1016/j.jtbi.2007.03.007) [DOI] [PMC free article] [PubMed] [Google Scholar]
- Steele J. H.1998From carbon flux to regime shift. Fish. Oceanogr. 7, 176–181 (doi:10.1046/j.1365-2419.1998.00069.x) [Google Scholar]
- Ursin E.1973On the prey size preferences of cod and dab. Meddelelser fra Danmarks Fiskeri- og Havundersøgelser 7, 85–98 [Google Scholar]
- van de Wolfshaar K. E., de Roos A. M., Persson L.2006Size-dependent interactions inhibit coexistence in intraguild predation systems with life-history omnivory. Am. Nat. 168, 62–75 (doi:10.1086/505156) [DOI] [PubMed] [Google Scholar]
- van Leeuwen A., de Roos A. M., Persson L.2008How cod shapes its world. J. Sea Res. 60, 89–104 (doi:10.1016/j.seares.2008.02.008) [Google Scholar]
- von Foerster H.1959Some remarks on changing populations. In The kinetics of cellular proliferation (ed. Frederick S.), pp. 382–407 New York, NY: Grune & Stratton [Google Scholar]
- Werner E. E., Gilliam J. F.1984The ontogenetic niche and species interactions in size-structured populations. Annu. Rev. Ecol. Syst. 15, 393–425 (doi:10.1146/annurev.es.15.110184.002141) [Google Scholar]
- West G. B., Brown J. H., Enquist B. J.1997A general model for the origin of allometric scaling laws in biology. Science 276, 122–126 (doi:10.1126/science.276.5309.122) [DOI] [PubMed] [Google Scholar]
- Winberg G. G.1956Rate of metabolism and food requirements of fishes. J. Fish. Res. Board Can. 194, 1–253 [Google Scholar]


