

Abstract
It has been predicted that geometrically similar animals would swim at the same speed with stroke frequency scaling with mass−1/3. In the present study, morphological and behavioural data obtained from free-ranging penguins (seven species) were compared. Morphological measurements support the geometrical similarity. However, cruising speeds of 1.8–2.3 m s−1 were significantly related to mass0.08 and stroke frequencies were proportional to mass−0.29. These scaling relationships do not agree with the previous predictions for geometrically similar animals. We propose a theoretical model, considering metabolic cost, work against mechanical forces (drag and buoyancy), pitch angle and dive depth. This new model predicts that: (i) the optimal swim speed, which minimizes the energy cost of transport, is proportional to (basal metabolic rate/drag)1/3 independent of buoyancy, pitch angle and dive depth; (ii) the optimal speed is related to mass0.05; and (iii) stroke frequency is proportional to mass−0.28. The observed scaling relationships of penguins support these predictions, which suggest that breath-hold divers swam optimally to minimize the cost of transport, including mechanical and metabolic energy during dive.
Keywords: accelerometer, free ranging, morphology, isometric model, buoyancy, energy
1. Introduction
According to A. V. Hill's isometric model, the work that a muscle can produce is proportional to its mass, and the kinetic energy developed in a limb depends upon its mass and the square of its velocity (Hill 1950). Thus, geometrically similar animals are predicted to move their limbs at the same speed, and consequently run or swim at the same speed, with stride frequencies scaling with mass−1/3 (Hill 1950). It is difficult for terrestrial animals and flying birds to maintain geometrical similarity because body weight increases with cube of length, and force of the limbs or lift by the wings is proportional to the area (scaling with square of length) of the bone, muscle and wing (Schmidt-Nielsen 1984). However, body weights of aquatic animals are mostly supported by buoyancy of the surrounding water. Therefore, aquatic animals are ideal subjects for testing Hill's predictions where geometrical similarity is the critical assumption.
Quantitative observations under natural conditions indicated that free-ranging seabirds and mammals, which used specialized limbs for swimming, adopted cruising speeds of 1–2 m s−1 independent of body size ranging from 0.5 kg seabirds to 30 ton sperm whales, while dominant stroke cycle frequencies were proportional to mass−0.29 (Sato et al. 2007). These results seem to be close to the predictions for geometrically similar animals (Hill 1950). However, using data in the literature (Sato et al. 2007), the scaling exponent of the stroke frequency in relation to body mass is significantly different from −1/3 (reduced major axis estimation, n = 17, p < 0.0001). One of the reasons for this discrepancy might be attributed to the wide range of animals such as cormorants, penguins, seals and cetaceans used in the previous study (Sato et al. 2007), which may not follow the assumption of geometrical similarity. Second, swimming styles in these vertebrates range from paddling of hind legs in cormorants, wing propulsion in penguins, lateral undulation of paired hind flippers in phocid seals and dorsoventral undulation in cetaceans. Third, a possible factor to be considered is the effect of buoyancy. In the previous study (Sato et al. 2007), behavioural data obtained from negatively buoyant animals such as thin seals and positive buoyant seabirds were compared. These factors might cause the discrepancy between observed and predicted relationships.
Our aim was to clarify a fundamental principle governing the scaling relationship of swim speed and stroke frequency of aquatic animals. We developed a new biomechanical model that includes buoyancy, drag, thrust, pitch angle and dive depth. To test predictions based upon the new model, morphological and behavioural data of seven species of penguins (Spheniscidae) were compared. We first checked geometrical similarity. Then, we analysed mass dependency of mean swim speed and dominant stroke cycle frequency recorded under natural conditions. The results were compared with the previous and present theoretical predictions.
2. Material and methods
(a). Biomechanical model and new predictions
Hill (1950) did not include buoyancy, pitch angle and metabolic rates in his prediction, which can have significant influences on diving costs of marine animals. Therefore, we developed a new model that incorporates these parameters. When a penguin swims horizontally in an aquarium, orientation of the stroking plane is forward of the perpendicular plane of the long axis of the body. As a result, the thrust generated over the wing stroke cycle is directed forward and downward. The downward component of the thrust acts against the positive buoyancy and the forward component of the thrust acts against drag in a steady-state penguin. This situation is slightly modified in the case of a penguin descending under natural conditions (figure 1). Changes in swimming speed are determined by the component of the thrust parallel to the swimming direction, the drag against the swimming direction, and the component of the positive buoyancy parallel to the swimming path but backward in direction. Changes in the pitch angle are determined by the component of the thrust and positive buoyancy perpendicular to the swimming direction. These relationships are described by the following equations:
| 2.1 |
and
| 2.2 |
where m is the body mass (kg), U is the swim speed (m s−1), t is the time (s), T is the thrust (N) (T > 0, forward; T < 0, backward), D is the drag (N) (D > 0, backward; D < 0, forward), B − mg is the buoyancy (N) (B > 0, upward; B < 0, downward; (B − mg) > 0, positive buoyancy; (B − mg) < 0, negative buoyancy), g is the gravity acceleration (=9.8 m s−2), α is the angle of thrust (α < 0, downward; α > 0, upward) and β is the pitch angle of swimming direction (β < 0, descent; β > 0, ascent) (see table 1).
Figure 1.

Forces acting on a descending penguin with positive buoyancy. T, thrust; D, drag; B − mg, buoyancy; α, angle of thrust; β, pitch angle of swimming direction.
Table 1.
List of symbols.
| A0 | air volume (m3) at sea surface (1 atm) |
| B−mg | buoyancy (N) |
| CD | drag coefficient of gliding animals |
| Cv | cost to descend a unit vertical distance (J m−1) at a current depth v (m) |
| D | drag (N) |
| EV | mechanical energy (J) to transit from sea surface to a depth V (m) |
| F | dominant stroke cycle frequency (Hz = s−1) |
| g | gravity acceleration (= 9.8 m s−2) |
| GL | girth length (m) |
| k | basal metabolic rate (W) |
| L | body length (m) |
| m | body mass (kg) |
| MV | basal metabolic energy (J) |
| Re | the Reynolds number (=LU/ν) |
| S | wetted surface area (m2) |
| T | thrust (N) |
| t | time (s) |
| U | swim speed (m s−1) |
| Uopt | optimal swim speed (m s−1), which makes the mechanical plus metabolic cost minimum |
| V | dive depth (m) |
| v | current depth (m) |
| WA | wing area (m2) |
| WL | wing length (m) |
| α | angle of thrust |
| β | pitch angle of swimming direction |
| εp | the propeller efficiency with which muscular movements are translated into forward thrust |
| εA | the efficiency with which chemical energy is translated into muscular work |
| ρt | the density of the penguin tissue (= 1020 kg m−3) |
| ρw | the density of the seawater (= 1027 kg m−3) |
| ν | kinematic viscosity |
Usually swim speed and pitch angle of penguins remained constant during descent (Ropert-Coudert et al. 2001; Sato et al. 2002; Wilson et al. 2002). Assuming quasi-steady state dU/dt = 0 in equation (2.1) and dβ/dt = 0 in equation (2.2), we obtain the following equations:
| 2.3 |
and
| 2.4 |
Figure 1 depicts the balance of forces in a descending (β < 0) penguin with positive buoyancy (B – mg > 0).
The cost to descend a unit vertical distance Cv (J m−1) is the product of force along with the swimming direction and unit distance:
| 2.5 |
Substituting T cos(α − β) in equation (2.5) by equation (2.3), we obtain the following equation:
| 2.6 |
Integration of the cost per unit vertical distance Cv will give us an energy EV (J) to reach a depth V (m):
| 2.7 |
where v is the current depth (m). The energy EV is a function of the buoyancy, drag, pitch angle and dive depth. The buoyancy of marine animals is equal to the weight of sea water displacement minus the weight of the body. The sea water displacement is composed of volume of animal tissue m/ρt, where ρt (=1020 kg m−3) is the density of the tissue (Wilson et al. 1992), and air volume in the body  , where A0 is the air volume (m3) at sea surface (1 atm). The buoyancy can be expressed by the following equation:
| 2.8 |
where ρw is the density of the sea water (=1027 kg m−3). The drag can be expressed as follows:
| 2.9 |
where the constant λ is the ratio of the drag of an active swimmer to that of a passive object (Hind & Gurney 1997), CD is the drag coefficient of gliding animals, S is the wetted surface area (m2) and U is the swimming speed (m s−1). Substituting B − mg and D in equation (2.7) by equations (2.8) and (2.9), the energy cost to reach a depth V can be modified as:
 |
2.10 |
Figure 2a shows how the mechanical energy cost EV increases with swim speed (∝U2).
Figure 2.

(a) Effect of swim speed on mechanical energy, (b) descent duration, and (c) mechanical plus metabolic energy during descent to a depth V = 400 m under several pitch angles ranging from −90 to −10°. (a) The mechanical energy and (c) the metabolic plus mechanical energy were calculated by equations (2.10) and (2.13), respectively. Other parameters were set as follows: A0 = 4 l, m = 30 kg, λ = 0.576, εp = 0.85, εA = 0.17, CD = 0.003, S = 0.68 m2 (Clark & Bemis 1979; Hind & Gurney 1997), for a specific case of an emperor penguin. Pitch angle: red lines, −90°; orange lines, −70°; dark blue lines, −50°; light blue lines, −30°; green lines, −10°.
The above calculation includes only mechanical energy for vertical transit. We should also consider basal metabolic energy MV during descent. The basal metabolic energy is the product of metabolic rate and time. As indicated in figure 2b, the time duration to reach a depth V is affected by swim speed U and pitch angle β. Basal metabolic rate k (W) was calculated using the following equation modified from a previous paper (McKechnie et al. 2006):
| 2.11 |
Basal metabolic energy MV (J) during descent can be calculated using the following equation:
| 2.12 |
Both the mechanical EV and the basal metabolic MV energy should be considered for cost during vertical transit. The mechanical energy EV is convertible to metabolic cost for transport  using both the propeller efficiency (εp) with which muscular movements are translated into forward thrust, and the efficiency εA with which chemical energy is translated into muscular work (Hind & Gurney 1997). Thus, the energy cost during descent can be calculated using the following equation:
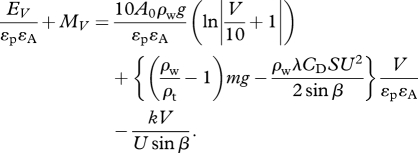 |
2.13 |
The energy cost  becomes minimum at a range of swim speeds (1.5–2.0 m s−1) independent of pitch angles (figure 2c). The cost of vertical descent (β = −90°) is minimum; however, the difference from that of β = −70° is negligible. Differentiating equation (2.13) by swim speed U gives us an optimal swim speed Uopt, which makes the cost minimum:
 |
2.14 |
and
 |
2.15 |
Assuming the avian basal metabolic rate (equation (2.11)), the drag coefficient of a 30 kg emperor penguin CD=0.003 and S = 0.68 m2 (Clark & Bemis 1979) and some values of constants εp = 0.85, εA=0.17 and λ = 0.576 (Hind & Gurney 1997), the optimal swim speed would be 1.7 m s−1 independent of air volume (buoyancy), pitch angle and dive depth. The energy cost was minimum at a range of speeds (1.5–2.0 m s−1, figure 2c), which is close to the previous experimental measurements (Culik et al. 1996).
According to equation (2.15), the optimal swim speed would be affected by the basal metabolic rate and drag of animals. Some previous studies (Alexander 1999; Motani 2002) included the work against drag and metabolic cost in a theoretical model, and reached the same conclusion that the optimal speed of swimming animals would be proportional to (basal metabolic rate/drag)1/3. In the present study, we included buoyancy and pitch angle in the model of diving penguins. However, the subsequent equation derived for the optimal swim speed was same as in the prior studies (Alexander 1999; Motani 2002).
The basal metabolic rate k is proportional to mass0.744 (equation (2.11)), and surface area S is proportional to mass2/3 in geometrically similar animals. Equation (2.15) predicts a scaling relationship between the optimal speed and body size of animals. Assuming a turbulent flow, CD is proportional to Re−1/5 (Vogel 1994). The Reynolds number is calculated as LU/ν, where L is the body length, U is the swim speed and ν is the kinematic viscosity of water. The body length L is proportional to mass1/3 in geometrically similar animals. Therefore, the optimal speed would be related to mass0.05. In the previous study (Hill 1950; Sato et al. 2007), in which it was assumed that swim speed was independent of body size and the time for a given movement (=1/freq) increases in direct proportion to linear size, the predicted stroke frequencies should be proportional to mass−1/3. If we use the new prediction (Uopt ∝ mass0.05), we thus derive another prediction that freq ∝ mass−0.28. These are predictions for geometrically similar divers to minimize the cost of transport.
(b). Field studies
Target species of the present study were emperor Aptenodytes forsteri, king Aptenodytes patagonicus, gentoo Pygoscelis papua, Adélie Pygoscelis adeliae, chinstrap Pygoscelis antarctica, macaroni Eudyptes chrysolophus and little penguins Eudyptula minor (table 2). Morphological measurements of these birds were conducted in the field (n = 7 species and 63 birds, table 2). Body mass and the maximum girth length were measured using spring balances and a tape measure, respectively. The wing was traced on paper or a scaled photo of the wing was taken, and length and area were measured using Photoshop (Adobe Systems, Inc., San Jose, CA, USA) and Igor Pro (WaveMetric, Inc., Lake Oswego, OR, USA). The location and the year of the measurements for each species were as follows: little penguin (Oamaru, New Zealand, 2003); macaroni penguin (Kerguelen Islands, South Indian Ocean, 2002); chinstrap and gentoo penguins (King George Island, Antarctic Ocean, 2006/2007); Adélie penguin (Signy Island, South Atlantic Ocean, 2007/2008); king penguin (Crozet Islands, South Indian Ocean, 2002/2003); emperor penguin (Cape Washington, Antarctic Ocean, 2005).
Table 2.
Morphological and behavioural data of seven species of penguin.
| morphology |
behaviour |
||||||||
|---|---|---|---|---|---|---|---|---|---|
| species | n | body mass (kg) | girth length (m) | single wing length (m) | single wing area (m2) | n | body mass (kg) | mean swim speed (m s−1) | dominant stroke cycle frequency (Hz) |
| emperor penguin A. forsteri | 14 | 24.9 | 0.93 | 0.34 | 0.0235 | 9 | 24.4 | 2.2 | 1.47 |
| 7a | 24.5a | 1.7a | 1.35a | ||||||
| king penguin A. patagonicus | 4 | 12.0 | 0.66 | 0.32 | 0.0205 | 5 | 11.9 | 2.1 | 1.55 |
| gentoo penguin P. papua | 19 | 5.2 | 0.56 | 0.22 | 0.0098 | 5 | 5.5 | 2.3 | 2.18 |
| Adélie penguin P. adeliae | 6 | 3.8 | 0.49 | 0.17 | 0.0072 | 10 | 4.7 | 2.1 | 2.33 |
| chinstrap penguin P. antarctica | 10 | 3.8 | 0.50 | 0.18 | 0.0078 | 5 | 4.0 | 2.3 | 2.56 |
| macaroni penguin E. chrysolophus | 7 | 3.2 | 0.46 | 0.19 | 0.0086 | 7 | 3.3 | 2.0 | 2.29 |
| little penguin E. minor | 3 | 1.1 | 0.31 | 0.12 | 0.0035 | 2 | 1.1 | 1.8 | 3.50 |
aData obtained from emperor penguins at Penguin Ranch (Sato et al. 2007). Not used in the comparative study.
We used mean cruising speed and dominant stroke cycle frequencies of free-ranging penguins published in a previous study (Sato et al. 2007). Using animal-borne data loggers (PD2GT and D2GT, Little Leonardo Ltd, Tokyo), swim speed and stroke frequency were recorded from penguins foraging underwater. The mean swim speed calculated during the descent phase of dives was used as cruising speed because hunting speed varied during the bottom phase (Wilson et al. 2002) and penguins glided up to the surface using positive buoyancy (Sato et al. 2002). Power spectral density was calculated from longitudinal acceleration of each bird to obtain dominant stroke cycle frequency. In the previous study (Sato et al. 2007), data of the Adélie penguin was collected from only two birds. Thus, another dataset of Adélie penguins (Takahashi et al. 2004) recorded at the Japanese Antarctic station (1999/2000) was used in the present study. In most cases, the data loggers were deployed on breeding birds under natural conditions, except for emperor penguins, where non-breeding adults were captured at the sea ice edge and released in a corral (named ‘Penguin Ranch’) on fast ice (Sato et al. 2005). Emperor penguins dove through one of two artificial holes drilled on the fast ice, and dive depth was usually less than 100 m. This is much shallower than the reported dive depth for this species (Rodary et al. 2000; Wienecke et al. 2007). Therefore, in the present study, we added data from nine emperor penguins obtained at a breeding colony, Cape Washington (74°39′ S, 165°24′ E), Antarctica, during the period from 26 October to 24 November 2005, using data loggers (W1000-PD2GT or W1000L-PD2GT, Little Leonardo Ltd, Tokyo). The maximum dive depth of each bird ranged from 357.5 to 513.5 m, and mean dive depth was between 28.3 and 71.9 m (n = 906–5859 dives). These dive depths were similar to those of previous studies for this species (Rodary et al. 2000; Wienecke et al. 2007). Mean swim speed and dominant stroke frequency were 2.2 m s−1 and 1.47 Hz (n = 9 birds), respectively, during foraging trips under natural conditions. These values are higher than those of emperor penguins diving through the artificial ice holes at the Penguin Ranch (n = 7 birds, 1.7 m s−1 and 1.35 Hz). The former values were used for comparative analyses in the present study.
(c). Statistics
Mean value with each species was logarithmically transformed and used for comparative analyses (n = 63 for morphology and n = 43 for behaviour, table 2). Although the penguins are closely related, it is not correct to treat the data from each species as evolutionarily independent data points in regression. Methods that incorporate phylogenetic information into comparative analysis have been developed (Felsenstein 1985; Garland et al. 2005). To compute phylogenetically informed allometric relationships, we used a phylogenetic tree of penguins, and branch lengths were set to be proportional to estimates of divergence time (Baker et al. 2006). Phylogenetically independent contrasts (Felsenstein 1985) were calculated using the PDAP package (Midford et al. 2005) with the software Mesquite (Maddison & Maddison 2009) and were used for the reduced major axes analyses to estimate the scaling relationships by the SMATR package (Warton et al. 2006) in the software R (R Development Core Team). The PDAP package allowed us to calculate the phylogenetically informed 95% confidence interval (CI) of the regression (Garland & Ives 2000).
3. Results
The mean girth length, mean wing length and mean wing area of the seven species changed with the mean body mass ranging from 1.1 to 24.9 kg (n = 7 species, table 2, figure 3). Allometric relationships are summarized in table 3. The slopes of the regressions for girth length and wing length were 0.364 and 0.363, respectively. The slope of the regression for wing area was 0.631. These values were not significantly different from 1/3 and 2/3, as would be predicted for slopes based on geometrical similarity (n = 7 species and 63 birds, table 3). The mean cruising speeds of penguins (seven species) ranged from 1.8 to 2.3 m s−1 (table 2) and significantly increased with body mass (p < 0.0001, table 3 and figure 4a). The scaling exponent of speed in relation to body mass was 0.083 (n = 7 species and 43 birds). The 95% CI for the slope of the regression was from 0.037 to 0.188, and the slope was not significantly different from 0.05 (p = 0.24, table 3), which was predicted for geometrically similar divers to minimize the cost of transport. As shown in figure 4b, the dominant stroke cycle frequency was related to the body mass, and the slope of the regression was −0.294 (n = 7 species and 43 birds). The 95% CI for the slope of the regression was from −0.198 to −0.437, which include both −1/3 and −0.28 (table 3), which were predicted by the isometric model (Hill 1950) and our model, respectively.
Figure 3.

Morphological comparison among seven species of penguins. (a) Double logarithmic plots of girth length, (b) wing length, and (c) wing area in relation to body mass. Regression lines obtained using reduced major axis estimation are indicated by solid lines. Dotted lines indicate 95% CI of the regressions. Colour of plots represents species. Dark blue circles, emperor; orange circles, king; purple circles, gentoo; black circles, Adélie; green circles, chinstrap; brown circles, macaroni; red circles, little.
Table 3.
Summary of allometric relationships in morphological and behavioural comparisons. (Allometric equations were calculated using mean values of GL, girth length (m); WL, wing length (m); WA, wing area (m2); U, swim speed (m s−1); F, dominant stroke cycle frequency (Hz = s−1); m, body mass (kg) in seven species of penguins.)
| relationship | scaling exponent β | 95% CI for β | predicted β | p |
|---|---|---|---|---|
| morphology | ||||
| GL versus mβ | 0.364 | 0.304–0.436 | 1/3 | 0.31 |
| WL versus mβ | 0.363 | 0.241–0.547 | 1/3 | 0.66 |
| WA versus mβ | 0.631 | 0.440–0.904 | 2/3 | 0.75 |
| behaviour | ||||
| U versus mβ | 0.083 | 0.037–0.188 | 0a | <0.0001 |
| 0.05b | 0.24 | |||
| F versus mβ | −0.294 | −0.198 to −0.437 | −1/3a | 0.51 |
| −0.28b | 0.80 | |||
aPredicted value based on a previous study (Hill 1950).
bPredicted value based on the present study.
Figure 4.

Behavioural comparisons among seven species of penguins are shown in double logarithmic plots of (a) cruising speed and (b) stroke frequency in relation to body mass. Regression lines obtained using reduced major axis estimation are indicated by solid lines. Dotted lines indicate 95% CI of the regressions. Colour of plots represents species. Dark blue circles, emperor; orange circles, king; purple circles, gentoo; black circles, Adélie; green circles, chinstrap; brown circles, macaroni; red circles, little.
4. Discussion
Morphological measurements of penguins supported the geometrical similarity of seven species, however, behavioural data did not completely support the previous predictions by the isometric model. The scaling exponent for dominant stroke frequency was −0.294, which was not significantly different from the prediction (freq ∝ mass−1/3) by the isometric model. However, the swim speed of the geometrically similar penguins significantly increased with their body mass, which is different from the previous prediction by the isometric model. On the other hand, the observations under natural conditions (U ∝ mass0.083 and freq ∝ mass−0.294) supported our predictions (Uopt ∝ mass0.05 and freq ∝ mass−0.28) for geometrically similar penguins to minimize the cost of transport.
We assumed that the basal metabolic rate k would be proportional to mass0.744, which was same as that of wild-caught birds (McKechnie et al. 2006). If we use other relationships, k ∝ mass0.723 for non-passerine birds (Schmidt-Nielsen 1990) and k ∝ mass0.719 for seabirds (Ellis & Gabrielsen 2002), the model prediction would be slightly modified as Uopt ∝ mass0.04 and freq ∝ mass−0.29. These predictions were still included in the 95% CIs for the scaling exponent for swim speed and stroke frequency (table 3). The results of the present study suggest that minimizing energy costs is the fundamental principle governing the scaling relationship of swim speed and stroke frequency in diving penguins, which have evolved geometrically similar bodies.
Some previous studies (Alexander 1999; Motani 2002) had reached to the same conclusion that the optimal speed of swimming animals would be proportional to (basal metabolic rate/drag)1/3. They considered only the work against drag and metabolic cost. In the present study, we included buoyancy, pitch angle and dive depth into our biomechanical model to investigate the optimal behaviour for breath-holding divers. Those factors did affect the energy cost as indicated in equation (2.13) and figure 2c. However, the predicted optimal swim speed was independent of buoyancy, pitch angle and dive depth (equation (2.15), figure 2c). This prediction is supported by some previous results. Penguins seem to predict their upcoming dive performance and regulate their inhaled air volume (buoyancy) in relation to dive depth (Sato et al. 2002; Wilson 2003). It was also reported that penguins made their dive angles (pitch angle) steeper for deep dives and shallower for shallow dives (Ropert-Coudert et al. 2001; Sato et al. 2004). However, average swim speeds during the descent were independent of the dive depth (Ropert-Coudert et al. 2002). All these results coincide with the theoretical prediction that penguins adopt the optimal swim speed independent of buoyancy, pitch angle and dive depth.
Our model can provide some implications for other swimming animals. According to equation (2.15), the optimal swim speed is proportional to (basal metabolic rate/drag)1/3. Sea turtles are expected to have relatively lower optimal speeds because they have a lower metabolic rate and a larger drag coefficient in comparison with streamlined penguins. This implication is supported by some observation data. Adult female leatherback turtles (mean body mass = 363 kg) had mean swim speeds of 0.9 and 0.66 m s−1 during internesting periods (Eckert 2002; Sato et al. 2007), which are lower than the swim speed of penguins (1.8–2.3 m s−1). It was discussed that the adult female turtles had less motivation for foraging during internesting periods, which might be a reason why they swam slowly (Sato et al. 2007). Since then, swim speed data were recorded from loggerhead turtles, including subadults and males at the foraging area (body mass, 32.8–94.5 kg), and the mean swim speed was 0.6 m s−1 (Narazaki et al. in press). Opportunistic feedings were also observed in those individuals. The slow cruising speeds of sea turtles seem to be caused by their lower metabolic rates and larger drag coefficients.
Our model characterizes the scaling relationships of cruising swim speed and dominant stroke frequencies in relation to the body mass of geometrically similar penguins. The result of penguins (freq ∝ mass−0.294; table 3) is consistent with the previous result obtained from seabirds, pinnipeds and cetaceans, freq ∝ mass−0.29 (Sato et al. 2007). Hill's predictions about behavioural parameters such as swim speed (∝mass0) and frequency of movement (∝mass−1/3) in geometrically similar animals are modified by the present study. However, geometrical similarity is still an essential assumption. It is difficult to demonstrate geometrical similarity among the above animals, which have evolved from phylogenetically different origins. However, the results of these comparative studies demonstrate the behavioural convergence of the diving animals and suggest the morphological similarity of aquatic animals.
Acknowledgements
Field experiments were conducted under permission from the ethics committee of the Institut Polaire Paul Emile Victor, France, the Ministry of the Environment and the Agency for Cultural Affairs, government of Japan, and the ethics committee of the University of Tokyo.
We thank G. Kooyman, G. Marshall, Y. Handrich, J. B. Charrassin, C. Bost, H. C. Shin and P. N. Trathan for assistance in the field. We would like to thank N. Kokubun, Y. Mori, S. Watanabe and N. Katsumata for their help with morphological measurements. K. Sakamoto contributed to data analysis. C. Marshall and C. Bost gave comments on the manuscript. This work was funded by grants from the Japan Society for the Promotion of Science (19255001 and 20310016), National Science Foundation (0229638) and the programme ‘Bio-Logging Science of the University of Tokyo (UTBLS)’ led by N. Miyazaki.
References
- Alexander R. M.1999One price to run, swim or fly? Nature 397, 651–653 (doi:10.1038/17687) [DOI] [PubMed] [Google Scholar]
- Baker A., Pereira S. L., Haddrath O. P., Edge A.2006Multiple gene evidence for expansion of extant penguins out of Antarctica due to global cooling. Proc. R. Soc. B 273, 11–17 (doi:10.1098/rspb.2005.3260) [DOI] [PMC free article] [PubMed] [Google Scholar]
- Clark B. D., Bemis W.1979Kinematics of swimming of penguins at the Detroit Zoo. J. Zool. Lond. 188, 411–428 (doi:10.1111/j.1469-7998.1979.tb03424.x) [Google Scholar]
- Culik B. M., Putz K., Wilson R. P., Allers D., Lage J., Bost C. A., LeMaho Y.1996Diving energetics in king penguins (Aptenodytes patagonics). J. Exp. Biol. 199, 973–983 [DOI] [PubMed] [Google Scholar]
- Eckert S.2002Swim speed and movement patterns of gravid leatherback turtles (Dermochelys coriacea) at St Croix, US Virgin Islands. J. Exp. Biol. 205, 3689–3697 [DOI] [PubMed] [Google Scholar]
- Ellis H. I., Gabrielsen G. W.2002Energetics of free-ranging seabirds. In Biology of marine birds (eds Schreiber E. A., Burger J.), pp. 359–407 Boca Raton, FL: CRC Press [Google Scholar]
- Felsenstein J.1985Phylogenies and the comparative method. Am. Nat. 125, 1–15 (doi:10.1086/284325) [Google Scholar]
- Garland T., Ives A. R.2000Using the past to predict the present: confidence intervals for regression equations in phylogenetic comparative methods. Am. Nat. 155, 346–364 [DOI] [PubMed] [Google Scholar]
- Garland T., Bennett A. F., Rezende E. L.2005Phylogenetic approaches in comparative physiology. J. Exp. Biol. 208, 3015–3035 (doi:10.1242/jeb.01745) [DOI] [PubMed] [Google Scholar]
- Hill A. V.1950The dimensions of animals and their muscular dynamics. Sci. Prog. 38, 209–230 [Google Scholar]
- Hind A. T., Gurney W. S. C.1997The metabolic cost of swimming in marine homeotherms. J. Exp. Biol. 200, 531–542 [DOI] [PubMed] [Google Scholar]
- Maddison W. P., Maddison D. R.2009Mesquite: a modular system for evolutionary analysis, v. 1.1. See http://mesquiteproject.org [Google Scholar]
- McKechnie A. E., Freckleton R. P., Jetz W.2006Phenotypic plasticity in the scaling of avian basal metabolic rate. Proc. R. Soc. B 273, 931–937 (doi:10.1098/rspb.2005.3415) [DOI] [PMC free article] [PubMed] [Google Scholar]
- Midford P. E., Garland T., Maddison W. P.2005PDAP package of Mesquite, v. 1.07 [Google Scholar]
- Motani R.2002Swimming speed estimation of extinct marine reptiles: energetic approach revisited. Paleobiology 28, 251–262 (doi:10.1666/0094-8373(2002)028<0251:SSEOEM>2.0.CO;2) [Google Scholar]
- Narazaki T., Sato K., Abernathy K. J., Marshall G. J., Miyazaki N.In press Compensating deflection at surface: analyzing orientation of traveling sea turtles under natural condition. J. Exp. Biol. [DOI] [PubMed] [Google Scholar]
- Rodary D., Bonneau W., Le Maho Y., Bost A.2000Benthic diving in male emperor penguins Aptenodytes forsteri foraging in winter. Mar. Ecol. Prog. Ser. 207, 171–181 (doi:10.3354/meps207171) [Google Scholar]
- Ropert-Coudert Y., Kato A., Baudat J., Bost C.-A., LeMaho Y., Naito Y.2001Time/depth usage of Adélie penguins: an approach based on dive angles. Polar Biol. 24, 467–470 (doi:10.1007/s003000100235) [Google Scholar]
- Ropert-Coudert Y., Kato A., Sato K., Naito Y., Baudat J., Bost C.-A., LeMaho Y.2002Swim speed of free-ranging Adélie penguins Pygoscelis adeliae and its relation to the maximum depth of dives. J. Avian Biol. 33, 94–99 (doi:10.1034/j.1600-048X.2002.330115.x) [Google Scholar]
- Sato K., Naito Y., Kato A., Niizuma Y., Watanuki Y., Charrassin J. B., Bost C.-A., Handrich Y., Le Maho Y.2002Buoyancy and maximal diving depth in penguins: do they control inhaling air volume? J. Exp. Biol. 205, 1189–1197 [DOI] [PubMed] [Google Scholar]
- Sato K., Charrassin J. B., Bost C.-A., Naito Y.2004Why do macaroni penguins choose shallow body angles that result in longer descent and ascent durations? J. Exp. Biol. 207, 4057–4065 (doi:10.1242/jeb.01265) [DOI] [PubMed] [Google Scholar]
- Sato K., Ponganis P. J., Habara Y., Naito Y.2005Emperor penguins adjust swim speed according to the above-water height of ice holes through which they exit. J. Exp. Biol. 208, 2549–2554 (doi:10.1242/jeb.01665) [DOI] [PubMed] [Google Scholar]
- Sato K., et al. 2007Stroke frequency, but not swimming speed, is related to body size in free-ranging seabirds, pinnipeds and cetaceans. Proc. R. Soc. B 274, 471–477 (doi:10.1098/rspb.2006.0005) [DOI] [PMC free article] [PubMed] [Google Scholar]
- Schmidt-Nielsen K.1984Scaling: why is animal size so important? Cambridge, UK: Cambridge University Press [Google Scholar]
- Schmidt-Nielsen K.1990Animal physiology: adaptation and environment Cambridge, UK: Cambridge University Press [Google Scholar]
- Takahashi A., Sato K., Nishikawa J., Watanuki Y., Naito Y.2004Synchronous diving behavior of Adélie penguins. J. Ethol. 22, 5–11 (doi:10.1007/s10164-003-0111-1) [Google Scholar]
- Vogel S.1994Life in moving fluids Princeton, NJ: Princeton University Press [Google Scholar]
- Warton D. I., Wright I. J., Falster D. S., Westoby M.2006Bivariate line-fitting methods for allometry. Biol. Rev. 81, 259–291 (doi:10.1017/S1464793106007007) [DOI] [PubMed] [Google Scholar]
- Wienecke B., Robertson G., Kirkwood R., Lawton K.2007Extreme dives by free-ranging emperor penguins. Polar Biol. 30, 133–142 (doi:10.1007/s00300-006-0168-8) [Google Scholar]
- Wilson R. P.2003Penguins predict their performance. Mar. Ecol. Prog. Ser. 249, 305–310 (doi:10.3354/meps249305) [Google Scholar]
- Wilson R. P., Hustler K., Ryan P. G., Burger A. E., Nöldeke E. C.1992Diving birds in cold water: do Archimedes and Boyle determine energetic costs? Am. Nat. 140, 179–200 (doi:10.1086/285409) [Google Scholar]
- Wilson R. P., Ropert-Coudert Y., Kato A.2002Rush and grab strategies in foraging marine endotherms: the case for haste in penguins. Anim. Behav. 63, 85–95 (doi:10.1006/anbe.2001.1883) [Google Scholar]