Abstract
From consideration of the extent of contact between fibres in electrospun polymer networks, we provide theory relating the specific surface area of the network to the characteristic dimensions of interfibre voids. We show that these properties are strongly influenced by the cross-sectional morphologies of fibres. Whereas porosity has a strong influence on pore dimensions, in the range of porosities typically obtained in real networks, its influence on specific surface area is weak. By considering reference geometries of collapsed ribbons and fibres with circular cross sections, we demonstrate that at a given network porosity, fibre parameters that increase the specific surface area reduce the characteristic dimensions of voids. The implications of the theory, mainly in the context of cell proliferation on electrospun polymer scaffolds, are discussed; the theory has relevance also to future applications of these materials in composites.
Keywords: electrospinning, modelling, specific surface, pore size
1. Introduction
The basic principle of electrospinning is that when electric charge is applied to a polymer solution or melt, the polymer deforms because of the mobility of charges at the surface and within the bulk (Reneker & Chun 1996; Rutledge & Fridrikh 2007). At a critical voltage, charge repulsion at the surface of the polymer exceeds the surface tension and a fine jet of polymer can be seen to be ejected towards an earthed (or charged) target (Reneker & Chun 1996; Shin et al. 2001; Rutledge & Fridrikh 2007). Electrospun fibres can be produced with a range of diameters; typically 0.1–100 µm (Rutledge & Fridrikh 2007). The significant parameters used to control a typical electrospinning process are the surface tension of the polymer solution or melt, the flow rate of the polymer solution or melt from the electrospinning needle and the electric current in the jet (Rutledge & Fridrikh 2007). It has been predicted theoretically that varying the flow rate of the polymer should result in sixfold changes in the fibre diameter (Rutledge & Fridrikh 2007). This prediction has been experimentally validated for a wide range of polymer solutions (Rutledge & Fridrikh 2007). For a full review of the effect of process parameters on the fibre diameters obtained by electrospinning, the reader is directed to Deitzel et al. (2001). Previously, we demonstrated that the porous structure of nanofibrous networks is highly dependent on fibre diameter (Eichhorn & Sampson 2005). This means that relatively simple modification of electrospinning process variables could be used to modify fibre dimensions to control network geometries, and hence their functionalities.
The use of electrospun fibres for a range of applications is well documented in the literature. These include fibres for tissue engineering subtsrates (Li et al. 2002), filtration media (Gibson et al. 2001) and composite materials (Kim & Reneker 1999; Dzenis 2004). In each of these applications, the control of the fibre diameter adds specific functionality to the network. In the case of tissue-engineered substrates, it has been shown that the onset of fibroblast cell adhesion and migration depends on a minimum fibre diameter (Sun et al. 2007). Further, different cell types have also been shown to exhibit selectivity over the size of pores which they are able to occupy (Sun et al. 2007). In a previous publication, we used theory to show that networks with micrometre-sized fibres have larger mean pore sizes than those with submicrometre-sized fibres (Eichhorn & Sampson 2005). This result has been experimentally verified, whereby networks with micrometre-sized fibres have been shown to allow cells to ingress, whereas networks comprising thinner fibres only allow surface proliferation (Pham et al. 2006). By making networks with two different sized fibres (micrometre and submicrometre), it is possible to have both surface proliferation and ingress (Pham et al. 2006). Other authors have also used this result for controlled adhesion and migration of cells (Ekaputra et al. 2008; Thorvaldsson et al. 2008; Zhu et al. 2008).
Another feature of electrospun networks that can be controlled by the fibre diameter is the available surface area. Reducing fibre diameter increases the surface area to volume ratio, and vice versa. The available surface area of fibres will clearly have an effect on the ability of cells to attach and migrate. For composite materials, it has been shown that electrospun fibre reinforced epoxy has a higher toughness (the ability to prevent the growth of cracks) than the pure resin (Kim & Reneker 1999). Although the mechanisms for enhanced strength and stiffness in composite materials are well understood, those leading to enhanced toughness in nanocomposite materials are not. In the case of spherical silica nanoparticles in epoxy, it has been shown that debonding, voiding and subsequent plastic void growth is the dominant toughening mechanism (Johnsen et al. 2007). For carbon nanotubes, which have a significant aspect ratio (cf. spherical particles), pull-out has been suggested as one possible mechanism for enhanced toughness (Wichmann et al. 2008). Toughening mechanisms in nanostructured materials have also recently been reviewed (Ruiz-Peréz et al. 2008). Both in the cases of particles and nanofibres, the toughness of the composite material scales proportionally to the surface area, i.e. the available surface area for contact with the resin. Since this is intrinsically related to the fibre diameter, and given that electrospun fibres have been proposed as possible reinforcements of composites, a treatment of the relationship between fibre morphology and available surface fraction is timely. The mechanical properties of composite materials are affected also by the distribution of resin within their structure. The occurrence of resin-rich regions can produce local anisotropy, and so a treatment of the interrelationship between fibre geometry, the available surface area and pore dimensions in a network of fibres is timely also.
Electrospun fibres can be formed with a variety of morphologies: collapsed ribbons, wrinkled, etc. (Koombongse et al. 2001; Pai et al. 2009). It is now known that phase separation between moisture from changes in ambient humidity and the solvents typically used for electrospinning cause these effects (Pai et al. 2009). These changes in morphology are also known to effect the mechanical properties of single fibres (Pai et al. 2009), though the mechanical properties of networks as a function of the fibre morphology have not been fully investigated. It is known that mechanical properties do, however, play a significant role in terms of the ability of electrospun networks to support cell growth (McManus et al. 2006; Mauck et al. 2009). Accordingly, knowledge of the influence of fibre geometry on the structure of electrospun networks will guide our understanding of the mechanical properties of composite materials and tissue-engineering substrates, and the ability of cells to migrate within electrospun networks.
In the main body of this paper, we provide a theory relating the specific surface area and interfibre pore dimensions of electrospun networks to fibre and network variables. We do not consider networks of porous electrospun fibres (Czado et al. 2001), since we expect the specific surface of these to be insensitive to interfibre voids and instead to be overwhelmingly influenced by intrafibre porosity. We shall see that for networks of solid fibres, specific surface area and pore dimensions depend strongly on the extent of interfibre contact and our derivations will use expressions from the literature for this property. Accordingly, we begin with a discussion of these models for fibre contact.
2. Fibre contact
The classical reference structure for modelling disordered fibrous materials is a random fibre network where the location of any given fibre is independent of that of any other fibre, and fibres have an equal probability of making all possible angles with any arbitrarily chosen axis (Kallmes & Corte 1960). For materials such as paper, non-woven textiles and fibrous filters, fibres have finite length, so fibre centres are assumed to be distributed according to a point Poisson process in the plane. For electrospun networks, fibres can be assumed to have infinite length. Such networks can be modelled as a random network of infinite lines that represent the longitudinal axes of fibres and pass through points distributed according to a point Poisson process in the plane with uniformly distributed orientation (Miles 1964).
The expected mass per unit area, or areal density β̄ (kg m−2), of a stochastic fibrous material is determined by the total fibre length per unit area, τ (m−1), and the linear density of the constituent fibres, δ (kg m−1), such that
| 2.1 |
Random lines in the plane partition the space into polygons and Miles (1964) showed that the distribution of radii of circles inscribed within these polygons has an exponential distribution and that the mean polygon area is independent of the width of the lines. Miles also showed that the locations of the points of intersection of lines, or crossings, are distributed according to a point Poisson process in the plane and that the number of crossings per unit area depends on the total fibre length per unit area, τ, only, according to the equation
| 2.2 |
The number of fibres covering a point in the plane of support of the network is a random variable called coverage, c. Kallmes & Corte (1960) modelled fibres as rectangles of finite length λ and width ω and quantified the intensity of the fibre process in the plane by the mean coverage, c̄. For a process of nf fibres per unit area, the mean coverage is
| 2.3 |
and the probability that a point in the plane of support of the network is covered by precisely c fibres is given by the Poisson distribution:
| 2.4 |
Often, it is convenient to calculate the mean coverage using the areal density of the network and the linear density and width of the constituent fibres, as
| 2.5 |
Kallmes & Corte (1960) considered the special case of ‘two-dimensional’ random fibre networks and defined these as having sufficiently low mean coverage that the Poisson probability of coverage greater than 2 is less than 0.01; it turns out that this criterion is met for networks with mean coverage less than about 0.5 (Deng & Dodson 1994). Typically, real networks will exhibit much higher mean coverages than two-dimensional networks and will have a significant structural component perpendicular to their plane. A consequence of this is that vertically adjacent fibres may or may not make contact with each other, depending on the influence of nearby fibres. We will take account of such effects in our subsequent analysis. In the two-dimensional case, however, we may assume that every crossing generates an interfibre contact. On this basis, Kallmes and Corte derived the expected number of crossings between fibres per unit area in a two-dimensional network as
| 2.6 |
Now, the total fibre length per unit area in a network of finite length fibres is
| 2.7 |
so nf = τ/λ and c̄ = τ ω. The expected number of crossings per unit area for a Poisson fibre process is therefore
| 2.8 |
which is the same as the number of crossings per unit area in a network of infinite lines, as given by equation (2.2). This is convenient because it means that the statistics of interfibre crossings in stochastic fibrous materials are not influenced by the length of fibres, but are determined instead by the total fibre length per unit area. An extension of this is that fibre curvature does not influence the expected number of crossings in the network. This conclusion was drawn also by Berhan et al. (2004) who arrived at equation (2.8) by considering the probability of intersection of segments of finite length curved fibres and confirmed its validity through simulation studies for networks of fibres with sinusoidal curvature with differing sinusoidal frequency. For completeness, we note the finding of Komori et al. (1979) that whereas the expected number of crossings per fibre is insensitive to fibre curvature, the variance of the number of crossings per fibre increases with increasing fibre curvature for two-dimensional networks.
Each fibre crossing generates a contact with finite area dependent on the width of the fibres and the angle of intersection of the pair of fibres generating a given contact. The fraction of the fibre surface in contact with other fibres is termed the fractional contact area, Φ. Only a small fraction of a two-dimensional network has coverage greater than 3, so, assuming full contact over the projected area of a crossing, Kallmes et al. (1963) considered the Poisson probabilities of the network having coverage 1, 2 or 3 to derive the fractional contact area of a two-dimensional network and obtained
| 2.9 |
For networks of infinite mean coverage, contact between vertically adjacent fibres is influenced by their proximity to nearby fibres and the fractional contact area can be expressed in terms of the network porosity, ϵ (Sampson 2008)
 |
2.10 |
In networks with a finite mean coverage c̄, fibres in the outermost surfaces contact other fibres on one side only, such that the fractional contact area is less than that of an infinitely thick network. The fraction of the total fibre length located in the surfaces has recently been derived by consideration of the Poisson probabilities of coverage at points (I'Anson & Sampson 2007); to a reasonable approximation for networks with mean coverage greater than about 10, this fraction is (1 − 1/c̄), so the fractional contact area of a network with finite mean coverage is
 |
2.11 |
When considering networks with mean coverages much less than 10, the equations provided in I'Anson & Sampson (2007) should be applied.
Inevitably, the specific surface area of a fibre network will be influenced by the fraction of the total fibre surface that is in contact with other fibres. If the specific surface area of a fibre is Sf (m2 g−1), then the specific surface area of a network of such fibres is
| 2.12 |
Electrospun networks typically have porosity greater than about 0.7 (Li et al. 2006; Pham et al. 2006; Frey & Li 2007) and, using approximate expressions, we previously showed that Φ ≈ Φ∞ in this range (Eichhorn & Sampson 2005); the same approximation holds using equations (2.10) and (2.11).
3. Pore dimensions
Fibre contacts influence the characteristic dimensions of pores also. In a Poisson line process in the plane, each crossing is associated with four polygons, and Miles (1964) showed that the expected number of sides per polygon is also four, this being subsequently confirmed in simulation studies (Crain & Miles 1976; George 1987). Accordingly, the expected number of polygonal voids per unit area in the xy-plane is expected to be close to the expected number of crossings per unit area. On this basis, Sampson (2009) has recently shown that the expected area of a polygonal void in a two-dimensional network is
 |
3.1 |
where ϵ is now the fractional open area of the network, i.e. the fraction of the network that is not covered by fibres. We use the same notation for this property and for the porosity of networks with finite thickness since the two-dimensional model can be considered to apply to an infinitesimally thin slice within the bulk and parallel to the plane of a network with finite thickness. Such thin slices will have a fractional open area equivalent to the network porosity. We note also that Abdel-Ghani & Davies (1985) obtained the approximation
 |
3.2 |
and this gives close agreement to equation (3.1) for ϵ greater than about 0.4.
A convenient measure of the characteristic in-plane dimension of a polygonal void is the diameter of a circle with the same area. From equation (3.1), we can estimate the mean equivalent diameter of a polygonal void as
 |
3.3 |
Equations (3.1) and (3.3) provide, respectively, the expected in-plane area and equivalent diameter for arbitrary planes parallel to that of the network. Although individual fibres may bend so that along their length they occupy space in adjacent planes through the thickness of the material, this does not influence the applicability of equations (3.1) and (3.3) since what is important is the probability that a given point in space is occupied by a fibre or not, i.e. the fractional open area of a planar section or the porosity of a section with finite thickness. Thus, the influence of fibre flexibility, and any other parameters that may influence packing efficiency, is accounted for implicitly through their influence on porosity.
In networks of finite thickness, vertically adjacent fibres may not generate a contact owing to the presence of nearby fibres. The probability that a pair of vertically adjacent fibre surfaces do not make contact and thus represent the boundaries of a void is (1 − Φ∞) and their separation is termed the pore height. The mean pore height, h̄, is given by
 |
3.4 |
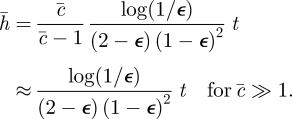
where t is the thickness of fibres, i.e. their dimension perpendicular to the plane of the network. The derivation of equation (3.4), following the treatment provided in Sampson (2009), is given in appendix A. An alternative expression for the mean pore height was obtained by Niskanen & Rajatora (2002)
| 3.5 |
We note, however, that equation (3.5) was obtained without accounting for contact between fibres, so will underestimate the mean pore height.
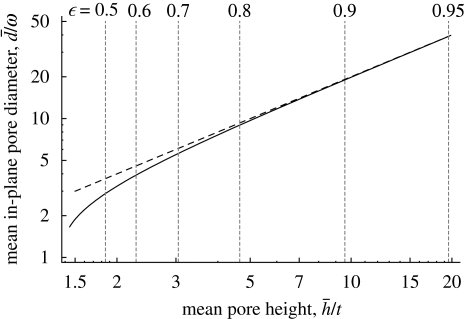
Figure 1 shows the mean in-plane pore dimension in units of the fibre width, as given by equation (3.3), plotted against the mean pore height in units of the fibre thickness, as given by equation (3.4). The broken line represents 2h̄/t and we observe that d̄/ω is asymptotic to this line with increasing porosity. Thus, for networks with porosity greater than about 0.7, we have the approximation
| 3.6 |
Figure 1.
Mean in-plane pore diameter in units of the fibre width, as given by equation (3.3), plotted against the mean pore height in units of the fibre thickness, as given by equation (3.4). Broken line represents d̄/ω = 2h̄/t.
For fibres with circular cross section ω = t, so d̄ = 2h̄ and for collapsed ribbons t < ω, so d̄ > 2 h̄. Thus, pores exhibit anisotropic dimensions in the principal planes of the network and the mean height is always less than half the mean in-plane dimension of pores. In the context of cell proliferation in an electrospun fibrous scaffold, this implies that connectivity between cells is limited by the vertical dimension of pores in the network and not by their in-plane dimensions. At a given porosity, these will be smaller for networks of collapsed ribbons than they are for fibres with circular cross section. We note that theoretical analysis of experimental measurements of the pore size distribution in paper, i.e. a stochastic layered network of cellulosic fibres, suggests that around 70 per cent of the measured distribution arises from the pore height distribution with the remainder being associated with the in-plane distribution of pore diameters (Sampson & Urquhart 2008).
We proceed to use reference geometries for fibre cross sections to develop relationships between the specific surface area of the network and its mean pore height, with a view to identifying opportunities to optimize these properties for application as scaffolds in tissue engineering. While our interest and discussion of the theory is focused on this application, the expressions derived can be applied also to general classes of stochastic fibrous materials.
4. Cross-sectional fibre geometries
We have seen that the characteristic dimensions of voids are closely related to those of the constituent fibres. Inevitably, the cross-sectional dimensions of fibres influence their specific surface area and, thus, that of the network, cf. equation (2.12). Three cases of interest are shown in figure 2. In what follows, we consider only the cases of the solid circular cross section (figure 2a) and the fully collapsed ribbon (figure 2c); the geometry of the uncollapsed hollow fibre (figure 2b) is included since it guides our parametrization of the dimensions of interest in a manner that permits a single choice of variables to characterize the geometries shown in figure 2a,c.
Figure 2.
Model fibre cross-sectional geometries. (a) Solid circle, (b) uncollapsed circular tube and (c) fully collapsed ribbon.
Koombhongse et al. (2001) found that the cross-sectional perimeter of collapsed ribbons was very close to that of the polymer jet from which they are spun, so the diagrams in figure 2 are all drawn with the same outer perimeter and in what follows we will use this perimeter, P, as the characteristic dimension of the fibre. Although this may not seem an intuitive choice of characteristic dimension, the fibre perimeter is relatively easy to measure by image analysis of cross-sectional micrographs of electrospun mats, whereas fibre diameter, for example, may be less well defined for irregular cross-sectional geometries and, for example, helically twisted fibres (Canejo et al. 2008). We shall see also that specific surface area and pore dimensions exhibit simple relationships with fibre perimeter, permitting convenient characterization of their interdependence.
In an ideal case, when a fibre of tubular cross section with skin thickness, ts, is fully collapsed (figure 2b), the height of the fibre ribbon (figure 2c) is
| 4.1 |
and its width is
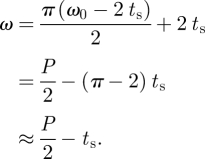 |
4.2 |
When ts = ω0/2, P = πω0 and equation (4.2) yields ω = ω0. Accordingly, equations (4.1) and (4.2) provide a unified notation for fibres with solid circular cross section or for fully collapsed ribbons.
5. Specific surface area
The specific surface area of fibres with linear density δ and cross-sectional perimeter P is
| 5.1 |
where A (m2) is the cross-sectional area and ρ (kg m−3) is the density of the polymer. If we assume that the cross-sectional area of a fibre is not influenced by the collapsing process then we have
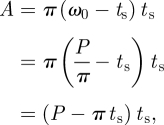 |
5.2 |
such that
| 5.3 |
and for fibres with solid circular cross section, ts = ω0/2, P = πω0 and Sf = 4/(ρω0).
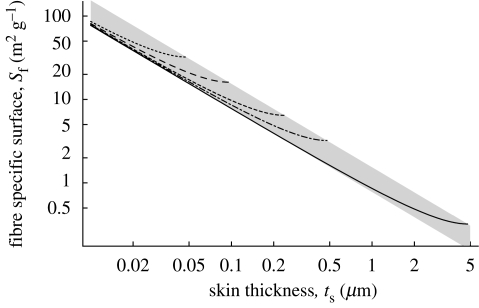
The specific surface area of a fibre, as given by equation (5.3), is plotted against the mean skin thickness, ts, in figure 3 for fibres with different perimeter, P. A polymer density of ρ = 1000 kg m−3 has been assumed in generating figure 3; although this is lower than the density of typical polymers, it allows straightforward determination of Sf for fibres formed from other polymers by dividing the values on the ordinate by their specific gravity. For each perimeter considered, the range of skin thickness plotted is 0 < ts ≤ P/(2π) such that the maximum skin thickness in the range corresponds to a fibre with solid circular cross section. Although the curves provide the relationship between Sf and ts independent of the state of collapse, collapsed ribbons are more likely to occur for fibres with larger perimeters. The shaded region represents the envelope of realizable structures: the lower bound represents the case when ts ≪ P and equation (5.3) reduces to Sf ≈ 1/(ρts) and the upper bound represents the case of fibres with solid circular cross section and with diameter ω0 = 2ts such that Sf = 2/(ρts).
Figure 3.
Relationship between fibre specific surface and fibre skin thickness as given by equation (5.3). Dotted line, P = 0.3 µm (ω0 ≈ 100 nm); long dashed line, P = 0.6 µm (ω0 ≈ 200 nm); short dashed line, P = 1.5 µm (ω0 ≈ 500 nm); dash dotted line, P = 3 µm (ω0 ≈ 1 µm); solid line, P = 30 µm (ω0 ≈ 10 µm).
The inverse proportionality to ts of the boundaries of the shaded region in figure 3 suggests that the curves plotted may be scaled to each other to yield a master curve. If we define a dimensionless shape parameter α = ts/P then we obtain
| 5.4 |
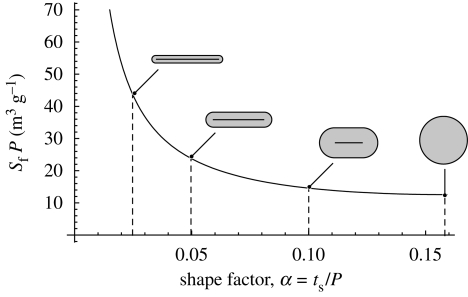
So for fibres formed from a given polymer with density ρ, the product SfP depends only on α = ts/P. This is plotted for fibres with density ρ = 1000 kg m−3 in figure 4 which includes some illustrations of fibre cross sections with constant perimeter to aid interpretation. In their analysis of electrospun polymer ribbons, Koombhongse et al. (2001) report skin thicknesses of the order of a few hundred nanometres and inspection of their micrographs suggests perimeters of around 10–20 µm; accordingly, we may consider ribbons with α between about 0.01 and 0.05 to be realizable.
Figure 4.
SfP as given by equation (5.4) plotted against shape factor α = ts/P.
We have seen that the specific surface of the fibres is less than that of the network by a factor (1 − Φ) that depends only on the interfibre porosity. Assuming that Φ = Φ∞ and substituting equations (5.4) and (2.10) into equation (2.12) yields, on manipulation,
 |
5.5 |
Substituting t = 2ts = 2αP into equation (3.4) yields
 |
5.6 |
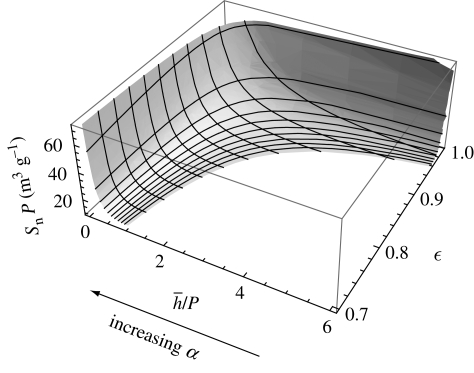
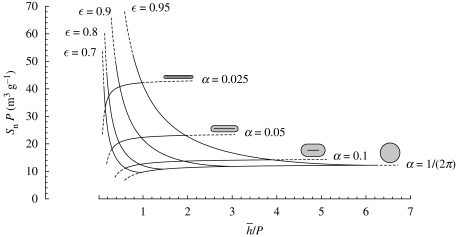
Given the relationship between d̄/ω and h̄/t and that between ω and t discussed earlier, equations (5.5) and (5.6) fully parametrize the relationship among porosity, specific surface area and pore dimensions. Since we have identified the pore height as the dominant variable controlling cell proliferation and barrier properties, the surface characterizing the dependence of Sn P and h̄/P on each other and on porosity is shown in figure 5. Again, this surface has been plotted assuming ρ = 1000 kg m−3. The relative influence of porosity and fibre collapse are more readily determined by inspection of a two-dimensional rendering of the surface shown in figure 5 and this is provided in figure 6.
Figure 5.
SnP as given by equation (5.5) plotted against h̄/P, as given by equation (5.6), and porosity.
Figure 6.
Two-dimensional representation of the surface shown in figure 5.
Now, the surface shown in figures 5 and 6 depends only on network porosity and the cross-sectional geometry, as parametrized by the variable α. Substituting α = ts/P into equation (5.2) and multiplying by the polymer density give the linear density of the fibres in terms of their perimeter, P, and α:
| 5.7 |
such that when α = 1/(2π), we have fibres of solid circular cross section and δ = ρP2/(4π). For fibres formed from a polymer with a given density ρ, three geometry-dependent cases must be considered to interpret the relationship between pore height and specific surface area.
Case A. Constant perimeter and variable linear density. From equation (5.7), if the fibre perimeter is constant, then fibre ribbons (α < 1/(2π)) have lower linear density than fibres with solid circular cross section (α = 1/(2π)) and thus have higher specific surface area. This effect is shown in figure 4, though for fibres assembled in a network we have an additional influence of network porosity and figure 6 shows that this is significant for porosities lower than about 0.9. At higher porosities, the specific surface area of the network is rather insensitive to porosity and approaches that of the constituent fibres, consistent with the experimental observations of Deitzel et al. (2001). In contrast, the mean pore height becomes increasingly sensitive to porosity as porosity increases and, at a given porosity, a network formed from ribbons will exhibit smaller pore dimensions than one formed from fibres with solid circular cross section. We expect also that collapsed fibres will be more flexible and thus will form networks with lower porosity than those with solid circular cross section, so there may be an additional decrease in mean pore height and a slightly weaker increase in specific surface area compared to that obtained assuming constant porosity. We expect that networks with this structure will be less able to allow cells to ingress, and surface proliferation may take place more readily.
Case B. Variable perimeter and variable linear density. For a given cross-sectional geometry, changes in the perimeter will influence the linear density of the fibres in proportion to the square of the perimeter. This behaviour is fully accounted for by scaling the curves in figure 6. So, regardless of geometry, doubling the perimeter will halve the specific surface area of the network and double the pore height.
Case C. Variable perimeter and constant linear density. If we denote the perimeter of a fibre with solid circular cross section P0, then equating A = P02/(4π) with equation (5.2) yields the perimeter of a collapsed ribbon with the same linear density as a multiple of P0:
 |
5.8 |
The curves shown in figure 6 still apply, but now the scaling factor, P, applied to the axes depends on the cross-sectional geometry of the fibres. The influence of this scaling on specific surface and pore height is best illustrated by example. Consider two fibre networks with porosity ϵ = 0.9 formed from fibres with ρ = 1000 kg m−3. One network consists of fibres with circular cross section and perimeter, P0, the other consists of ribbons with the same linear density and with α = 0.05. Equation (5.8) gives the perimeter the ribbons as P ≈ 1.4P0. For the circular fibres, equations (5.5) and (5.6) give Sn ≈ 12/P0 and h̄ ≈ 3P0, respectively. For the ribbons we obtain Sn ≈ 22/P = 22/(1.4P0) = 16/P0 and h̄ ≈ P = 1.4P0. Thus, the specific surface area of the network formed from ribbons is about 30 per cent greater than that of the network formed from fibres with solid circular cross section and the mean pore height is about 50 per cent less.
Although the influence of fibre dimensions on the specific surface area and pore height is somewhat less for case C than that observed for cases A and B, the fundamental constraint remains: at a given porosity, the fibre parameters that increase specific surface area inevitably reduce the mean pore dimensions. This means that for the support of cells in a tissue engineering application, although increased surface area may assist in cell adhesion, the potential for cells to ingress into the networks will be restricted.
Naturally, the expressions we have derived and interpreted apply strictly only to the model fibre cross sections shown in figure 2. Nonetheless, the general dependencies observed can be expected to apply to networks of fibres with less regular cross-sectional geometries.
6. Conclusions
We have extended models from the literature describing the structure of random fibrous materials to establish theoretical relationships between the specific surface area of an electrospun polymer network and the characteristic dimensions of its voids. For a given network porosity, the product of the specific surface and fibre perimeter exhibits a one-to-one relationship with the mean pore height divided by the fibre perimeter; this relationship varies with porosity to yield a unique surface characterizing the relationship among these variables.
Our treatment has considered primarily the mean pore height as the characteristic dimensions of voids, though we bear in mind our earlier comments that there is a direct relationship between mean pore height and the mean in-plane pore dimension and that this is determined by the cross-sectional fibre dimensions and porosity such that the mean pore height is less than half the mean in-plane pore dimension. Conveniently, both specific surface area and pore height increase with porosity. Further, whereas specific surface area is only weakly dependent on porosity at porosities greater than about 0.9, pore height exhibits its greatest sensitivity to porosity in this region. We conclude therefore that when seeking to maximize specific surface area and pore dimensions, primary consideration should be given to the selection of fibre geometries to maximize specific surface area allowing pore height to be subsequently controlled by targeting network porosity.
Appendix A
Here we derive equation (3.4) following the treatment provided in Sampson (2009).
Consider the occurrence of voids between fibres covering points with coverage c. No interfibre void can occur at points with coverage zero or 1 and at all points with coverage c ≥ 2, voids may exist between vertically adjacent fibres.
For networks with mean coverage greater than about 3, the fraction of the network with coverage zero and 1 is negligible, so, to a good degree of approximation, the expected number of interfaces between fibres occurring above any point in the network is (c̄ − 1). The probability of contact between a pair of vertically adjacent fibres is Φ∞. Thus, the expected number of voids located over a point with coverage c is
| A1 |
The expected thickness of a network with mean pore height h̄ is
| A2 |
and the expected total height of all voids at any point in the network is
| A3 |
It follows that the mean porosity ϵ is
 |
A4 |
Rearranging equation (A 4) yields
| A5 |
On manipulation, substitution of equation (2.10) into equation (A 5) yields equation (3.4):
 |
References
- Abdel-Ghani M. S., Davies G. A. 1985. Simulation of non-woven fibre mats and the application to coalescers. Chem. Eng. Sci. 40, 117–129. ( 10.1016/0009-2509(85)85052-1) [DOI] [Google Scholar]
- Berhan L., Yi Y. B., Sastry A. M. 2004. Effect of nanorope waviness on the effective moduli of nanotube sheets. J. Appl. Phys. 95, 5027–5034. ( 10.1063/1.1687989) [DOI] [Google Scholar]
- Canejo J. P., Borges J. P., Godinho M. H., Brogueira P., Teixeira P. I. C., Terentjev E. M. 2008. Helical twisting of electrospun liquid crystalline cellulose micro- and nanofibers. Adv. Mater. 20, 4821–4825. ( 10.1002/adma.200801008) [DOI] [Google Scholar]
- Crain I. K., Miles R. E. 1976. Monte Carlo estimates of the distributions of the random polygons determined by random lines in the plane. J. Statist. Comput. Simul. 4, 293–325. ( 10.1080/00949657608810132) [DOI] [Google Scholar]
- Czado M. W., Frese T., Schaper A., Hellwig M., Steinhart M., Greiner A., Wendorff J. H. 2001. Nanostructured fibers via electrospinning. Adv. Mater. 13, 70–72. ( 10.1002/1521-4095(200101)13:1%3C70::AID-ADMA70%3E3.0.CO;2-H) [DOI] [Google Scholar]
- Deitzel J. M., Kleinmeyer J., Harris D., Beck Tan N. C. 2001. The effect of processing variables on the morphology of electrospun nanofibers and textiles. Polymer 42, 261–272. ( 10.1016/s0032-3861(00)00250-0) [DOI] [Google Scholar]
- Deng M., Dodson C. T. J. 1994. Paper: an engineered stochastic structure. Atlanta, GA: Tappi Press. [Google Scholar]
- Dzenis Y. 2004. Spinning continuous fibers for nanotechnology. Science 304, 1917–1919. ( 10.1126/science.1099074) [DOI] [PubMed] [Google Scholar]
- Eichhorn S. J., Sampson W. W. 2005. Statistical geometry of pores and statistics of porous nanofibrous assemblies. J. R. Soc. Interface 2, 309–318. ( 10.1098/rsif.2005.0039) [DOI] [PMC free article] [PubMed] [Google Scholar]
- Ekaputra A. K., Prestwich G. D., Cool S. M., Hutmacher D. W. 2008. Combining electrospun scaffolds with electrosprayed hydrogels leads to three-dimensional cellularization of hybrid constructs. Biomacromolecules 9, 2097–2103. ( 10.1021/bm800565u) [DOI] [PubMed] [Google Scholar]
- Frey M. W., Li L. 2007. Electrospinning and porosity measurements of nylon-6/poly(ethylene oxide) blended non-wovens. J. Eng. Fibers Fabrics 2, 31–37. [Google Scholar]
- George E. I. 1987. Sampling random polygons. J. Appl. Prob. 24, 557–573. ( 10.2307/3214089) [DOI] [Google Scholar]
- Gibson P., Schreuder-Gibson H., Rivin D. 2001. Transport properties of porous membranes based on electrospun nanofibers. Colloids Surf. A 187–188, 469–481. ( 10.1016/S0927-7757(01)00616-1) [DOI] [Google Scholar]
- I'Anson S. J., Sampson W. W. 2007. Competing Weibull and stress-transfer influences on the specific tensile strength of a bonded fibrous network. Compos. Sci. Technol. 67, 1650–1658. ( 10.1016/j.compscitech.2006.07.002) [DOI] [Google Scholar]
- Johnsen B. B., Kinloch A. J., Mohammed R. D., Taylor A. C., Sprenger S. 2007. Toughening mechanisms of nanoparticle-modified epoxy polymers. Polymer 48, 530–541. ( 10.1016/j.polymer.2006.11.038) [DOI] [Google Scholar]
- Kallmes O., Corte H. 1960. The structure of paper, I. The statistical geometry of an ideal two dimensional fiber network. Tappi J. 43, 737–752. [Erratum in Tappi J. 1961 44, 448.] [Google Scholar]
- Kallmes O., Corte H., Bernier G. 1963. The structure of paper, V. The bonding states of fibres in randomly formed papers. Tappi J. 46, 493–502. [Google Scholar]
- Kim J.-S., Reneker D. H. 1999. Mechanical properties of composites using ultrafine electrospun fibers. Polym. Compos. 20, 124–131. ( 10.1002/pc.10340) [DOI] [Google Scholar]
- Komori T., Yasushi U., Matsunaga Y., Makishima K. 1979. Crossings of curled fibres in two dimensional assemblies. Tappi J. 62, 93–95. [Google Scholar]
- Koombhongse S., Liu W., Reneker D. 2001. Flat polymer ribbons and other shapes by electrospinning. J. Polym. Sci. B 39, 2598–2606. ( 10.1002/polb.10015) [DOI] [Google Scholar]
- Li W.-J., Laurencin C. T., Caterson E. J., Tuan R. S., Ko F. K. 2002. Electrospun nanofibrous structure: a novel scaffold for tissue engineering. J. Biomed. Mater. Res. 60, 613–621. ( 10.1002/jbm.10167) [DOI] [PubMed] [Google Scholar]
- Li D., Frey M. W., Joo Y. L. 2006. Characterization of nanofibrous membranes with capilliary flow porometry. J. Membr. Sci. 286, 104–114. ( 10.1016/j.memsci.2006.09.020) [DOI] [Google Scholar]
- Mauck R. L., Baker B. M., Nerurkar N. L., Burdick J. A., Li W. J., Tuan R. S., Elliot D. M. 2009. Engineering on the straight and narrow: the mechanics of nanofibrous assemblies for fiber-reinforced tissue regeneration. Tissue Eng. B. 15, 171–193. ( 10.1089/ten.teb.2008.0652) [DOI] [PMC free article] [PubMed] [Google Scholar]
- McManus M. C., Boland E. D., Koo H. P., Barnes C. P., Pawlowski K. J., Wnek G. E., Simpson D. G., Bowlin G. L. 2006. Mechanical properties of electrospun fibrinogen structures. Acta Biomater. 2, 19–28. ( 10.1016/j.actbio.2005.09.008) [DOI] [PubMed] [Google Scholar]
- Miles R. E. 1964. Random polygons determined by random lines in a plane. Proc. Natl Acad. Sci. USA 52, 901–907, 1157–1160 ( 10.1073/pnas.52.4.901) [DOI] [PMC free article] [PubMed] [Google Scholar]
- Niskanen K., Rajatora H. 2002. Statistical geometry of paper cross sections. J. Pulp Paper Sci. 28, 228–233. [Google Scholar]
- Pai C.-L., Boyce M. C., Rutledge G. C. 2009. Morphology of porous and wrinkled fibers of polystyrene electrospun from dimethylformamide. Macromolecules 42, 2102–2114. ( 10.1021/ma802529h) [DOI] [Google Scholar]
- Pham Q. P., Sharma U., Mikos A. G. 2006. Electrospun poly(η-capralactone) microfiber and multilayer nanofiber/microfiber scaffolds: characterisation of scaffolds and measurement of cellular infiltration. Biomacromolecules 7, 2796–2805. ( 10.1021/bm060680j) [DOI] [PubMed] [Google Scholar]
- Reneker D. H., Chun I. 1996. Nanometre diameter fibres of polymer, produced by electrospinning. Nanotechnology 7, 216–223. ( 10.1088/0957-4484/7/3/009) [DOI] [Google Scholar]
- Ruiz-Pérez L., Royston G. J., Fairclough J. P. A., Ryan A. J. 2008. Toughening by nanostructure. Polymer 49, 4475–4488. ( 10.1016/j.polymer.2008.07.048) [DOI] [Google Scholar]
- Rutledge G. C., Fridrikh S. V. 2007. Formation of fibres by electrospinning. Adv. Drug Del. Rev. 59, 1384–1391. ( 10.1016/j.addr.2007.04.020) [DOI] [PubMed] [Google Scholar]
- Sampson W. W. 2008. Unified theory for structural statistics of flocculated and random fibre networks. J. Pulp Paper Sci. 34, 91–98. [Google Scholar]
- Sampson W. W. 2009. Modelling stochastic fibrous materials with Mathematica. London, UK: Springer. [Google Scholar]
- Sampson W. W., Urquhart S. J. 2008. The contribution of out-of-plane pore dimensions to the pore size distribution of paper and stochastic fibrous materials. J. Porous Mater. 15, 411–417. ( 10.1007/s10934-006-9088-9) [DOI] [Google Scholar]
- Shin Y. M., Hohman M. M., Brenner M. P., Rutledge G. C. 2001. Electrospinning: a whipping fluid jet generates submicron polymer fibres. Appl. Phys. Lett. 78, 1149–1151. ( 10.1063/1.1345798) [DOI] [Google Scholar]
- Sun T., Norton D., Ryan A. J., MacNeil S., Haycock J. W. 2007. Investigation of fibroblast and keratinocyte cell-scaffold interactions using a novel 3D cell culture system. J. Mater. Sci. Mater. Med. 18, 321–328. ( 10.1007/s10856-006-0696-3) [DOI] [PubMed] [Google Scholar]
- Thorvaldsson A., Stenhamre H., Gatenholm P., Walkenström P. 2008. Electrospinning of highly porous scaffolds for cartilage regeneration. Biomacromolecules 9, 1044–1049. ( 10.1021/bm701225a) [DOI] [PubMed] [Google Scholar]
- Wichmann M. H. G., Schulte K., Wagner H. D. 2008. On nanocomposite toughness. Compos. Sci. Technol. 68, 329–331. ( 10.1016/j.compscitech.2007.06.027) [DOI] [Google Scholar]
- Zhu X., Cui W., Li X., Jin Y. 2008. Electrospun fibrous mats with high porosity as potential scaffolds for skin tissue engineering. Biomacromolecules 9, 1795–1801. ( 10.1021/bm800476u) [DOI] [PubMed] [Google Scholar]


