

Abstract
This work investigated the effect of adding nanoparticulate (29 nm) bioactive glass particles on the bioactivity, degradation and in vitro cytocompatibility of poly(3-hydroxybutyrate) (P(3HB)) composites/nano-sized bioactive glass (n-BG). Two different concentrations (10 and 20 wt %) of nanoscale bioactive glass particles of 45S5 Bioglass composition were used to prepare composite films. Several techniques (Raman spectroscopy, scanning electron microscopy, atomic force microscopy, energy dispersive X-ray) were used to monitor their surface and bioreactivity over a 45-day period of immersion in simulated body fluid (SBF). All results suggested the P(3HB)/n-BG composites to be highly bioactive, confirmed by the formation of hydroxyapatite on material surfaces upon immersion in SBF. The weight loss and water uptake were found to increase on increasing bioactive glass content. Cytocompatibility study (cell proliferation, cell attachment, alkaline phosphatase activity and osteocalcin production) using human MG-63 osteoblast-like cells in osteogenic and non-osteogenic medium showed that the composite substrates are suitable for cell attachment, proliferation and differentiation.
Keywords: poly(3-hydroxybutyrate), composites, nanoparticles, bioactive glass, MG-63 human osteoblasts, tissue engineering
1. Introduction
The use of polymer/bioceramic composite systems in biomedical applications, including tissue engineering scaffolds has seen increasing impetus owing to the ability to tailor the properties (viz. mechanical strength, stiffness, degradation kinetics and biological response) by microstructural design (Rezwan et al. 2006; Guarino et al. 2007). One of the prime reasons for the use of a bioceramic phase is to induce the formation of a bioactive hydroxyapatite (HA) layer on the surface that effectively interacts with the surrounding bone tissue (Hench 1998; Misra et al. 2006; Rezwan et al. 2006; Guarino et al. 2007; Barrere et al. 2008) and effectively also mimics the natural structure of bone (crucial for hard tissue applications; Barrere et al. 2008). Formation of the HA layer (Hench 1998) is a dynamic process and the kinetics of HA formation changes with time. Therefore, it is crucial to monitor the bioactivity of a biomaterial by using more than one means of characterization. The addition of bioactive ceramics or glasses to a biopolymer has also been shown to alter the degradation rate of the material by changing relevant parameters such as hydrophobicity, water absorption, weight loss and pH (Li & Chang 2005b; Loher et al. 2006). Lately, the use of nano-sized bioactive glass (n-BG) particles in polymeric matrices has shown to enhance the mechanical properties of the composites (Liu et al. 2008; Misra et al. 2008), increase surface adsorption of proteins (Misra et al. 2008) and is being employed in injectable systems (Couto et al. 2009). Bioactive glass nanoparticles have also shown increased bactericidal effect compared with the conventional micron-sized bioactive glass particles (Waltimo et al. 2007). Obviously, evaluation of the biocompatibility of composite systems using in vitro cell culture models and in vivo studies is required to determine the efficacy of the developed composites for the final use in the target area of application (Chen & Wu 2005; Schneider et al. 2008).
Poly(3-hydroxybutyrate) (P(3HB)) belongs to the biodegradable polyhydroxyalkanoate family and has been used for a range of biomedical applications (Williams & Martin 2002; Chen & Wu 2005; Misra et al. 2006). A recent study conducted on the derivatives of P(3HB) showed that the end products from degradation of P(3HB) are not harmful to mouse glial cells (Xiao et al. 2007), which highlights the biocompatibility of the polymer. Various in vivo experiments have shown P(3HB)/HA composites to allow bone apposition and attachment of both hard and soft tissue onto its surface (Knowles & Hastings 1992; Luklinska & Bonfield 1997). In general, it is important to understand/demonstrate the presence of an optimum concentration of particulate bioceramic phase in a polymer, which affects the material degradation behaviour and surface bioactivity as well as enhances the osteoblast cell functional response (Blaker et al. 2003; Wang et al. 2005; Rezwan et al. 2006; Guarino et al. 2007).
In this study, we have examined, in detail, the bioactivity (with particular emphasis towards evaluating the build up of the biologically active HA layer), degradation behaviour and biocompatibility of substrates fabricated by combining P(3HB) and bioactive glass nanoparticles (45S5 type). The proliferation of MG-63 human osteoblasts on the composites was evaluated along with measuring the alkaline phosphatase (ALP) activity and osteocalcin production in osteogenic and non-osteogenic media. This research was conducted to enable a better assessment of the potential of the P(3HB)/n-BG composite for applications in bone tissue engineering (Blaker et al. 2003; Helen & Gough 2006).
2. Experimental methods
2.1. Sample preparation
P(3HB), Mw = 285 000 was produced following previously developed biotechnological methods (Valappil et al. 2007) from Bacillus cereus SPV using a 20 l fermentor vessel. n-BG powders of nominal composition equivalent to 45S5 Bioglass (46 wt % SiO2, 23 wt % Na2O, 27 wt % CaO, 4 wt % P2O5), with spherical shape and a mean particle size of 29 nm, were prepared using the flame spray synthesis process, as described elsewhere (Brunner et al. 2006). P(3HB) and P(3HB)/bioactive glass films (10 and 20 wt % n-BG) were prepared by solvent casting technique. Chloroform was used to dissolve P(3HB) using a polymer concentration of 3 wt %. Subsequently, n-BG particles were added to the polymer solution and sonicated for 1 min using a sonicating probe (Ultrasonic Homogenizers US200, Philip Harris Scientific, Leicestershire, UK) in order to break possible bioactive glass agglomerates and ensure a better (homogeneous) distribution of n-BG particles in the composite. The solution was then cast onto glass Petri dishes at room temperature. Films of nominally 0.12–0.14 mm thickness were produced. Once the films were cast, they were stored in desiccators for further analyses, as detailed below.
2.2. Simulated body fluid study of poly(3-hydroxybutyrate)/nano-sized bioactive glass composites
The in vitro bioactivity and degradation study for up to 45 days was carried out in simulated body fluid (SBF), as developed by Kokubo et al. (1990). The initial mass of the samples was recorded and specimens were immersed in SBF at 37°C. The approximate sample weight to SBF volume ratio was maintained as 0.07 g 50 ml−1. The SBF was exchanged every 5 days and at different time points samples were collected for subsequent analyses.
2.3. Characterization techniques
Scanning electron microscopy. The samples before and after immersion in SBF were examined using a JEOL 5610LV scanning electron microscope. Energy dispersive X-ray (EDX) analysis was carried out on carbon coated samples at 15 kV and a working distance of 14 mm, using INCA (Oxford Instruments) software.
Atomic force microscopy. Atomic force microscopy (AFM) analysis was conducted on the polymeric and composite samples, using an Asylum MFP-3D-SA (Santa Barbara, USA) instrument in AC mode. The film samples (1 cm2) were placed on glass slides and were scanned in air over a 10 × 10 µm2 area using an Olympus AC240TS tip (spring constant 2 N m−1). The roughness of the surface as well as the amplitude and height channels were monitored and analysed using Igor Pro software.
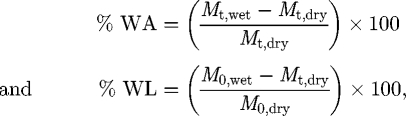
Water uptake and weight loss measurements. The water absorption (%WA) and weight loss (%WL) behaviour of samples, upon immersion in SBF, were determined over the 45-day period using equation (2.1), respectively,
 |
2.1 |
where M0,dry is the original sample weight measured before immersion in SBF. For measuring the water absorption (%WA), immersed samples were removed at given time points, the surface gently wiped and the weight was measured (Mt,wet). Similarly, for measuring the weight loss (%WL), the samples were removed from the SBF, dried at 37°C overnight and subsequently weighed (Mt,dry).
X-ray diffraction. X-ray diffraction (XRD) analysis on samples was performed on a Brüker D8 Advance diffractometer, in flat plate geometry, using Ni-filtered Cu Kα radiation. Data were collected from 10° to 100° in θ–θ mode with a primary beam slit size of 0.6 mm. A Brüker Lynx Eye silicon strip detector was used and a step size of 0.02° and a count time of 0.1 s per step were employed.
Raman spectroscopy. All Raman spectra were recorded using a Raman spectrometer (LabRAM HR; Horiba Jobin Yvon Ltd, UK, with Labspec software) with a 633 nm laser, filter at 100 per cent, hole at 300, slit at 150, grating at 1800, microscope objective ×50 and acquisition properties of exposure time for 10 s. Three spectra per location were recorded in the wavenumber interval of 400–1400 cm−1.
2.4. Cytocompatibility studies
In vitro cell culture studies were performed using MG-63 human osteosarcoma cell line. MG-63 cells, obtained from ECACC (European Collection of Cell Cultures at the Health Protection Agency, UK) were cultured in growth medium (Dulbecco's modified Eagle's medium (DMEM); PAA, Germany), supplemented with 10 per cent (v/v) foetal calf serum, 1 per cent (v/v) penicillin and streptomycin solution and incubated at 37°C in a humidified atmosphere (5% CO2 in 95% air), with the medium changed every 2 days.
The samples (1 cm2) were UV sterilized for 30 min and passivated in DMEM culture medium for 12 h, prior to seeding the cells. As a result of this passivation treatment, the presence of nitrogen and a gradual increase of calcium and phosphate precipitation on the samples was expected (Faure et al. 2009). A seeding density of 20 000 cells cm−2 was used, and the specified amounts of cells were seeded using 1 ml of DMEM medium. The plates were incubated in a humidified environment for a period of up to 14 days and the medium was changed every second day. At specific time intervals, samples were analysed for cell proliferation, ALP activity and osteocalcin measurements. Analyses were carried out in triplicates, per sample, and standard tissue culture plastic was used as the control.
Cell proliferation study. The cell proliferation study (n = 3) was carried out using the Alamar blue (AB) assay. AB (AbD Serotec, UK) was added to the samples (10% v/v of medium) and incubated at 37°C for 4 h. Aliquots of 200 µl from each sample well were transferred to a black 96-well plate and the fluorescence of the samples was measured using a fluorescence plate reader (Fluoroskan, Lab Systems) at 560 nm (A560) and 590 nm (A590). AB is an indicator dye that incorporates an oxidation–reduction (REDOX) indicator that both fluoresces and changes colour in response to the chemical reduction in growth medium, resulting from cell growth. The AB assay is designed to quantitatively measure the proliferation of various human and animal cell lines. AB is preferred to other cell proliferation/growth assays such as 3-(4,5-dimethylthiazolyl-2)-2,5-diphenyltetrazolium bromide (MTT) because it measures proliferation in the same population of cells in real time, whereas MTT requires separate replicates to be used for each time point. AB is non-toxic and does not interfere with viability, as is the case with the use of Trypan Blue, for example.
Alkaline phosphatase activity. Basal levels of cellular ALP activity of the MG-63 cells grown on the P(3HB)/n-BG composites were measured after 1, 7 and 14 days. The ALP study was conducted on two batches of samples, one batch in which the cell medium was non-osteogenic (used for the cell proliferation study) and the other batch containing osteogenic medium (i.e. non-osteogenic medium + 50 µg ml−1 of vitamin C + 10 mM of β-glycerophosphate). ALP was measured using a commercially available SensoLyte p-Nitrophenol phosphate (pNPP) Alkaline Phosphatase Assay kit (AnaSpec, USA). The kit acts as a colorimetric assay for detecting ALP with a phosphatase conjugated secondary antibody by using pNPP as a phosphatase substrate. Samples (n = 3) were prepared as per the manufacturer's protocol and ALP standard was prepared in a serial dilution of 1 : 50 and detected using an absorbance of 405 nm.
Osteocalcin measurements. Osteocalcin production of the cells grown on the substrates incubated in osteogenic and non-osteogenic medium was measured (n = 3) at 1, 7 and 14 days using a commercially available Gla-type osteocalcin EIA kit (TaKaRa Bio Inc., Japan). The GLA-type osteocalcin kit is an in vitro enzyme immunoassay kit for quantitative determination of human carboxylated type of osteocalcin (Gla-OC) in medium. The standard curve was obtained by preparing serial dilutions and reading the absorbance at 450 nm.
Specimen preparation for SEM. Polymeric and composite films were examined under SEM to observe MG-63 cell spreading and attachment on the surface of the samples. Day 4 and 7 specimens were fixed in 3 per cent glutaraldehyde in 0.1 M cacodylate buffer for 12 h at 4°C. Subsequent dehydration using a series of graded ethyl alcohols (50%, 70%, 90% and 100%) was performed. Samples were then critically point dried by immersion in hexamethyldisilazane for 2 min and left in a fume cupboard for 2 h for subsequent drying. The dried samples were then attached to aluminium stubs, gold coated and examined under SEM (JEOL 5610LV, JEOL, USA) at an acceleration voltage of 10–15 kV.
Statistical analysis. All data are expressed as mean ± s.d. The data were compared using Student's t-test and differences were considered significant when *p < 0.05, **p < 0.01 and ***p < 0.001. p > 0.05 was taken as indicating no significant difference.
3. Results
3.1. Microstructural analysis
The addition of n-BG particles is seen to change the surface morphology considerably compared with the P(3HB) samples by inducing a rough topography, as qualitatively examined by SEM (figure 1a–c). It is noted that the exposure of n-BG particles on the surface of the composites is high and, owing to their high surface reactivity, significantly improved the bioactivity of the developed composites, as discussed in subsequent sections. Agglomerations of n-BG particles were also visible on the composite surfaces (e.g. figure 1c). AFM was performed on selected samples to analyse the change in surface roughness induced by the presence of n-BG particles. Key results are presented in figure 2. Figure 2a and d shows the amplitude channel for P(3HB) and P(3HB)/20 wt % n-BG samples, respectively. From the amplitude channel (scan area of 10 × 10 µm2), the morphology of the polymeric film is clearly visible and complementary to the SEM images shown in figure 1. The height channel representations for the polymeric and composite films are shown in figure 2b and e, respectively, and the roughness over an area of 10 × 10 µm2 was measured for all samples. The r.m.s value as indicator of roughness for the entire scanned area was measured to be 186 ± 2 nm, 220 ± 10 nm and 364 ± 29 nm for P(3HB), P(3HB)/10 wt % n-BG and P(3HB)/20 wt % n-BG, respectively, quantitatively confirming the SEM observations. Similarly, the average deviations in roughness values are 148 ± 1 nm, and 292 ± 25 nm for P(3HB), P(3HB)/10 wt % n-BG and P(3HB)/20 wt % n-BG, respectively.
Figure 1.

SEM micrographs of (a) P(3HB), (b) P(3HB)/10 wt % n-BG and (c) P(3HB)/20 wt % n-BG.
Figure 2.

AFM images over a scan area of 10 × 10 µm2 showing the (a) amplitude channel for P(3HB) film, (b) height channel for P(3HB) film, (c) three-dimensional image of P(3HB) film showing the height and the phase channel superimposed, (d) amplitude channel for P(3HB)/20 wt % n-BG film, (e) height channel for P(3HB)/20 wt % n-BG film and (f) three-dimensional image of P(3HB)/20 wt % n-BG film showing the height and the phase channel superimposed.
3.2. In vitro degradation study
Water uptake (%WA; figure 3a), weight loss (%WL; figure 3b) and change in molecular weight (Mw) of the composites were monitored in this study. Both, the %WA and %WL significantly increased owing to the addition of n-BG particles. The highest water absorption was found to be 32 per cent for the 20 wt % n-BG composites, whereas the neat P(3HB) films had a much lower water uptake (max. 8%), confirming the hydrophobic nature of P(3HB). Similarly, weight loss measurements confirmed that increasing the concentration of n-BG particles increases the weight loss over the studied degradation time. Addition of bioactive glass particles (micron-sized, less than 5 µm) in the polymeric matrix slowed the molecular weight degradation compared to the P(3HB) on its own (see electronic supplementary material), when immersed in SBF for a period of up to 200 days.
Figure 3.

In vitro degradation study of P(3HB)/n-BG composites in SBF depicting (a) % water uptake and (b) % weight loss. Diamonds, P(3HB); squares, 10 wt % BG; triangles, 20 wt % BG.
3.3. In vitro bioactivity analysis
Figure 4 shows the SEM micrographs of specimen's surfaces at different time points after immersion in SBF. The nucleation of HA from the nanoscale bioactive glass particles is evident from the SEM micrographs. Figure 4a shows the presence of sub-micron HA nucleating from the n-BG particles, and also shows the homogeneous distribution of HA crystals over the surface. In figure 4e,f, the cross-section images of the samples confirmed the presence of a uniform layer (thickness <10 µm) of HA on the surface of 10 wt % and 20 wt % n-BG composites after 30 days. The XRD analysis of P(3HB)/n-BG samples (figure 5a) depicts an increase in the characteristic crystalline HA peak at 32° (2θ) over the immersion period in SBF. The formation of HA on the samples can be shown to occur from as early as 5 days in SBF, confirming the high bioactivity of the composites owing to the addition of n-BG particles. However, there were no changes observed in the X-ray diffraction pattern and SEM surface morphology for P(3HB) films during the study.
Figure 4.

SEM micrographs of P(3HB)/20 wt % n-BG composite samples upon immersion in SBF showing the surface changes owing to the formation of HA layer after (a) 5 days (scale bar, 5 µm), (b) 15 days (scale bar, 10 µm), (c) 30 days (scale bar, 10 µm) and (d) 45 days (scale bar, 100 µm). Cross sections of P(3HB)/n-BG films showing the presence of continuous HA layer after 30 days in SBF for (e) P(3HB)/10 wt % n-BG (scale bar, 50 µm) and (f) P(3HB)/20 wt % n-BG (scale bar, 20 µm).
Figure 5.

(a) XRD pattern of P(3HB)/n-BG composites highlighting the emergence of crystalline HA peak (denoted by vertical markers) after 5, 20 and 30 days of immersion in SBF. Results of EDX analysis for P(3HB)/20 wt % n-BG composites after 30 days in SBF showing elemental surface mapping of (b) Ca, (c) P, (d) Si, and (e) change in the Ca/P ratio of the HA layer on the composites over the immersion period in SBF.
Energy dispersive X-ray (EDX) analysis was conducted to observe the transition of bioactive glass particles to calcium phosphate as well as to detect the nature of the calcium phosphate formed by evaluating the Ca/P ratio for the layer formed on the surfaces upon immersion in SBF. Figure 5b–d shows the transition of bioactive glass particles to calcium phosphate through elemental mapping of Ca, P and Si over the surface of the composite. This change is depicted by the presence of calcium and phosphorus in a given area of the composite and by the depletion of silicon. The EDX results (figure 5e) revealed that the Ca/P ratio on the composite surface gradually increased, stabilizing at 1.58 after 30 days in SBF, indicating a non-stoichiometric HA layer.
The Raman spectroscopic analysis of the composite samples after 5, 10, 30 and 45 days in SBF is shown in figure 6. The HA characteristic (PO43−) peak at 964 cm−1 was found to increase with increasing immersion time in SBF. The gradual increase in the PO43− peak corresponds to the appearance of crystalline HA layer, which is also documented by the EDX, SEM and XRD results presented above. A typical Raman surface map of the HA layer (intensity distribution of PO43− peak at 964 cm−1 over a surface area of 70 × 60 µm2) for the P(3HB)/20 wt % n-BG composite is shown in figure 6b, revealing the distribution of HA on the surface of the composite.
Figure 6.

(a) Raman spectra of P(3HB)/20 wt % n-BG composites following 0–45 days immersion in SBF. (b) Raman surface intensity map of PO43− peak at 964 cm−1 for P(3HB)/20 wt % n-BG composites after 45 days of SBF immersion. The bright areas denote high intensities, whereas black areas denote low intensity of the PO43− peak. Raman map for 0 days not shown as there is no presence of PO43− peak.
3.4. Cytocompatibility studies
Results of the cytocompatibility study using MG-63 cells on the P(3HB)/n-BG composite surfaces are summarized in figure 7. Figure 7a,b shows cell proliferation to increase in all samples over the 7-day period. The relative cell proliferation data when compared with the control surface (tissue culture plastic) shown in figure 7b indicate that there was no significant difference between the control and the P(3HB) samples at any point during the study period. However, the presence of 20 wt % n-BG in the P(3HB) matrix induced a significant reduction in cell proliferation compared with the control.
Figure 7.

Cytocompatibility studies of P(3HB)/n-BG composites using MG-63 osteoblasts showing (a) cell proliferation measurements for 1, 4 and 7 days, using AB assay, (b) cell proliferation of all tested samples relative to the control (control set to 100%), (c) ALP activity for osteoblastic phenotype expression of MG-63 cells grown on P(3HB)/n-BG samples using osteogenic (O) and non-osteogenic (NO) medium. (d) Osteocalcin content of culture medium (osteogenic (O) and non-osteogenic (NO) medium) as a function of time. Measurements correspond to osteocalcin levels on days 7 and 14 (n = 3, error bars = ±s.d.; *p < 0.05, **p < 0.01, ***p < 0.001). (a) and (b) Violet, control; maroon, P(3HB); yellow, 10 per cent n-BG; light blue, 20 per cent n-BG.
ALP activity of the cells was measured for days 7 and 14, as an early marker of osteoblast differentiation (figure 7c). The ALP activity for all samples increased at day 14 with no detectable growth on day 1 (data not shown). The ALP activity was found to be significantly higher in osteogenic growth medium compared with non-osteogenic medium for both time points and for all samples (except for the control). In terms of osteoblastic response to the composite surface as function of n-BG content, it was found that the ALP activity of MG-63 cells was significantly higher than the control surface for days 7 and 14, with 20 wt % n-BG composites exhibiting the highest ALP activity.
The carboxylated-type of osteocalcin (i.e. carboxylated glutamic acid residues (Gla-OC)) produced by the MG-63 osteoblasts when grown on the composite substrates was quantified in this study. On culture day 1, expression of osteocalcin at low levels (average 15 ± 1 ng) was found in all groups (figure 7d), with no significant difference between the composite sample and the control. There was a significant (*p < 0.05) difference in the levels of osteocalcin in the osteogenic and non-osteogenic medium for all samples at day 7. A significant (*p < 0.05) decrease in osteocalcin levels (in non-osteogenic medium) by adding n-BG particles, compared with the control was also seen on day 7 measurements. On day 14, there was a significant increase in the levels of osteocalcin for all samples (up to 62 and 52% increase on average for osteogenic and non-osteogenic medium, respectively) without having any significant differences between the samples, for both types of medium. At all time points, no significant difference between the control and the P(3HB) samples was observed, thus proving the cytocompatibility of the material.
SEM micrographs of MG-63 cells attached on the surfaces of P(3HB) composites in figure 8 highlight the cell morphology and its attachment to the substrates between days 4 and 7. There were no visible qualitative differences in the attachment of cells between the neat polymeric and composite samples.
Figure 8.

SEM images showing MG-63 cells grown on (a) P(3HB) at day 4, (b) P(3HB) at day 7, (c) P(3HB)/20 wt % n-BG at day 4, and (d) P(3HB)/20 wt % n-BG at day 7. Scale bar, 100 µm.
4. Discussion
It has been shown in our earlier work (Misra et al. 2008; Schneider et al. 2008) that the incorporation of nanoscale fillers in a polymeric matrix enhances the mechanical strength as well as renders conducive surface properties (i.e. better wettability, nanotopography) for biomedical applications. The addition of n-BG particles to the P(3HB) matrix significantly changed the surface morphology owing to the exposure of the n-BG particles on the surface (figures 1 and 2). The presence of n-BG particles considerably increased the surface roughness of the composites, as determined by both SEM and AFM characterization. The increase of surface roughness plays an important role in cell attachment. This fact in turn had a contributing effect on the bioactivity, water uptake and cytocompatibility of the composite films and stays in line with observations on a similar nanocomposite based on nano tricalcium phosphate in poly(lactide-co-glycolic acid) (PLGA; Loher et al. 2006). It is important to note that bioactivity studies were not done in the cell culture medium (DMEM) but they were performed in SBF for a variety of reasons, one of which was that DMEM typically has a calcium content of about 1.82 mM as opposed to SBF at 2.5 mM. This higher Ca content will actively induce the formation of an apatitic bioactive layer on the surfaces, dependent on material surface properties as well as on the reaction of the material with the solution (Hench 1998). Testing of bioactivity of materials intended for bone tissue engineering in SBF is the most extended method in the biomaterials community (Kokubo et al. 1990). By testing in solutions of increasing complexity, i.e. SBF, which contains an ionic composition similar to that of blood plasma and DMEM, which also contains vital organic constituents in the form of proteins, the materials were tested in the appropriate medium according to the parameter under investigation. Thus, biomaterial surfaces are commonly tested in SBF, whereas DMEM is commonly applied where cell studies are considered.
In this context, pre-incubation or passivation of the materials in fully supplemented culture medium is required because of the organic protein content, which is lacking in SBF, which only consists of inorganic products. The importance of a modified protein layer upon a material surface is well recognized, which will help cells attach, spread, proliferate and differentiate upon the material, regardless of its original composition and any subsequent precipitation of inorganic apatite layers. The presence of proteins is essential to allow adequate cell attachment and valid in vitro cell assays to be performed. Indeed, a biomimetic apatite layer is also produced in DMEM containing serum, but is not as mature as that formed in SBF alone under the same conditions (Faure et al. 2009).
The %WL and %WA measurements of the composites after immersion in SBF were shown to increase on increasing the n-BG particle concentration. The observation also confirmed the hydrophobic nature of the polymer and its slow degradation over time (Freier et al. 2002). The increase in water uptake can be attributed to the increase in the hydrophilicity of the composites owing to the addition of n-BG (Misra et al. 2008), whereas the increased weight loss could be related to the dissolution of the n-BG particles, as previously reported for other composites (Loher et al. 2006; Li & Chang 2005a). The temporal variation in the weight average (Mw) and number average (Mn) molecular weight of the P(3HB)/bioactive glass (micron-sized particles) highlights the continuous drop in Mw without the characteristic induction period described by Doi et al. (1989) for the P(3HB) samples (see electronic supplementary material). The overall change in Mw for the composites followed first-order kinetics, with a half-life of 18 weeks. Although the size of the bioactive glass particles used for the Mw measurements was less than 5 µm, it provided valuable information about the buffering effect induced by the release of alkaline ions from the inorganic particles preventing the accelerated degradation because of the acidification of the medium owing to acidic products of the P(3HB) degradation (Gopferich 1996).
The release of ions (PO43−, Na+ and Ca2+) upon immersion of P(3HB)/n-BG composites in water was also examined using ion chromatography over the 45-day period and it was observed that the ion release was higher for 20 wt % n-BG composites than for 10 wt % n-BG composites. The graphs also show the classical two stage release with sodium being released rapidly and at early time points followed by a slower release of other ions (see electronic supplementary material).
The bioactivity of P(3HB)/n-BG composites was demonstrated in this investigation by monitoring the three different aspects, i.e. morphology (SEM), crystallinity (XRD) and chemistry (Raman spectroscopy and EDX). The bioactivity of the composites, determined by the formation of HA on the surface upon immersion in SBF, was confirmed within 5 days (figure 4a). The presence of a uniform layer (less than 10 µm) of HA on the surface was observed after 30 days, as shown in figure 4e,f. Formation of HA was also confirmed using XRD (figure 5a), wherein the intensity of the prominent crystalline peak from HA at (2θ = 31°–32°) increased by prolonging the immersion time. The calcium–phosphorus ratio (Ca/P) of the HA layer was evaluated at different time intervals using EDX. The Ca/P ratio increased to 1.58 after 30 days of immersion in SBF, which is lower than the Ca/P ratio of stoichiometric HA, i.e. 1.67. An elemental surface mapping for silicon, calcium and phosphorus in a fixed area highlighted the transition of bioactive glass to calcium phosphate (figure 5). Raman micro-spectroscopy has been shown to be sensitive towards the detection of HA (Clupper et al. 2004). The peak at 964 cm−1 (figure 6a) corresponds to the P–O symmetric stretching vibrations in PO43− groups in HA. This peak was found to increase with time (figure 6), which indicates the growth of the HA layer on the composite's surface. Raman spectroscopy analysis can be used as a convenient tool to monitor the bioactivity of samples in situ owing to the insensitivity of Raman spectra to the presence of water. The intensity map of wavelength 964 cm−1 confirms a strong degree of HA formation over the surface of the composite and hence further confirms high degree of bioactivity for the P(3HB)/n-BG composites. The high formation rate of HA layer on the P(3HB)/n-BG composites upon immersion in SBF is thought to be influenced by the high water-uptake capacity of the matrix, which further favours the dissolution of the bioactive glass nanoparticles.
Cell proliferation studies (cells grown on non-osteogenic medium), indicated the suitability of all the samples to allow for cell proliferation (figure 7a,b). In contrast to the addition of 10 wt % n-BG, addition of 20 wt % n-BG particles significantly reduced the proliferation of cells compared with the control (not less than 65% of the control) on days 1, 4 and 7. ALP activity and osteocalcin levels were further measured over a 14-day period to evaluate osteoblast activation and differentiation, as these monitors (ALP and osteocalcin) are the typical markers for osteoblast characterization (Cowles et al. 1998; Malaval et al. 1999). In terms of osteoblastic response to the composite surface as a function of n-BG content, it was found that the ALP activity of MG-63 cells in the P(3HB)/n-BG group was significantly higher than the control surface for days 7 and 14, with the presence of 20 wt % n-BG causing the highest increase (figure 7c). The addition of n-BG particles induced topographical features (change in roughness) on the surface that might help the anchorage and attachment of the cells to the surface. The increase in ALP activity was also significantly higher for cells grown in osteogenic medium than for cells grown in non-osteogenic medium and was also higher for cells grown on the P(3HB)/n-BG groups indicating the materials alone may have initiated a greater production/expression of osteocalcin by the cells. Multiple studies have suggested that ALP activity is enhanced when osteoblasts are grown on bioactive glass substrates (Loty et al. 2001; Bosetti & Cannas 2005). A possible reason for the increased bone formation around bioactive glass implants is either the enhanced attachment of bone to the bioactive glass owing to the high surface reactivity of the glass or owing to exposure to the glass dissolution products, which enhances osteoblastic differentiation that affects cell gene expression (Xynos et al. 2001; Bosetti & Cannas 2005). Similar results using mesenchymal stem cells have reported higher ALP activity for PLGA/BG foams in comparison to PLGA foams (Reilly et al. 2007). Yang et al. (2006) also showed that poly(dl-lactic acid) (PDLLA) foams containing 5 wt % BG (micron-sized) were much more effective in increasing ALP activity than 40 wt % BG/PDLLA foams.
Osteocalcin constitutes about 15 per cent of the non-collagenous bone matrix proteins and is produced exclusively in osteoblasts and odontoblasts (Price 1989). It is suggested that when there is increased bone formation, the serum osteocalcin concentration also increases (Deftos et al. 1982). In this study, osteocalcin production was higher for samples incubated in osteogenic medium compared with non-osteogenic medium, with the level of osteocalcin for all the samples being significantly higher on day 14 (figure 7d). There was no significant change (compared with the control) in the osteocalcin production owing to the addition of n-BG particles. In a similar study, Schneider et al. (2008) did not find significantly different in vitro osteocalcin levels when comparing PLGA and composites containing up to 40 wt % tricalcium phosphate nanoparticles while using osteogenic medium. However, there was a significant decrease in osteocalcin production on day 7 for the P(3HB)/n-BG samples compared with the control surface, when incubated in a non-osteogenic medium. Similar levels of osteocalcin were also produced by mouse osteoblast cell lines when grown on collagen foams (Arpornmaeklong et al. 2007) and on P(3HB-co-3HV) substrates (Kose et al. 2003). The increase in osteocalcin as observed in figure 7d is indicative of the maturation of the cells and their osteoblastic phenotype and also complements the increase of ALP activity of MG-63 cells on day 14. Finally, the ALP and the osteocalcin measurements suggest that the osteogenic medium facilitated a better growth and differentiation medium than the non-osteogenic medium for MG-63 osteoblasts. In vivo studies (subcutaneous implants in rats) were also conducted on the newly isolated P(3HB) showing a non-toxic and a foreign body response (see electronic supplementary material). Further experiments involving three-dimensional P(3HB)/BG foams (scaffolds) are presently being conducted to ascertain the in vivo response of the composite structures.
5. Conclusions
The main conclusions from this experimental study can be summarized as follows.
Addition of n-BG particles to P(3HB) significantly changes the surface morphology of the composites, which further enhanced the %WA, bioactivity, and %WL.
The bioactive HA layer formation in contact with SBF was found to be uniformly distributed over the entire surface on the P(3HB)/n-BG composites at an early stage of immersion and was shown to grow (less than 10 µm thickness) over the period of 45 days.
Cytocompatibility study of P(3HB)/n-BG composites highlighted the ability of the MG-63 cells to attach, proliferate and differentiate on all substrates. In most cases, the results were similar to the control surface and further strengthened the use of the composites as a suitable material to develop scaffolds for hard tissue applications.
Acknowledgements
The authors gratefully acknowledge the financial help of Overseas Research Scholarship, IDEA League Research Grant and Gebert Rüf Foundation GRS 048/04. Assistance from Xin Zhao and Dr Graham Palmer (Eastman Dental Institute, UCL, London) was instrumental in conducting the Raman spectroscopy measurements. Support of Dr Thurecht Kristofer (University of Nottingham) for molecular weight analysis is greatly appreciated. The assistance of Mr Nick Royall (Imperial College, London) for EDX analysis is also acknowledged. The authors are very grateful to the referees for their valuable and informative comments and we feel the edits to the manuscript as a result of their suggestions has added greatly to the scientific value of our paper.
References
- Arpornmaeklong P., Suwatwirote N., Pripatnanot P., Oungbho K. 2007. Growth and differentiation of mouse osteoblasts on chitosan–collagen sponges. Int. J. Oral Maxillofac. Surg. 36, 328–337. ( 10.1016/j.ijom.2006.09.023) [DOI] [PubMed] [Google Scholar]
- Barrere F., Mahmood T. A., de Groot K., van Blitterswijk C. A. 2008. Advanced biomaterials for skeletal tissue regeneration: instructive and smart functions. Mater. Sci. Eng. R 59, 38–71. ( 10.1016/j.mser.2007.12.001) [DOI] [Google Scholar]
- Blaker J. J., Gough J. E., Maquet V., Notingher I., Boccaccini A. R. 2003. In vitro evaluation of novel bioactive composite based on Bioglass filled polylactide foams for bone tissue engineering scaffolds. J. Biomed. Mater. Res. Part A 67, 1401–1411. ( 10.1002/jbm.a.20055) [DOI] [PubMed] [Google Scholar]
- Bosetti M., Cannas M. 2005. The effect of bioactive glasses on bone marrow stormal cells differentiation. Biomaterials 26, 3873–3879. ( 10.1016/j.biomaterials.2004.09.059) [DOI] [PubMed] [Google Scholar]
- Brunner T. J., Grass R. N., Stark W. J. 2006. Glass and bioglass nanopowders by flame synthesis. Chem. Commun. 13, 1384–1386. ( 10.1039/b517501a) [DOI] [PubMed] [Google Scholar]
- Chen G. Q., Wu Q. 2005. The application of polyhydroxyalkanoate as tissue engineering materials. Biomaterials 26, 6565–6578. ( 10.1016/j.biomaterials.2005.04.036) [DOI] [PubMed] [Google Scholar]
- Clupper D. C., Gough J. E., Embanga P. M., Notingher I., Hench L. L., Hall M. M. 2004. Bioactive evaluation of 45S5 bioactive glass fibers and preliminary study of human osteoblast attachment. J. Mater. Sci. Mater. Med. 15, 803–808. ( 10.1023/B:JMSM.0000032821.32577.fc) [DOI] [PubMed] [Google Scholar]
- Couto D. S., Hong Z., Mano J. F. 2009. Development of bioactive and biodegradable chitosan-based injectable systems containing bioactive glass nanoparticles. Acta Biomater. 5, 115–123. ( 10.1016/j.actbio.2008.08.006) [DOI] [PubMed] [Google Scholar]
- Cowles E. A., DeRome M. E., Pastizzo G., Brailey L. L., Gonowicz G. A. 1998. Mineralization and the expression of matrix proteins during in vivo bone development. Calcif. Tissue Int. 62, 74–82. ( 10.1007/s002239900397) [DOI] [PubMed] [Google Scholar]
- Deftos L. J., Parthemore J. G., Price P. A. 1982. Changes in plasma bone GLA protein during treatment of bone disease. Calcif. Tissue Int. 34, 121–124. ( 10.1007/BF02411221) [DOI] [PubMed] [Google Scholar]
- Doi Y., Kanesawa Y., Kawaguchi Y., Kunioka M. 1989. Hydrolytic degradation of microbial poly(hydroxyalkanoates). Makrom. Chem. Rapid. Commun. 10, 227–230. ( 10.1002/marc.1989.030100506) [DOI] [Google Scholar]
- Faure J., Balamurugan A., Benhayoune H., Torres P., Balossier G., Ferreira J. M. F. 2009. Morphological and chemical characterisation of biomimetic bone like apatite formation on alkali treated Ti6Al4V titanium alloy. Mater. Sci. Eng. C 29, 1252–1257. ( 10.1016/j.msec.2008.09.047) [DOI] [Google Scholar]
- Freier T., Kunze C., Nischan C., Kramer S., Sternberg K., Sab M., Hopt U. T., Schmitz K. P. 2002. In vitro and in vivo degradation studies for development of a biodegradable patch based on poly(3-hydroxybutyrate). Biomaterials 23, 2649–2657. ( 10.1016/S0142-9612(01)00405-7) [DOI] [PubMed] [Google Scholar]
- Gopferich A. 1996. Mechanisms of polymer degradation and erosion. Biomaterials 17, 103–114. ( 10.1016/0142-9612(96)85755-3) [DOI] [PubMed] [Google Scholar]
- Guarino V., Causa F., Ambrosio L. 2007. Bioactive scaffolds for bone and ligament tissue. Exp. Rev. Med. Devices 4, 405–418. ( 10.1586/17434440.4.3.405) [DOI] [PubMed] [Google Scholar]
- Helen W., Gough J. E. 2006. In vitro studies of annulus fibrosus disc cell attachment, differentitation and matrix production on PDLLA/45S5 Bioglass composite films. Biomaterials 27, 5220–5229. ( 10.1016/j.biomaterials.2006.06.008) [DOI] [PubMed] [Google Scholar]
- Hench L. L. 1998. Biomaterials: a forecast for the future. Biomaterials 19, 1419–1423. ( 10.1016/S0142-9612(98)00133-1) [DOI] [PubMed] [Google Scholar]
- Knowles J. C., Hastings G. W. 1992. In vitro degradation of polyhydroxybutyrate/polyhydroxyvalerate copolymer. J. Mater. Sci. Mater. Med. 3, 352–358. ( 10.1007/BF00705367) [DOI] [Google Scholar]
- Kokubo T., Kushitani H., Sakka S., Kitsugi T., Yamamuro T. 1990. Solutions able to reproduce in vivo surface structure changes in bioactive glass ceramic A-W. J. Biomed. Mater. Res. 24, 721–734. ( 10.1002/jbm.820240607) [DOI] [PubMed] [Google Scholar]
- Kose G. T., Korkusuz F., Korkusuz P., Purali N., Ozkul A., Hasirci V. 2003. Bone generation on PHBV matrices: an in vitro study. Biomaterials 24, 4999–5007. ( 10.1016/S0142-9612(03)00417-4) [DOI] [PubMed] [Google Scholar]
- Li H., Chang J. 2005a. In vitro degradation of porous degradable and bioactive PHBV/Wollastonite composite scaffolds. Polym. Degrad. Stabil. 87, 301–307. ( 10.1016/j.polymdegradstab.2004.09.001) [DOI] [Google Scholar]
- Li H., Chang J. 2005b. pH-compensation effect of bioactive inorganic fillers on the degradation of PLGA. Compos. Sci. Technol. 65, 2226–2232. ( 10.1016/j.compscitech.2005.04.051) [DOI] [Google Scholar]
- Liu A., Hong Z., Zhuang X., Chen X., Cui Y., Liu Y., Jing X. 2008. Surface modification of bioactive glass nanoparticles and the mechanical and biological properties of poly(l-lactide) composites. Acta Biomat. 4, 1005–1015. ( 10.1016/j.actbio.2008.02.013) [DOI] [PubMed] [Google Scholar]
- Loher S., Reboul V., Brunner T. J., Simonet M., Dora C., Neuenschwander P., Stark W. J. 2006. Improved degradation and bioactivity of amorphous aerosol derived tricalcium phosphate nanoparticles in poly(lactide-co-glycolide). Nanotechnology 17, 2054–2061. ( 10.1088/0957-4484/17/8/044) [DOI] [Google Scholar]
- Loty C., et al. 2001. Bioactive glass stimulates in vitro osteoblast differentiation and creates a favorable template for bone tissue formation. J. Bone Miner. Res. 16, 231–239. ( 10.1359/jbmr.2001.16.2.231) [DOI] [PubMed] [Google Scholar]
- Luklinska Z. B., Bonfield W. 1997. Morphology and ultrastructure of the interface between hydroxyapatite-polyhydroxybutyrate composite implant bone. J. Mater. Sci. Mater. Med. 8, 379–383. ( 10.1023/A:1018589018205) [DOI] [PubMed] [Google Scholar]
- Malaval L., Liu F., Roche P., Aubin J. E. 1999. Kinetics of osteoprogenitor proliferation and osteoblast differentiation in vitro. J. Cell. Biochem. 74, 616–627. ( 10.1002/(SICI)1097-4644(19990915)74:4%3C616::AID-JCB11%3E3.0.CO;2-Q) [DOI] [PubMed] [Google Scholar]
- Misra S. K., Valappil S. P., Roy I., Boccaccini A. R. 2006. Polyhydroxyalkanoate (PHA)/inorganic phase composites for tissue engineering applications. Biomacromolecules 7, 2249–2258. ( 10.1021/bm060317c) [DOI] [PubMed] [Google Scholar]
- Misra S. K., Mohn D., Brunner T. J., Stark W. J., Philip S. E., Roy I., Salih V., Knowles J. C., Boccaccini A. R. 2008. Comparison of nanoscale and microscale bioactive glass on the properties of P(3HB)/Bioglass composites. Biomaterials 29, 1750–1761. ( 10.1016/j.biomaterials.2007.12.040) [DOI] [PubMed] [Google Scholar]
- Price P. A. 1989. Gla containing proteins of bone. Connect. Tissue Res. 21, 51–57. ( 10.3109/03008208909049995) [DOI] [PubMed] [Google Scholar]
- Reilly G. C., Radin S., Chen A. T., Ducheyne P. 2007. Differential alkaline phosphatase response of rat and human bone marrow derived mesenchymal stem cells to 45S5 bioactive glass. Biomaterials 28, 4091–4097. ( 10.1016/j.biomaterials.2007.05.038) [DOI] [PMC free article] [PubMed] [Google Scholar]
- Rezwan K., Chen Q. Z., Blaker J. J., Boccaccini A. R. 2006. Biodegradable and bioactive porous polymer/inorganic composite scaffolds for bone tissue engineering. Biomaterials 27, 3413–3431. ( 10.1016/j.biomaterials.2006.01.039) [DOI] [PubMed] [Google Scholar]
- Schneider O. D., Loher S., Brunner T. J., Uebersax L., Simonet M., Grass R. N., Merkle H. P., Stark W. J. 2008. Cotton wool like nanocomposite biomaterials: in vitro bioactivity and osteogenic differentiation of human mesenchymal stem cells. J. Biomed. Mater. Res. Part B 84, 350–362. [DOI] [PubMed] [Google Scholar]
- Valappil S. P., Misra S. K., Boccaccini A. R., Keshvaraz T., Bucke C., Roy I. 2007. Large scale production and efficient recovery of PHB with desirable material properties, from the newly characterised Bacillus cereus SPV. J. Biotechnol. 132, 251–258. ( 10.1016/j.jbiotec.2007.03.013) [DOI] [PubMed] [Google Scholar]
- Waltimo T., Brunner T. J., Vollenweider M., Stark W. J., Zehnder M. 2007. Antimicrobial effect of nanometric bioactive glass 45S5. J. Dental Res. 86, 754–757. ( 10.1177/154405910708600813) [DOI] [PubMed] [Google Scholar]
- Wang Y. W., Wu Q., Chen J., Chen G. Q. 2005. Evaluation of three-dimensional scaffolds made of blends of hydroxyapatite and poly(3-hydroxybutyrate-co-3hydroxyhexanoate) for bone reconstruction. Biomaterials 26, 899–904. ( 10.1016/j.biomaterials.2004.03.035) [DOI] [PubMed] [Google Scholar]
- Williams S. F., Martin D. P. 2002. Applications of PHAs in medicine and pharmacy. In Biopolymers: polyesters III, vol. 4 (eds Doi Y., Steinbüchel A.), p. 91 Weinheim, Germany: Wiley. [Google Scholar]
- Xiao X. Q., Zhao Y., Chen G. Q. 2007. The effect of 3-hydroxybutyrate and its derivatives on the growth of glial cells. Biomaterials 28, 3608–3616. ( 10.1016/j.biomaterials.2007.04.046) [DOI] [PubMed] [Google Scholar]
- Xynos I. D., Edgar A. J., Buttery L. D. K., Hench L. L., Polak J. M. 2001. Gene expression profiling of human osteoblasts following treatment with the ionic products of Bioglass 45S5 dissolution. J. Biomed. Mater. Res. 55, 151 ( 10.1002/1097-4636(200105)55:2%3C151::AID-JBM1001%3E3.0.CO;2-D) [DOI] [PubMed] [Google Scholar]
- Yang X. B., Webb D., Blaker J. J., Boccaccini A. R., Maquet V., Cooper C., Oreffo R. O. C. 2006. Evaluation of human bone marrow stromal cell growth on biodegradable polymer/Bioglass composites. Biochem. Biophys. Res. Commun. 342, 1098–1107. ( 10.1016/j.bbrc.2006.02.021) [DOI] [PubMed] [Google Scholar]