

Abstract
Many cephalopods exhibit remarkable dermal iridescence, a component of their complex, dynamic camouflage and communication. In the species Euprymna scolopes, the light-organ iridescence is static and is due to reflectin protein-based platelets assembled into lamellar thin-film reflectors called iridosomes, contained within iridescent cells called iridocytes. Squid in the family Loliginidae appear to be unique in which the dermis possesses a dynamic iridescent component with reflective, coloured structures that are assembled and disassembled under the control of the muscarinic cholinergic system and the associated neurotransmitter acetylcholine (ACh). Here we present the sequences and characterization of three new members of the reflectin family associated with the dynamically changeable iridescence in Loligo and not found in static Euprymna iridophores. In addition, we show that application of genistein, a protein tyrosine kinase inhibitor, suppresses ACh- and calcium-induced iridescence in Loligo. We further demonstrate that two of these novel reflectins are extensively phosphorylated in concert with the activation of iridescence by exogenous ACh. This phosphorylation and the correlated iridescence can be blocked with genistein. Our results suggest that tyrosine phosphorylation of reflectin proteins is involved in the regulation of dynamic iridescence in Loligo.
Keywords: iridescence, biochemistry, dynamic, phosphorylation
1. Introduction
Structural coloration, or iridescence, is widespread across metazoa, from insects and marine invertebrates to fishes and birds (Denton 1970; Osorio & Ham 2002; Mäthger et al. 2003; Vukusic & Sambles 2003). Reflective cells, called iridocytes, typically contain stacks of platelets, or iridosomes, composed of different high refractive index materials in different organisms. These stacks of platelets function as iridescent Bragg reflectors (Huxley 1968; Land 1972; Mirow 1972; Cloney & Brocco 1983). The iridosomes in fish, amphibians and reptiles contain oblong, extracellular purine crystals nested in spaces in reticulated cells (Rohrlich & Rubin 1975; Menter et al. 1979; Kobelt & Linsenmair 1986; Mäthger et al. 2003), whereas in insects layers of microstructured cuticular chitin serve the same optical function (Vigneron et al. 2005). In organisms such as lizards, iridescence can be modulated with mobile chromatophore cells acting as shutters, but the iridescent structures themselves remain immobile (Carlton 1903). Uniquely, loliginid squid can actuate the structures responsible for iridescence, turning the optical effect off and on under the control of muscarinic acetylcholine receptors (mAChRs). Accordingly, exogenous acetylcholine (ACh) and calcium ionophores induce iridescence in these species (Mäthger et al. 2004; figure 1). We know of no other organisms in which the iridescent structures themselves are assembled and disassembled under fast control, rather than slightly modulated or shuttered (Mäthger et al. 2003).
Figure 1.
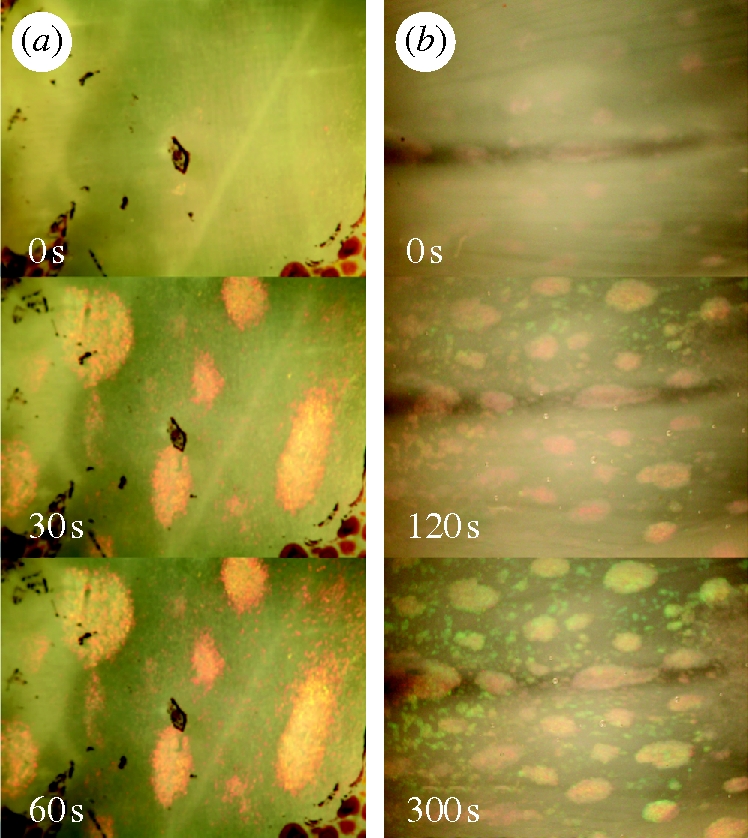
Effect of ACh and calcium ionophore on Loligo dynamic iridescence. (a) Reflectivity of squid skin increases upon addition of exogenous 10 µM ACh. (b) The same effect is observed upon addition of a calcium ionophore (A23187, 15 µM final concentration) supplemented with calcium chloride (4 mM). Time following addition indicated in lower left of each panel. Each panel shows approximately a 1 cm2 patch of skin.
In contrast to the purine crystals found in vertebrates and layered chitin found in insects, squid iridophore platelets are proteinaceous. Crookes and colleagues characterized the proteinaceous constituents of the static light-organ iridosomes of the bobtail squid Euprymna scolopes, and named this group of proteins ‘reflectins’ (Crookes et al. 2004). Subsequent work has shown that the dynamic iridosomes of the loliginids are also proteinaceous, and that their dynamic behaviour is regulated by ACh-dependent muscarinic-type G-protein-coupled receptors (Mäthger et al. 2004). Activation of the loliginid iridophore layer by the neurotransmitter ACh leads to a dramatic increase in reflectance (Cooper et al. 1990). Because nicotinic-type receptors that characterize the neuromuscular junction do not affect dynamic iridescence, this optical change is not attributed to muscular contraction, as is the case for chromatophore signalling in squid (Messenger 2001; Mäthger et al. 2004). In addition, isolated reflectin proteins exhibit unusual solubility and self-association properties (Kramer et al. 2007). All these data suggest that the proteinaceous nature of iridosomes in loliginids may contribute to their dynamic ability to modulate their iridescent effects. To better understand the biochemical and biophysical bases of dynamic iridescence in loliginids, we have sought to characterize the protein targets of the muscarinic ACh signal transduction cascade as well as the downstream effects on reflectins resulting from this cascade.
Here we report that ACh-mediated signalling induces changes in the phosphorylation state of Loligo reflectin proteins, and that phosphorylation is concomitant with the dynamic changes in the optical properties of Loligo skin. These changes in phosphorylation can be inhibited with genistein, a potent kinase inhibitor. We hypothesize that the mechanism leading to reflectin aggregation and increased skin iridescence may be linked to protein charge neutralization via addition of phosphates upon ACh activation, suggesting a biochemical and biophysical mechanism for dynamic iridescence in loliginid squid. Although it has long been known that post-translational protein modifications can lead to aggregation, opacity and disease in ocular and neuronal tissues (e.g. Haass & Selkoe 1993; Takemoto & Boyle 2000), this is the first suggestion of a functional and reversible post-translational modification leading to aggregation and the consequent control of an important optical function.
2. Material and methods
2.1. Biological material
Specimens of the Longfin Inshore Squid, Loligo pealeii, collected from coastal waters at Woods Hole, MA, were used for all the experiments. Escherichia coli strain TOP10 (Invitrogen, Carlsbad, CA, USA) cells were used for all recombinant DNA manipulations.
2.2. Protein preparation
Freshly isolated and physically responsive iridophore layers from L. pealeii were homogenized using mortar and pestle in liquid nitrogen. Tissue homogenates were resuspended in suspension buffer (phosphate-buffered saline containing 1 mM dithiothreitol (DTT), Phosphatase Inhibitor Cocktails I and II (EMD Bioscience, San Diego, CA, USA) and complete protease inhibitor (Roche, Indianapolis, IN, USA), and then centrifuged at 13 500 r.p.m. for 15 min at 4°C in a F45-30-11 rotor (Eppendorf, Westbury, NY, USA). The resulting pellet containing the reflectin proteins was resuspended and washed with suspension buffer to remove any residual soluble proteins. This crude reflectin extract was further processed by dissolving the pellet in buffer A (8 M urea, 2 mM DTT, complete protease inhibitor and 30 mM Z-(N-morpholino) ethanesulphonic acid (MES)-NaOH pH 5.5) and centrifuged as mentioned above. The residual insoluble material was hydrolysed with 6 N hydrochloric acid (110°C; 16 h) and analysed with a Beckman System 6300 amino acid analyser with a cation exchange column, HiTrapSP, connected to an ÄKTA purifier (GE Healthcare, NY, USA) with 0–50 % of buffer B (8 M urea, 2 mM DTT, complete protease inhibitor (Roche), 2 M NaCl and 30 mM MES-NaOH pH 5.5). Fractions containing reflectin A1 and A2 were identified by Western blotting with an antibody against the reflectin first purified and identified from Euprymna scolopes (Crookes et al. 2004) and collected for further purification. Pooled fractions were concentrated by centrifugation (Ultracon; Millipore Corp., Billerica, MA, USA) and further purified with a C18 reverse-phase column equilibrated with buffer C (0.1% TFA in water) and a 30–50 % gradient of buffer D (0.1% TFA in 95% acetonitrile). The resulting purified proteins were lyophilized and stored at −80°C until use. Purification was monitored by sodium dodecyl sulphate–polyacrylamide gel electrophoresis (SDS–PAGE) with a 10–20 % acrylamide gradient gel. Prior to SDS–PAGE, the proteins were dissolved in SDS–PAGE sample buffer (Invitrogen). Protein concentration was measured using a Bio-Rad Protein Assay Kit (Bio-Rad) or a two-dimensional Quant Kit (GE Healthcare).
To prepare samples for quantification of phosphorylation level, powdered frozen iridophore layers were directly dissolved in SDS–PAGE sample buffer containing DTT, protease inhibitor and phosphatase inhibitors. Following incubation at 98°C for 10 min, the samples were centrifuged as mentioned above, and the resulting supernatants were recovered for analysis. Preparation of RNA and cDNA messenger RNA was purified from the freshly isolated iridophore layer of L. pealeii. Iridophore layers were dissected from live squid and stored in RNAlater (Qiagen, Valencia, CA, USA) at 4°C or −80°C until use. Total RNA was isolated using TriZol (Invitrogen) followed by RNeasy (Qiagen) for further purification. First-strand cDNA was synthesized using Super-Script III RT (Invitrogen) with an oligo(dT)20 primer. A BD SMART RACE cDNA amplification kit (Clontech, Mountain View, CA, USA) was used to prepare rapid amplification of complementary DNA ends (RACE)-ready cDNA. All the procedures were performed according to the manufacturers' instructions.
2.3. Amino acid sequencing and gene cloning
To clone reflectin A2, several primers were designed based on the consensus sequence information obtained from E. scolopes and L. forbesi reflectins, and the following primer was successfully used to obtain the sequence in this manuscript (Lp2-1, ATGAACCGCTCTATGAACAGATACC). PCR using primer Lp2-1 and oligo-dT was performed using single-strand cDNA as a template. The resulting PCR product contained the 3′ region of the reflectin A2 gene. To clone the 5′ end of the gene, an internal primer from the resulting PCR product was designed for rapid amplification of cDNA ends (RACE) (GTCCATCCAGCGTCCCTGCATGTCCATCTGATAGCCGGACAT).
To obtain the nucleotide sequence of reflectin A1, an internal amino acid sequence of protein purified using the method above was determined by Edman degradation following trypsin digestion and high-performance liquid chromatography (HPLC) purification. This procedure was performed at the PAN facility at Stanford University (Stanford, CA, USA). Based on the resulting internal amino acid sequences, primers were designed for RACE PCR (for 3′ RACE, TAYAAYAAYGCNTTYTCNCARATGTGGCA and TAYAAYAAYGCNTTYAGNCARATGTGGCA; for 5′ RACE, TGCCACATYTGNGARAANGC). For RACE PCR, a SMART RACE cDNA Amplification Kit was used. Additional sets of primers were designed to anneal regions (Lp1-F, GTCTCCTTCGAGAACGCATGCCCTGTTGTCCGGG; Lp1-R, GGAAAATGTCCGGTTTCATTTTGAACATGCCACGCCC; Lp2-F, GTCTCACACGAGAACAAAACCTCGAAGCCACC; Lp2-R, CCCACAATTCCCAGTTGACATATATCCGACCGCC). PCR products were cloned into pCR2.1 vector (Invitrogen) using TA cloning. The sequence of the inserted fragment was analysed with an ABI 3730 Capillary Electrophoresis Genetic Analyser (Applied Bioscience) at the DNA sequencing facility at the University of California, Davis. Sequence data were analysed using MacVector (Accelrys Software Inc.).
To determine the sequence of reflectin B1, we obtained de novo sequence using LCMS/MS (liquid chromatogtraphy followed by two-dimensional mass spectrometry). Following HPLC, purified reflectin B1 was digested with sequence-grade trypsin (Roche) in 0.02 per cent SDS and 50 mM Tris–HCl, pH 8.5, at a ratio of 50 : 1. Peptides derived from this digestion were separated with a PepMapC18 HPLC column. Each fraction was applied to a Waters Micromass QTOF2 tandem mass spectrometer equipped with a nanoflow electrospray ionization source coupled to an Agilent 1100 nano LC system with a Zorbax 300SB-C18 column that was 150 × 0.075 mm with 3.5 µm particle size. Based on the obtained amino acid sequences (TTYGCNGAYGGNATGTAYMG) and (TTYATGGAYATGCAYTAYGAYGGNATGGGNATG) were used as primers for RACE-PCR performed against single-strand iridophore cDNA as described above. The resulting DNA sequences were deposited in GenBank under accession numbers FJ824804, FJ824805 and FJ824806.
2.4. Computational methods
We computationally predicted the potential phosphorylation sites of our novel reflectin sequences using NetPhos 2.0 (Blom et al. 1999, 2004). Hydropathy profiles were generated and transmembrane regions were predicted using TMHMM (Sonnhammer et al. 1998). Calcium-binding sites were predicted using Pfam (Finn et al. 2008). The cytoplasm–membrane interface affinities of the new reflectin protein sequences were analysed using MPEx software (Jaysinghe et al. 2006) with water-to-lipid partitioning and a 13-amino acid window.
2.5. One- and two-dimensional polyacrylamide gel electrophoresis
Protein samples were prepared from either ACh-treated (iridescent) or untreated (not iridescent) iridophore layers of L. pealeii. Iridophore layers were powdered using a mortar-and-pestle under liquid nitrogen, and then solubilized with DeStreak Rehydration Solution (GE Healthcare), followed by centrifuging to remove the residual insoluble materials. Following treatment with DeStreak Rehydration Solution, the protein concentration was determined with a two-dimensional Quant Kit (GE Healthcare). For first-dimension isoelectric focusing (IEF), the soluble component was loaded onto an Immobiline DryStrip gel (GE Healthcare) (pH 6–11; 60 µg of total protein), followed by SDS–PAGE separation with a 10–20 % gradient gel (Bio-Rad). For IEF, a Multiphor II Electrophoresis Unit (GE Healthcare) was used. Following two-dimensional PAGE, gels were analysed either by staining for phospho-amino acids with Pro-Q Diamond (Molecular Probes, Inc.) or by immunodetection of phosphotyrosine. All the experiments were performed in triplicate and the results reported are representative of those obtained. One-dimensional PAGE was performed using only the second step of this two-dimensional PAGE protocol.
2.6. Immunoblotting
Immunoblotting was performed with either anti-reflectin polyclonal antibodies or horseradish peroxidase (HRP)-conjugated anti-phosphotyrosine primary antibodies (HRP-PY20) (BD Transduction Laboratories, San Jose, CA, USA). Following one-dimensional SDS–PAGE or two-dimensional PAGE, proteins were electroblotted from the acrylamide gel to a polyvinylidene fluoride (PVDF) membrane. This PVDF membrane was blocked with 1 per cent BSA in PBST (0.1% Tween-20 in PBS) for 1 h at room temperature, then incubated in PBST containing a 1 : 5000 dilution of primary antibody for at least 1 h at room temperature on a rocking platform. The membrane was then washed three times with PBST to remove unbound and non-specifically bound antibodies. For the use of anti-reflectin polyclonal antibodies, a secondary antibody (alkaline phosphatase-conjugated antirabbit) was used to identify immunopositive bands. For alkaline phosphatase detection, a 1 : 50 dilution of NBT/BCIP stock solution (Roche) in alkaline phosphatase buffer (10 mM MgCl2, 100 mM Tris–HCl, pH 9.0) was used. Following sufficient development, the reaction was terminated by adding stop solution (10 mM Tris–HCl, 1 mM EDTA, pH 8). For HRP detection, an ECL kit was used (GE Healthcare). All the experiments were performed in triplicate and the results reported are identified either as the averages of the normalized results or as representative of those obtained.
2.7. Imaging analyses with fluorescent dye
For analysis of staining with fluorescent dyes a Molecular Imager FX with Quantity One software for image analysis (Bio-Rad Laboratories, Hercules, CA, USA) was used. ImageJ (NIH) was used to quantify the immunoblot signal intensity.
2.8. Quantification of phosphorylation level
To quantify relative levels of reflectin phosphorylation, two different techniques were used: signal intensities of reflectin staining obtained with Pro-Q Diamond stain or normalized signal intensities obtained by Western blotting with HRP-PY20 were measured and normalized to the respective signal intensities obtained from protein quantification with SYPRO Ruby (Molecular Probes) stain, thereby providing the relative phosphorylation level per protein. Values for samples treated with ACh and/or genistein were further normalized to those obtained for the corresponding non-ACh-treated samples.
2.9. Mass spectroscopy mapping for phosphorylation sites
Mass spectroscopy was used to identify the specifically phosphorylated residues. Partially purified reflectin A1 and A2 were subjected to trypsin digestion followed by matrix-assisted laser desorption/ionization-time of flight mass spectroscopy (MALDI-TOF MS). All the mapping analyses were performed at the Stanford Proteomics and Integrative Research Facility, Stanford University.
2.10. Activation of adaptive iridescence and the effects of protein kinase inhibitors on iridescence
Squid tissue samples were prepared identically for all adaptive iridescence experiments. The superficial chromatophore- and iridophore-containing layers of skin were surgically removed from freshly killed squid and the iridophore-containing layer trimmed to size to fit the Sylgard-lined incubation tray used in each experiment.
To activate iridescence, specimens of explanted iridophore-containing layers were transferred either to artificial sea water (500 mM NaCl, 10 mM CaCl2, 10 mM KCl, 12 mM MgCl2 and 10 mM HEPES, pH 8.0) or to 0.2 µm-filtered natural sea water followed by the addition of ACh (Sigma, St Louis, MO, USA) to a final concentration of 10 µM. To investigate the effects of various kinase inhibitors, iridophore layer samples were pre-soaked with individual kinase inhibitors prior to the addition of ACh for at least 20 min at room temperature at concentrations as indicated in figure 2. All the kinase inhibitors and the calcium ionophore A23187 were purchased from EMD Bioscience.
Figure 2.

Quantification of effects of ACh and genistein on dynamic iridescence. (a) Dose-dependency of dynamic iridescence on genistein, a broad-spectrum protein kinase inhibitor. Brightness is in arbitrary units. (b) Reflectance of Loligo skin as a function of time following the simultaneous addition of ACh and genistein. (c) Reflectance of Loligo skin as a function of time following the addition of ACh alone. While error bars are not possible because no two patches of squid skin have identical iridophore patterning, the results shown here are representative of a typical patch of squid skin.
Spectral reflectance measurements before and after the addition of ACh were obtained with a fibre-optic spectrometer (USB2000, Ocean Optics, USA; spectra recorded on PC, using OOIBase 32 software) connected via a 1 mm diameter optical fibre, to the c-mount of a dissecting microscope (Zeiss; angle of acceptance: 13°; distance to specimen approx. 9 cm). At the highest magnification of the microscope, the area of the measured field was approximately 0.3 mm in diameter. Illumination was provided by a Schott fibre-optic microscope-light source, illuminating the iridophores at an angle of incidence of approximately 10°. This lamp uses a halogen bulb with useable output for our reflectance experiments from 380 to 800 nm, effectively covering the visible range of wavelengths. A diffuse reflection standard (WS-1, Ocean Optics) was used to standardize measurements. For iridophore reflectance measurements, squid were killed by decapitation. Small specimens of skin from the dorsal side of the mantle, containing active iridophores with known optical properties (see Mäthger & Hanlon 2006, 2007), were dissected, streched to original size and pinned onto a Sylgard-covered Petri dish. The chromatophore layer was then peeled away, exposing the underlying iridophore layer. To quantify the intensity of iridescence following genistein treatment, the average digital image greyscale brightness values of individual iridophore patches were normalized to the non-iridescent background and measured as a function of time. Since each iridophore patch is largely elliptical, an elliptical pixel selection tool was used to sample the interior region of each iridophore. In order to eliminate problems associated with edge effects, following identification of the iridophore patch periphery, the selected area was decreased by 20 per cent. The average greyscale brightness intensity value of each iridophore patch was determined through averaging of the brightness intensity value of each pixel contained within the selected area (on a scale of 1–256) using Adobe Photoshop. These values were averaged for at least six separate iridophore patches within each field of view. These average greyscale brightness intensity values were normalized to take into consideration small local differences in background tissue brightness by subtracting the greyscale brightness values of four adjacent skin regions immediately surrounding each iridophore of interest (each of which had a selected area approximately the same as that of the selected iridophore area). All the experiments were performed in triplicate and the results reported are representative of those obtained. The effect of genistein was analysed using the closely related L. opalescens rather than L. pealeii due to differences in seasonal availability.
2.11. Polysaccharide analysis
To determine whether chitin was present in iridescent Loligo tissues, the iridophore layer was ground in liquid nitrogen and then acid-digested under vacuum in 6 M HCl at 110°C for 24 h. After the acid was removed, digested samples were subjected to amino acid analysis using a Beckman Autoanalyzer 6300 to detect N-acetyl glucosamine, the signature product of acid degradation of chitin. This experiment was repeated three times.
3. Results
Iridescence in L. pealeii skin can be induced by the exogenous addition of the neurotransmitter ACh (figure 1). Rapid changes in both the intensity and colour of reflectance are observed following the addition of ACh (figure 2). The calcium ionophore A23187 also induces iridescence in L. pealeii without the addition of ACh (figure 1b) (cf. Cooper & Hanlon 1986). The spectral shift following the initiation of iridescence via the addition of ACh was observed to proceed from 680 to 650 nm (figure 2) resulting in a visible change in iridophore colour from red to orange-yellow. In addition to blue-shifting the peak of the reflectance, longer ACh stimulation resulted in a narrowing of the peak, or a decrease in the full width at half maximum of the reflectance. This optical effect is associated with an increase in the chroma, or the purity and intensity of the ACh-stimulated structural colour.
We extracted and characterized four insoluble proteins expressed only in the iridophore-containing layer of the skin (figure 3). Two of these proteins, with apparent molecular masses of 40 and 25 kDa based on SDS–PAGE mobility, strongly cross-react with anti-reflectin antibodies generated against E. scolopes reflectins. The remaining two proteins exhibit SDS–PAGE molecular masses of 30 and 20 kDa and only weakly cross-react with the anti-E. scolopes reflectin antibody (figure 3, right).
Figure 3.

Electrophoresis, immunoreactivity and phosphorylation of reflectins. Centre panels: overlay of two artificially coloured two-dimensional electrophoretic blots of reflectin proteins stained with Pro-Q Diamond stain for phosphoamino acids (a) or PY-20 antibody against phosphotyrosine (b). Grey blot shows protein from unactivated control skin. Red blot shows protein from ACh-activated, iridescent skin. Populations of multiple phosphorylation states exist for each of the major reflectins in both the control and the treated state. Upon ACh activation, these populations of phosphorylation states apparently shift towards charge neutrality. Left panel: SDS–PAGE of iridophore layer. Right panel: immunoblot of iridophore layer with antibody to E. scolopes reflectins, showing that A-group reflectins are strongly cross-reactive, while B-group reflectins are weakly cross-reactive.
We cloned and sequenced the genes coding for three of these proteins and designated them as follows: the strongly immunoreactive proteins reflectin A1 (44 kDa) and reflectin A2 (25 kDa); and the weakly immunoreactive protein reflectin B1 (30 kDa). Their deduced amino acid sequences (figure 4) revealed similarity to the reflectin proteins of E. scolopes and L. forbesi (Crookes et al. 2004; Weiss et al. 2005), with reflectins A1 and A2 exhibiting greater sequence homology to the previously characterized proteins than reflectin B1. Interestingly, reflectin B1 appears to be the most abundant protein we have extracted from the dynamically iridescent tissue (figure 3). Although seven unique reflectin gene variants were identified in E. scolopes (Crookes et al. 2004), a similar number of reflectin sequences has not yet been found in L. pealeii.
Figure 4.

Sequence alignment and MALDI-TOF confirmed phosphorylation sites of novel reflectin proteins. The three novel reflectin proteins characterized here are aligned with reflectin 1B. Phosphorylated residues identified in MALDI-TOF MS analysis are highlighted in red. The dark grey box and white text indicates the conserved N-terminal peptide common to all reflectins. The lighter grey boxes with black text indicate the conserved reflectin motif found in all E. scolopes reflectins, but only the reflectin A sequences of Loligo. E.S.E. scolopes.
As is the case for the other reflectin proteins, reflectins A1 and A2 contain a series of conserved reflectin motifs (RMs) interspersed throughout the protein, previously defined as [M/FD(X)5MD(X)5MDX3/4] (Crookes et al. 2004). There is an additional conserved N-terminal motif [MEPMSRM(T/S)MDF(H/Q)GR(Y/L)(I/M)DS(M/Q)(G/D)R(I/M)VDP(R/G)] in both Loligo and Euprymna reflectins. This N-terminal region is more evolutionarily conserved across species and reflectin isoforms than the canonical RM. This highly conserved N-terminal domain aligns poorly with the previously defined repetitive motif, and is not repeated within the reflectin proteins. The N-terminal region is the only conserved motif present in reflectin B1, which does not contain any of the other canonical RMs as previously defined (figure 4). In contrast, reflectin A1 contains five canonical RMs and reflectin A2 contains three canonical RMs in addition to the N-terminal motif.
All three of the reflectins we characterized had exceptionally high aromatic amino acid residue content: 19 per cent in reflectin A1, 19 per cent in reflectin A2 and 19 per cent in reflectin B1. We have included histidine in our accounting of aromatic residues, since, for reasons discussed below, it appears to behave like an aromatic residue in reflectin proteins. In contrast, the average content of aromatic residues in most other proteins is approximately 10 per cent. The total content of arginine and methionine also is quite high in our reflectin proteins: arginine content was 12, 11 and 10 per cent for reflectins A1, A2 and B1, respectively. Methionine content was 16, 14 and 11 per cent for reflectins A1, A2 and B1, respectively. Notably, these reflectins have extremely few non-aromatic hydrophobic residues that are usually required for protein folding. Reflectin B1, although it contains no internal reflectin motifs as previously defined, shares the N-terminal motif and other properties such as high methionine content and high positive charge with previously identified reflectins (figure 4).
After complete acid hydrolysis of the dermal iridophore layer under vacuum, no glucosamine was detected by amino acid analysis, indicating the absence of chitin.
Hydropathy plots of the L. pealeii reflectins revealed that the three proteins are globally hydrophilic (data not shown), lacking any distinct hydrophobic regions. Computational predictions of trans-membrane helices were also negative. Although hydrophobicity calculations predict that reflectins should be water-soluble, upon purification they co-migrate with the cellular membrane fraction. Accordingly, plots of membrane-interface affinity showed that the non-conserved regions between reflectin motifs are highly energetically stable in membrane-interface regions (figure 5). The predicted isoelectric points for the three new reflectin proteins are >8.5; these high isoelectric points are largely due to high arginine content, indicating that these proteins are likely to be positively charged in the absence of extensive phosphorylation and under physiological conditions.
Figure 5.

Interface affinity of reflectin proteins. Traces indicate the calculated energy of interface interaction between a hypothetical membrane surface and 13-residue ‘windows’ of the reflectin proteins as a function of position in the proteins. Values are calculated by the method of Jaysinghe et al. (2006). Grey scale bar shows 2 kcal mol−1; negative values indicate regions of potential membrane association, while positive values indicate regions predicted to be cytosolic. Blue regions are the conserved ‘reflectin motifs’. Black regions are the intervening non-conserved regions. Dashed lines show the hypothesized interface interaction energy after phosphorylation. Red dots indicate residues phosphorylated concomitant with the activation of iridescence by ACh. When a residue becomes phosphorylated, the surrounding regions of the protein are predicted to shift from being membrane-associated to cytosolic. Sites of phosphorylation in reflectin 2B have not yet been identified.
Using neural network predictions (Blom et al. 1999), we predicted numerous potential sites of phosphorylation for the three Loligo proteins. For reflectin A1, we identified 10 serine (Ser), 13 tyrosine (Tyr) and zero threonine (Thr) sites; for reflectin A2, we identified five Ser, 11 Tyr and two Thr sites; for reflectin B2, we found 20 Ser, six Tyr and one Thr sites. Analysis of the all three reflectin sequences using PROSITE (Hulo et al. 2006) and Pfam (Finn et al. 2008) predicted no calcium-ion binding motifs (such as EF-hand motifs).
We tested the effects of several tyrosine kinase and protein kinase C (PKC) inhibitors on ACh-induced iridescence in Loligo. Genistein, a broad-range tyrosine kinase inhibitor, dramatically suppressed ACh-induced dynamic iridescence, while PKC-specific inhibitors did not. The effect of genistein on iridescence intensity exhibited a clear dose-dependency: higher doses of genistein resulted in progressively dimmer iridocyte reflectance induced by ACh (figure 2).
We confirmed and quantified active phosphorylation of the three Loligo reflectins by staining SDS–PAGE separated reflectins with Pro-Q Diamond, a stain specific for phosphoamino acids. We compared staining intensities of ACh-treated tissue with those in the ACh + genistein-treated tissue. These intensities were normalized to those of untreated control tissue. We found that both reflectin A1 and reflectin A2 showed higher phosphorylation levels in the ACh-only treatment (figure 6) than in either the ACh + genistein treatment or the control treatment. The ratio of normalized staining intensity between the ACh-only and the ACh + genistein-treated tissues increased by 130 and 240 per cent for reflectins A1 and A2, respectively (figure 6). In contrast, the net phosphorylation staining intensity of reflectin B2 decreased by 25 per cent (figure 6).
Figure 6.

Changes in phosphorylation with ACh treatment and genistein + ACh treatment of iridophores. Left, changes in Pro-Q Diamond staining intensity of reflectin proteins upon treatment with 10 µM ACh (red columns) or 10 µM ACh + genistein at indicated concentrations (grey columns). Data are per cent differences relative to an untreated control, here shown as zero. All the analyses were done in triplicate, and error bars show ± s.d. Right, changes in PY-20 anti-phosphotyrosine antibody upon treatment with ACh or ACh + genistein. Colours and values are the same as in left panel.
Since Pro-Q Diamond cannot differentiate between different phosphorylated amino acids, we specifically quantified levels of tyrosine phosphorylation via Western blotting with PY-20, a phosphotyrosine-specific antibody. Consistent with the results from Pro-Q staining, phosphotyrosine levels for the ACh-treated tissue increased by 170 and 290 per cent for reflectins A1 and A2, respectively, when compared with the ACh + genistein treatment (figure 6). The control values are included in the data presented in figure 5, as the data for the experimental treatments are plotted as the per cent change relative to the control values obtained from the corresponding (control) lane of the gel. We were unable to detect reflectin B1 with PY-20 in any tissue or treatment, indicating that tyrosine phosphorylation is low, not present, or especially labile for this protein. PY-20 sensitivity is known to be dependent on sequence context, possibly contributing to this observation. Alternatively, this result may suggest that phosphorylation of serine and/or threonine dominates in the active state for reflectin B1, in contrast to the phosphorylation of tyrosine residues in the reflectin A sequences.
To identify the locations and identities of the reflectin residues phosphorylated in the ACh-activated tissue, MALDI-TOF MS was performed on trypsin digests of reflectins A1 and reflectin A2 (table 1). This technique revealed that Tyr14 and Tyr127 of reflectin A1 and Tyr12, Tyr 214, Ser218 and Tyr223 of reflectin A2 were phosphorylated in the active state (figure 4), consistent with our stain-based analysis of phosphorylation. Reflectin A1 had an additional peptide (WMDAQGRFNNQFGQMWHGR) that showed a mass shift consistent with phosphorylation despite the absence of tyrosine, serine or threonine. This may indicate a histidine phosphorylation, as indicated in figure 4. In those cases in which more than one phosphorylatable amino acid was present in a mass-shifted peptide, we used the congruence of our computational phosphorylation predictions and our MS data to identify the specific residues that were phosphorylated. Interestingly, all but one phoshorylation event occurred outside the conserved reflectin domains. It is possible that additional non-tyrosine phosphoamino acids may have been missed by our analyses because of their lability during protein isolation and purification (Sickmann & Meyer 2001; Mikesh et al. 2006).
Table 1.
Reflectin phosphorylations predicted from MALDI-TOF MS. Peptide sequences identified by MALDI-TOF MS, with asterisks indicating identified phosphorylated residues.
| protein ID | residues | mass (a.m.u.) | predicted phoshorylated tryptic peptide |
|---|---|---|---|
| Refl A1 | 10–17 | 1181.564 | LYNMY*RNK |
| 102–120 | 2415.548 | WMDAQGRFNNPFGQMWH*GR | |
| 121–136 | 1936.058 | QGHYPGY*MSSHSMYGR | |
| Refl A2 | 4–17 | 2015.897 | YMMRHRPMY*SNMYR |
| 121–136 | 1936.058 | QGHYPGY*MSSHSMYGR | |
| 207–230 | 3350.899 | WMDTQGRY*MDPS*WSNMY*DNYNSWY |
Two-dimensional PAGE revealed the populations of phosphorylated states of the reflectins before and after iridescence activation (figure 3). The multiple phosphorylated states of each isoform reflect the fact that each reflectin contains multiple residues that can be phosphorlyated. However, because reflectin A1 has very limited solubility in the IEF buffer in the absence of detergent (as required for two-dimensional PAGE), and the different reflectin isoforms exhibit variable solubilities in detergent-free buffer, it proved difficult to quantitatively compare phosphorylation levels between reflectin species in the same two-dimensional PAGE experiment. In contrast, we found that reproducible comparisons of the levels of phosphorylation can be obtained from the analyses of one-dimensional gel electrophoresis conducted in the presence of SDS. Our two-dimensional PAGE data enabled us to evaluate the shifts in the populations of differentially phosphorylated states of the reflectins from untreated and ACh-treated samples. Thus, staining with Pro-Q Diamond and PY-20 revealed that reflectin A1 and reflectin A2 each consist of populations with several discrete phosphorylated states for both activated and inactivated tissues (figure 3). Immunodetection with PY-20 (and, to a lesser degree, staining with Pro-Q Diamond) revealed that the most acidic, extensively phosphorylated reflectin A2 molecules possess an isoelectric point of 7, and are in significantly higher abundance in the activated tissue. Reflectin B2 also appeared to exhibit a higher degree of phosphorylation, as determined with Pro-Q Diamond, following the addition of ACh (figure 3). In contrast, Pro-Q Diamond staining shows that reflectin B1 became more basic (less phosphorylated) upon activation, and also is present in several distinct phosphorylated populations (figure 3). In general, the reflectin proteins extracted from the ACh-treated tissues appeared to migrate slightly farther in the first dimension of two-dimensional PAGE than did the proteins from the controls. Although we cannot rule out imperfect alignment of gel images, it seems probable that this is caused by increased negative charge on the activated proteins due to phosphorylation.
4. Discussion
We tested the hypothesis that, in loliginid squid, the muscarinic ACh cascade leading to dynamic iridescence has direct biochemical effects on the reflectin proteins constituting the squid iridosomes. We characterized the reflectins found in the dynamically tunable iridosomes and found that these reflectin proteins appear to be progressively phosphorylated or dephosphorylated upon stimulation of iridocytes with ACh. These changes in phosphorylation are concurrent with the activation and deactivation of iridescence. The dose-dependent ability of genistein, a broad-spectrum tyrosine kinase inhibitor, to quench the stimulation of iridescence as well as prevent the phosphorylation of reflectin further supports our hypothesis.
Genistein lowered the phosphorylation levels of reflectin proteins below those of non-iridescent, untreated controls. Because baseline protein phosphorylation states are maintained by active homeostasis in cells, this finding supports an active role for reflectin phosphorylation in iridescence modulation. In general, cells exert multiple mechanistic layers of intricate control over protein phosphorylation state (Ubersax & Ferrell 2007). This phenomenon, together with our findings showing that reflectin phosphorylation is dynamic, provides a model for the intricate homeostatic control by which iridocytes regulate the brightness and colour of iridescence.
Because PKC inhibitors did not achieve the same iridescence-suppressing effect as genistein, we hypothesize a key role for tyrosine kinases in iridescence activation. However, because commercially available PKC inhibitors may be specific only to mammalian proteins, and because their effects on cephalopod protein kinases are unknown, we cannot yet identify the specific protein kinases that mediate the ACh-induced phosphorylation of the reflectins studied here.
Phosphorylation is known to trigger dramatic changes in the conformations and assembly of many proteins and extensive tyrosine phosphorylation is largely responsible for the many rapid changes in cell physiology, such as in insulin signaling (Karim et al. 2006; Schmelzle et al. 2006). This signaling paradigm is a possible precedent for the dynamic iridescence mechanism outlined below.
We suggest three possible mechanisms that may work independently or in concert to account for the observed changes in iridescence. First, phosphorylation may induce changes in the net charge of the reflectins, which may directly alter reflectin protein–protein interaction and assembly. These changes could play a role in altering the refractive index, thickness and/or spacing of the reflectin-containing iridosomes, leading to the observed changes in reflectance. Second, phosphorylation of reflectins may trigger changes in the Gibbs–Donnan equilibrium across the iridosome membranes, affecting a number of variables such as protein aggregation, protein mobility, turgor pressure or thickness of the membrane-bound iridosomes. Third, phosphorylation of reflectins could modulate the affinity of reflectins for cell membranes, shifting assembly dynamics toward auto-aggregation and hierarchical self-assembly (cf. Hanlon et al. 1990). Consistent with the third hypothesis, reflectins are characterized, in part, by their extremely high content of aromatic and arginine residues. These residues are both preferentially soluble in membrane–cytoplasm interfaces (Wimley & White 1996).
Membrane–cytoplasm interfaces are known to exhibit unique solubility properties relative to aqueous cytoplasm. Polar aromatic residues are particularly stable in this microenvironment, while very hydrophobic and very hydrophilic residues are not (Yau et al. 1998; Granseth et al. 2005). Arginine, because of its positive charge and long hydrophobic stem, exhibits ‘snorkeling’ behaviour from the interface into the membrane (Killian & von Heijne 2000). Reflectins are, indeed, characterized by their high content of polar aromatic residues and arginines, and several lines of evidence suggest that they are intrinsically unstructured, with no likely transmembrane, alpha-helix or beta-sheet regions. E. scolopes reflectins also have high arginine, hydrophobic and aromatic content (Crookes et al. 2004). The first study to characterize the reflectins described them as ‘methionine-rich membrane-associated proteins’ and demonstrated that they have a high affinity for assembly with microsomal membranes when translated in vitro (Weiss et al. 2005). Given these data, and what is known about the biophysics of membrane interfaces, we hypothesize that reflectins may exhibit energetically favourable interactions with membrane interfaces.
This suggestion is consistent with our observation that the reflectins co-purify with cell membranes, yet lack any traditionally recognized transmembrane domains and small hydrophobic amino acids. Reflectins A1 and A2 exhibit an interesting periodicity of domains potentially capable of interacting with membrane interfaces, with the proteins apparently alternating between interface-stable regions and hydrophilic domains approximately every 50 amino acids (figure 5). Reflectin B2, which exhibits the opposite phosphorylation pattern upon ACh stimulation from reflectins A1 and A2, does not show the same periodicity, consistent with the possibility of a different assembly dynamic for this protein. Interestingly, the calculated affinity of specific domains of reflectins A1 and A2 for membrane is predicted to be abolished upon the observed phosphorylation of those sites (figure 5). Phosphorylations occur in regions of the protein that prior to phosphorylation are predicted to be highly stable in membrane interfaces, while the conserved RMs are not phosphorylated, and are predicted to be more stable in the cytoplasmic compartment of the cell. After phosphorylation (mimicked for these calculations by substitution of the original residues with negatively charged glutamate residues), the phosphorylated protein regions are predicted to change from being interface-stable to being stable in the cytoplasm.
Although iridescence is induced by both ACh and elevation of intracellular calcium concentrations via administration of a calcium ionophore (see figure 1), we find no evidence for any calcium ion-binding motifs in the newly identified reflectins. Instead, our result suggests that calcium functions as a second messenger in the signal transduction cascade rather than as a direct modulator of the reflectin proteins. Support for our suggestion of a receptor-activated G protein-dependent signal transduction pathway is provided by our observation that iridescence is activated by cholera toxin (an activator of the G protein) in the absence of ACh (data not shown).
Reflectins A1 and A2 from Loligo are most similar to the reflectin 1 group from the static iridophores in Euprymna, in both primary sequence and immunoreactivity to antibodies against Euprymna reflectin. Therefore, the protein reflectin B1 may be especially interesting in discerning important functional and evolutionary differences between static iridescence in E. scolopes and dynamic iridescence in Loligo. Unlike the reflectins A1 and A2, reflectin B1 has no conserved RMs and instead contains only the initial N-terminal peptide characteristic of reflectins. Reflectin B1 is more acidic than reflectins A1 or A2, and it exhibits the opposite phosphorylation response to ACh stimulation relative to reflectins A1 or A2. In addition, a comparison of Pro-Q staining with PY-20 staining suggests that reflectin B1 may be predominantly serine/threonine-phosphorylated, rather than tyrosine-phosphorylated. Given that reflectins A1 and A2 and reflectin B1 have differing phosphorylation responses to ACh, the reflectin As and reflectin Bs could operate under separate control mechanisms within a single cell. These characteristics may provide important clues for future work in understanding how RMs, phosphorylation and charge modulation of reflectins contribute to the ability of loliginid iridocytes to modulate their reflectance.
Our data demonstrate changes in the relative levels of phosphorylation of the reflectin proteins upon ACh stimulation of the adaptive iridophores of Loligo. Detailed quantitation and mapping of the sites of phosphorylation by MS are now in progress to help provide a deeper mechanistic understanding of the biophysical role of phosphorylation in tuning the Bragg reflectors in this system.
Finally, in contrast to prior reports (see Denton & Land 1971; Cloney & Brocco 1983), we have shown that chitin is not present in measurable quantities in iridescent squid skin, as indicated by the complete absence of glucosamine after complete acid hydrolysis (data not shown). This should help end historical speculation that small movements of chitin platelets could be responsible for dynamic iridescence in squid.
Our observation of ACh-dependent changes in reflectin phosphorylation accompanying increased reflectance suggests a molecular mechanism for adaptive control in this biophotonic system. The reciprocal nature of the phosphorylation of reflectins A1 and A2 versus reflectin B presents interesting possibilities for further probing the biophysical phenomena that promote dynamic iridescence. We have traced the signal transduction cascade in this system from the transmitter to a likely final target: the reflectin proteins that apparently change their conformation or assembly to reversibly create the photonic structure. Further elucidation of the underlying molecular mechanisms regulating the intensity and colour of the tunable Bragg reflectors in this system can be expected to shed new insight into the evolutionary origin of adaptive reflectance in cephalopods, and may also inspire novel synthesis strategies for production of the next generation of tunable photonic materials for advanced applications.
Acknowledgements
We gratefully acknowledge support from Anteon contract F33615-03-D-5408 to the Marine Biological Laboratory, Woods Hole, MA, and grant no. W911NF-06-1-0285 from the Army Research Office to D.E.M. We also thank Margaret McFall-Ngai (NIH AI50611) and Edward G. Ruby (NIH RR 12294) for providing the anti-reflectin antibodies, Tim Athens for providing live squid for analysis, Dr James Pavlovich for de novo amino acid sequence analyses and Drs Paul Hansma, Igor Mezic, Yoshiko Okamura, Kathy Foltz and Daniel Alkon for their helpful discussions and suggestions.
References
- Blom N., Gammeltoft S., Brunak S. 1999. Sequence- and structure-based prediction of eukaryotic protein phosphorylation sites. J. Mol. Biol. 294, 1351–1362. ( 10.1006/jmbi.1999.3310) [DOI] [PubMed] [Google Scholar]
- Blom N., Sicheritz-Ponten T., Gupta R., Gammeltoft S. 2004. Prediction of posttranslational glycosylation and phosphorylation of proteins from the amino acid sequence. Proteomics 4, 1633–1649. ( 10.1002/pmic.200300771) [DOI] [PubMed] [Google Scholar]
- Carlton F. C. 1903. The color changes in the skin of the so-called Florida Chameleon, Anolis Carolinensis Cuv. Proc. Am. Acad. Arts Sci. 39, 259–276. [Google Scholar]
- Cloney R. A., Brocco S. L. 1983. Chromatophore organs, reflector cells, iridocytes and leucophores in cephalopods 1. Integr. Comp. Biol. 23, 581–592. ( 10.1093/icb/23.3.581) [DOI] [Google Scholar]
- Cooper K. M., Hanlon R. T. 1986. Correlation of iridescence with changes in iridophore platelet ultrastructure in the squid. Lolliguncula brevis. J. Exp. Biol. 121, 451–455. [DOI] [PubMed] [Google Scholar]
- Cooper K. M., Hanlon R. T., Budelmann B. U. 1990. Physiological color change in squid iridophores. II. Ultrastructural mechanisms in Lolliguncula brevis. Cell Tissue Res. 259, 15–24. ( 10.1007/BF00571425) [DOI] [PubMed] [Google Scholar]
- Crookes W. J., Ding L., Huan Q. L., Kimbell J. R., Horwitz J., McFall-Ngai M. J. 2004. Reflectins: the unusual proteins of squid reflective tissues. Science 303, 235–238. ( 10.1126/science.1091288) [DOI] [PubMed] [Google Scholar]
- Denton E. J. 1970. Review lecture: on the organization of reflecting surfaces in some marine animals. Phil. Trans. R. Soc. Lond. B 258, 285–312. ( 10.1098/rstb.1970.0037) [DOI] [PubMed] [Google Scholar]
- Denton E. J., Land M. F. 1971. Mechanism of reflexion in silvery layers of fish and cephalopods. Proc. R. Soc. Lond. B 178, 43–61. ( 10.1098/rspb.1971.0051) [DOI] [PubMed] [Google Scholar]
- Finn R. D., et al. 2008. The Pfam protein families database. Nucl. Acids Res. 36, D281 ( 10.1093/nar/gkm960) [DOI] [PMC free article] [PubMed] [Google Scholar]
- Granseth E., von Heijne G., Elofsson A. 2005. A study of the membrane-water interface region of membrane proteins. J. Mol. Biol. 346, 377–385. ( 10.1016/j.jmb.2004.11.036) [DOI] [PubMed] [Google Scholar]
- Haass C., Selkoe D. J. 1993. Cellular processing of β-amyloid precursor protein and the genesis of amyloid β-peptide. Cell 75, 1039–1042. [DOI] [PubMed] [Google Scholar]
- Hanlon R. T., Cooper K. M., Budelmann B. U., Pappas T. C. 1990. Physiological color change in squid iridophores I. Behavior, morphology and pharmacology in Lolliguncula brevis. Cell Tissue Res. 259, 3–14. ( 10.1007/BF00571424) [DOI] [PubMed] [Google Scholar]
- Hulo N., Bairoch A., Bulliard V., Cerutti L., De Castro E., Langendijk-Genevaux P., Pagni M., Sigrist C. J. A. 2006. The PROSITE database. Nucl. Acids Res. 34, D227–D230. ( 10.1093/nar/gkj063) [DOI] [PMC free article] [PubMed] [Google Scholar]
- Huxley A. F. 1968. A theoretical treatment of the reflexion of light by multilayer structures. J. Exp. Biol. 48, 227–245. [Google Scholar]
- Jaysinghe S., Hristova K., Wimley W., Snider C., White S. H. 2006. See http://blanco.biomol.uci.edu/mpex.
- Karim C. B., Zhang Z., Howard E. C., Torgersen K. D. 2006. Phosphorylation-dependent conformational switch in spin-labeled phospholamban bound to SERCA. J. Mol. Biol. 358, 1032–1040. ( 10.1016/j.jmb.2006.02.051) [DOI] [PubMed] [Google Scholar]
- Killian J. A., von Heijne G. 2000. How proteins adapt to a membrane-water interface. TIBS 25, 429–434. [DOI] [PubMed] [Google Scholar]
- Kobelt F., Linsenmair K. E. 1986. Adaptations of the reed frog Hyperolius viridiflavus (Amphibia, Anura, Hyperoliidae) to its arid environment. Oecologia 68, 533–541. ( 10.1007/BF00378768) [DOI] [PubMed] [Google Scholar]
- Kramer R. M., Crookes-Goodson W. J., Naik R. R. 2007. The self-organizing properties of squid reflectin protein. Nat. Mater. 6, 533–538. ( 10.1038/nmat1930) [DOI] [PubMed] [Google Scholar]
- Land M. F. 1972. The physics and biology of animal reflectors. Progr. Biophys. Mol. Biol. 24, 75–106. ( 10.1016/0079-6107(72)90004-1) [DOI] [PubMed] [Google Scholar]
- Mäthger L. M., Hanlon R. T. 2006. Anatomical basis for camouflaged polarized light communication in squid. Biol. Lett. 2, 494–496. ( 10.1098/rsbl.2006.0542) [DOI] [PMC free article] [PubMed] [Google Scholar]
- Mäthger L. M., Hanlon R. T. 2007. Malleable skin coloration in cephalopods: selective reflectance, transmission and absorbance of light by chromatophores and iridophores. Cell tissue Res. 329, 179–186. [DOI] [PubMed] [Google Scholar]
- Mäthger L. M., Land M. F., Siebeck U. E., Marshall N. J. 2003. Rapid colour changes in multilayer reflecting stripes in the paradise whiptail, Pentapodus paradiseus. J. Exp. Biol. 206, 3607–3613. ( 10.1242/jeb.00599) [DOI] [PubMed] [Google Scholar]
- Mäthger L. M., Collins T. F. T., Lima P. A. 2004. The role of muscarinic receptors and intracellular Ca2+ in the spectral reflectivity changes of squid iridophores. J. Exp. Biol. 207, 1759–1769. ( 10.1242/jeb.00955) [DOI] [PubMed] [Google Scholar]
- Menter D. G., Tchen T. T., Obika M., Taylor J. D. 1979. Leucophores and Iridophores of Fundulus heteroclitus. J. Morphol. 160, 102–120. [DOI] [PubMed] [Google Scholar]
- Messenger J. B. 2001. Cephalopod chromatophores: neurobiology and natural history. Biol. Rev. 76, 473–528. [DOI] [PubMed] [Google Scholar]
- Mikesh L. M., Ueberheide B., Chi A., Coon J. J., Syka J. E. P. 2006. The utility of ETD mass spectrometry in proteomic analysis. BBA-Proteins Proteom. 1764, 1811–1822. ( 10.1016/j.bbapap.2006.10.003) [DOI] [PMC free article] [PubMed] [Google Scholar]
- Mirow S. 1972. Skin color in the squids Loligo pealii and Loligo opalescens. Cell Tissue Res. 125, 176–190. [DOI] [PubMed] [Google Scholar]
- Osorio D., Ham A. D. 2002. Spectral reflectance and directional properties of structural coloration in bird plumage. J. Exp. Biol. 205, 2017–2027. [DOI] [PubMed] [Google Scholar]
- Rohrlich S. T., Rubin R. W. 1975. Biochemical characterization of crystals from the dermal iridophores of a chameleon Anolis carolinensis. J. Cell Biol. 66, 635–645. ( 10.1083/jcb.66.3.635) [DOI] [PMC free article] [PubMed] [Google Scholar]
- Schmelzle K., Kane S., Gridley S., Lienhard G. E. 2006. Temporal dynamics of tyrosine phosphorylation in insulin signaling. Diabetes 55, 2171–2179. ( 10.2337/db06-0148) [DOI] [PubMed] [Google Scholar]
- Sickmann A., Meyer H. E. 2001. Phosphoamino acid analysis. Proteomics 1, 200–206. ( 10.1002/1615-9861(200102)1:2%3C200::AID-PROT200%3E3.0.CO;2-V) [DOI] [PubMed] [Google Scholar]
- Sonnhammer E. L., von Heijne G., Krogh A. 1998. A hidden Markov model for predicting transmembrane helices in protein sequences. Proc. Int. Conf. Intell. Syst. Mol. Biol. Proc. 6, 175–182. [PubMed] [Google Scholar]
- Takemoto L., Boyle D. 2000. Increased deamidation of asparagine during human senile caractogenesis. Mol. Vision 6, 164–168. [PubMed] [Google Scholar]
- Ubersax J. A., Ferrell J. E., Jr 2007. Mechanisms of specificity in protein phosphorylation. Nat. Rev. Mol. Cell Biol. 8, 530–541. ( 10.1038/nrm2203) [DOI] [PubMed] [Google Scholar]
- Vigneron J. P., Colomer J. F., Vigneron N., Lousse V. 2005. Natural layer-by-layer photonic structure in the squamae of Hoplia coerulea (Coleoptera). Phys. Rev. E 72, 061904 ( 10.1103/PhysRevE.72.061904) [DOI] [PubMed] [Google Scholar]
- Vukusic P., Sambles J. R. 2003. Photonic structures in biology. Nature 424, 852–855. ( 10.1038/nature01941) [DOI] [PubMed] [Google Scholar]
- Weiss J. L., Evans N. A., Ahmed T., Wrigley J. D. J., Khan S. 2005. Methionine-rich repeat proteins: a family of membrane-associated proteins which contain unusual. BBA Biomembr. 1668, 164–174. ( 10.1016/j.bbamem.2004.11.014) [DOI] [PubMed] [Google Scholar]
- Wimley W. C., White S. H. 1996. Experimentally determined hydrophobicity scale for proteins at membrane interfaces. Nat. Struct. Biol. 3, 842–848. ( 10.1038/nsb1096-842) [DOI] [PubMed] [Google Scholar]
- Yau W., Wimley W. C., Gawrisch K., White S. H. 1998. The preference of tryptophan for membrane interfaces. Biochemistry 37, 14713–14718. ( 10.1021/bi980809c) [DOI] [PubMed] [Google Scholar]