

Abstract
A general model explaining the origin of allometric laws of physiology is proposed based on coupled energy-transducing oscillator networks embedded in a physical d-dimensional space (d = 1, 2, 3). This approach integrates Mitchell's theory of chemi-osmosis with the Debye model of the thermal properties of solids. We derive a scaling rule that relates the energy generated by redox reactions in cells, the dimensionality of the physical space and the mean cycle time. Two major regimes are found corresponding to classical and quantum behaviour. The classical behaviour leads to allometric isometry while the quantum regime leads to scaling laws relating metabolic rate and body size that cover a broad range of exponents that depend on dimensionality and specific parameter values. The regimes are consistent with a range of behaviours encountered in micelles, plants and animals and provide a conceptual framework for a theory of the metabolic function of living systems.
Keywords: allometric scaling, metabolic rate, chemi-osmotic theory, Debye model, quantum metabolism
1. Introduction
Metabolism designates the set of chemical transformations carried out by an organism in converting nutrients with chemical, osmotic and mechanical work. Metabolic rate, the rate at which these transformations occur, is constrained by the total size of the organism. This observation goes back to Lavoisier and Laplace who were the first to investigate the calculus of energy transduction in living organisms. The systematic empirical study of the relations between metabolic rate, which began with Rubner (1908) and Kleiber (1961) and was pursued later by Hemmingsen (1960), led to an allometric relation of the form: P = αWβ, where P is the metabolic rate and W the body size. The proportionality constant α varies within and between species. The scaling exponent β varies between taxa and ranges typically from 2/3 in the case of small animals to 1 for certain plants. An exhaustive study of the values of the scaling exponents across 3006 species covering 20 orders of magnitude in mass has been recently conducted by Makarieva et al. (2008) in terms of mass-specific metabolic rates.
The problem of explaining these empirical rules in mechanistic terms has engaged several generations of researchers and is still largely unresolved. The more recent efforts have been based largely on macroscopic organismic properties such as elastic similarity and fractal geometry of network pathways. These models invariably assume that the scaling exponent always takes a value β = 3/4, thus ignoring a large body of empirical observations at variance with it. In particular, the study by Makarieva et al. (2008) concludes that a single exponent β does not exist; in fact the values reported in this meta-analysis range from approximately 0.6 to 1.0 and have significant uncertainties associated with them. This study, however, indicates that across the many life forms, a physiological window has been found for a metabolic optimum (Makarieva et al. 2008).
Empirical studies of the mechanistic basis of the allometric relations indicate that both the proportionality constants and the scaling exponents are in large part dependent on cellular level properties (Rolfe & Brown 1997; Hochachka & Somero 2000) and not only on macroscopic scale organization. This observation was exploited in a new model proposed to explain the allometric relations (Demetrius 2003, 2006). The model is based on an analysis of molecular dynamics at the cellular level. A crucial hypothesis is that metabolic activity within an organism has its origin in the process of energy transduction localized in three types of bio-membranes: (i) the plasma membrane in uni-cells; (ii) the inner membrane of mitochondria in animals; and (iii) the thylakoid membrane in plants (Harold 1986). These structures give rise to dimensionality differences in terms of the energy-transducing enzymes embedded in them. Alignment in a single direction can be locally seen in the case of uni-cells where the enzymes are aligned within the inner membrane. This may also be the case in mitochondria. Alignment in two dimensions typically occurs in mitochondria while three-dimensional alignment appears characteristic of some mitochondria and chloroplasts. As we demonstrate later in the paper, the dimensionality of the network of energy-transducing enzymes plays a decisive role in the determination of the scaling rule for the metabolic rates as a function of the body mass.
Living organisms produce the biochemical energy unit, ATP, from energy sources mainly via oxidative phosphorylation. Hydrolysis of ATP is used to store energy in cells for intermediate metabolism. A dominant role for the mitochondria (Scheffler 2008) is the production of ATP. This is done by oxidizing the major products of glucose, pyruvate and NADH, which are produced in the cytosol. This process of cellular respiration, also known as aerobic respiration, is dependent on the presence of oxygen. When oxygen is limited, the glycolytic products are metabolized by anaerobic respiration, a process that is independent of the mitochondria. The production of ATP from glucose has an approximately 13-fold higher yield during aerobic respiration compared with anaerobic respiration. The commonly held assumption that energy production by metabolic enzymes requires the presence of chemical gradients (Scheffler 2008) is certainly correct, although this is also accompanied by dynamical molecular processes as has been argued by several groups of authors as we describe below.
The transfer of electrons in a bio-membrane is accompanied by a series of redox reactions in a cyclic scalar process that induces a vectorial process characterized by a net movement of protons from one molecular centre to another. Energy transduction in bio-membranes can be analysed in terms of the chemi-osmotic coupling of two molecular motors: (i) the redox chain, which describes the transfer of electrons between redox centres within the bio-membrane and (ii) the ATPase motor, which is involved in the phosphorylation of ADP to ATP. A fundamental assumption of the model that we advance in this paper is the molecular oscillator hypothesis, which states that the energy generated by the redox reactions can be stored in terms of coherent dynamical modes of the molecular oscillators embedded in the bio-membrane. This assumption is consistent with Froehlich's theory of biological coherence that was based on quantum interactions between dipolar constituents of bio-molecules (Froehlich 1968). Froehlich proposed momentum–space correlations within a living system such as a membrane, a cell or an organism (Froehlich 1972, 1980). This dynamic order would be a characteristic feature that distinguishes living systems from inanimate matter. The Froehlich model of biological coherence is based on a condensate of quanta of collective polar oscillations (Froehlich 1968). Various experiments appeared to demonstrate the sensitivity of metabolic processes to certain frequencies of electromagnetic radiation above the expected Boltzmann probability level. Raman scattering experiments of Webb (1980) found non-thermal effects in Escherichia coli but could not be reproduced by other laboratories. Irradiation by millimetre waves of yeast cells showed increased growth at specific frequencies (Rowlands et al. 1983). While some of these experiments illustrate non-thermal effects in living matter that would require nonlinear and non-equilibrium interactions for explanation, no unambiguous experimental proof has been furnished to date to support Froehlich's hypothesis, although its basic premise remains attractive.
Synchronization of metabolic cycles through gene and enzyme regulation within and between cells have been demonstrated to involve collective and coordinated transcriptional cycles in both cultured yeast and mammalian cells (Bianchi 2008). Evidence is mounting that a living cell is an oscillator exhibiting collective behaviour in gene regulation coordinating mitochondrial and metabolic functions (Klevecz et al. 2008; Palumbo et al. 2008). In a large body of work, Tsong and collaborators have shown the existence of dynamical processes involving metabolic enzymes that can capture and transmit energy from oscillating electric fields (Westerhoff et al. 1986) involving electro-conformational coupling (Tsong 1987) and electric modulation of membrane proteins (Tsong 1990). We conclude that a number of specific molecular processes may be at play, resulting in the oscillatory behaviour of energy-transducing enzymes. These biological oscillators can be synchronized under favourable conditions.
In this paper we will exploit the methods of the quantum theory of solids to investigate the relation between (i) the total metabolic energy generated by the molecular oscillators and (ii) the cycle time, the mean time of the molecular processes within the bio-membrane. The mean cycle time is a function of: (i) the external resources that drive the metabolic processes in the cells and (ii) the intrinsic properties of the metabolic network that transforms the external resources into osmotic, muscular and synthetic work.
In earlier studies (Demetrius 2003, 2006), it was shown that the relation between metabolic energy and cycle time can be characterized in terms of two classes of constraints. The critical property is the relation between the mean cycle time and the characteristic cycle time, which is the average time required for the synchronization of enzymatic metabolic activities within the network.
We established the following.
(i) If the mean cycle time, τ, is much shorter than the characteristic cycle time, τ*, then the scaling relation is β = 3/4.
(ii) If the mean cycle time, τ, is much longer than the characteristic cycle time, τ*, then the scaling exponent is β = 1.
These relations provide an explanation for the differences in scaling exponents that characterize certain plants (β = 1) and animals (β = 3/4). The argument that underlies the above relations implicitly assumed that the enzyme molecules that are embedded in the bio-membrane and that constitute the origin of the energy transduction process are distributed uniformly in space, a condition that entails a dimensionality d = 3 for the molecular oscillator network.
This article will generalize the argument developed in these earlier papers in an effort to explain the diversity of scaling exponents documented in Makarieva et al. (2008) and Glazier (2005). We will derive a scaling relation for systems of arbitrary dimension and in arbitrary regimes of mean cycle time and characteristic cycle time ratios. We will show that when the mean cycle time is much less than the characteristic cycle time, then the relation between metabolic rate, P, and body size, W, is given by
| 1.1 |
Here, 1 < d < ∞, and d denotes the dimension of the interacting molecular oscillator network embedded in the bio-membrane. The parameters C and Δp are bio-energetic parameters; C denotes the proton conductance of the bio-membrane and Δp is the proton-motive force. We will show furthermore that when the mean cycle time is much greater than the characteristic cycle time, we now have an isometric relation between metabolic rate and body size.
The methodology that underlies the derivation of the above equation is the quantum theory of solids as formulated originally by Einstein and Debye. The quantum theory of solids was aimed at explaining in mechanistic terms a class of relations between the specific heat of solids and absolute temperature. The model proposed by Einstein treated the atoms in a crystalline solid as vibrating independently of each other about fixed lattice sites. The extension owing to Debye assumed that the vibrations are mutually coupled, leading to the propagation of elastic waves. Both classes of models assumed that the molecular oscillators were quantized and applied Planck's quantization rule to derive expressions relating the total energy generated by the molecular oscillations with the absolute temperature.
Quantum metabolism, the term we have invoked to describe the methodology that underlies this work, rests on the observation that the molecular oscillations in bio-membranes and the material oscillations in crystalline solids can be analysed in terms of essentially the same mathematical formalism. This recognition is derived from a formal correspondence between the thermodynamic variables that describe material systems and the metabolic parameters that define certain biological processes (Demetrius 2003). We summarize this correspondence in table 1. The correspondence between thermodynamic variables and metabolic parameters is a consequence of the following analytical fact (Arnold et al. 1994). The growth rate parameter in metabolic processes satisfies a variational principle that is formally analogous to the minimization of the free energy in thermodynamic systems. The conceptual framework and the analytical methods that define quantum metabolism form an extension of this mathematical principle.
Table 1.
Formal relation between thermodynamic variables and metabolic parameters.
| thermodynamic variables | metabolic parameters |
|---|---|
| temperature | cycle time |
| heat capacity | metabolic rate |
| thermodynamic entropy | entropy production rate |
2. Energy transduction in bio-membranes
The energy-transducing bio-membrane is the basic structure in our analysis of metabolic activity and the relation between metabolic rate and body size. The basic information on the structure of bio-membranes has led to the fluid mosaic model (Singer & Nicholson 1972), which describes the membrane as a sheet-like structure with a thickness of approximately 10 nm and consisting of non-covalently bound lipid–protein complexes. The constituent proteins, which are embedded in the phospholipids layer, are held together by many cooperative non-covalent interactions.
According to Mitchell's chemi-osmotic theory, the energy released in oxidation is coupled by proton translocation across the bio-membrane to ADP phosphorylation. The energy transformation involves the inter-conversion of three forms of energy.
(i) The redox potential difference, that is, the actual redox potential between the donor and acceptor couples in the electron transfer chain.
(ii) The proton-motive force, which describes the free energy stored in the membrane electrochemical proton gradient.
(iii) The phosphorylation potential for ATP synthesis.
Transfer of electrons in a bio-membrane is accompanied by a series of redox reactions in a cyclic scalar process that induces a vectorial process with a net movement of protons from one molecular centre to another. The transit time of this cyclic process determines the total metabolic flux, that is, the number of proton charges released by the redox reactions. The electron transport between redox centres is coupled to the outward pumping of protons across the membrane, thus generating an electrochemical gradient, called the proton-motive force, Δp. If C denotes the proton conductance of the membrane and J denotes the proton current induced by the electromotive force, applying Ohm's law to the proton circuit, we obtain J = CΔp. Accordingly, the energy generated per cycle is given by E = gτ, where g = J/NA, NA denotes Avogadro's number and τ denotes the cycle time, the mean turnover time of the enzymes in the reaction process.
The range of values assumed by the various bio-energetic parameters is highly dependent on taxa as briefly discussed below.
(i) The proton conductance is given by C = Co exp(−ΔE/RT), where ΔE is the activation free energy, R is the gas constant and T the absolute temperature. C tends to be higher in endotherms than in other organisms because of their temperature dependence.
(ii) The proton-motive force Δp is given by Δp = ΔΨ−(2.3RT/F)ΔpH, where ΔΨ is the membrane potential and F denotes Faraday's constant. The values of Δp, ΔΨ and ΔpH depend on the geometry and chemical composition of the energy-transducing membrane and differ between bacteria, mitochondria and chloroplasts (table 2). The bacterial membrane and the mitochondrial inner membrane have equivalent topologies with respect to inside and outside. The chloroplast inner membrane is oriented inside-out relative to these other two cases. Accordingly, this leads, in the case of chloroplasts, to a positive value for ΔpH and a negative value for Δp.
(iii) Cycle time. The cycle time is the mean turnover time of the enzymes in the reaction process. Based on typical data for ion pumps in biological membranes, the range of values expected for τ is between 10−6 and 10−3s (Tsong & Astumian 1988; Liu et al. 1990). The mean cycle time generally increases with the size of the organism according to a 1/4 power law (Schmidt-Nielsen 1984).
Table 2.
The values of Δp, ΔΨ and ΔpH for three types of membranes.
| membrane | ΔΨ (mV) | ΔpH | Δp (mV) |
|---|---|---|---|
| bacteria | 70 | −2 | 185 |
| mitchondria | 140 | −1.4 | 220 |
| chloroplasts | ∼0 | 3.5 | −200 |
3. Quantization effects, metabolic energy and cycle time
If N denotes the number of molecular groups involved in the energy transduction process taking place across the bio-membrane, then the system has 3N degrees of freedom in three spatial dimensions, hence the molecular oscillations of the system can be described in terms of 3N normal modes of excitation, each with a characteristic frequency. Molecular oscillations are considered to be collective properties of the membrane as a whole. We will compute the metabolic energy, a property that is generated by the molecular oscillations of the membrane-bound energy-transducing groups.
3.1. The mean energy
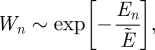
We assume that the oscillatory modes of the molecular groups are quantized and then apply a statistical argument to obtain the average energy for each independent mode of oscillation. For a given energy, En = (n + 1/2)× ℏω, the probability, Wn, that the oscillation has an energy corresponding to its nth allowed value is
 |
3.1 |
where  .
.
The mean energy value E* associated with an independent mode of oscillation is now given by
| 3.2 |
which becomes, in view of equation (3.1)
| 3.3 |
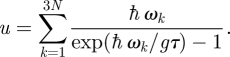
3.2. The total metabolic energy
The total metabolic energy, u, generated by the redox reaction and stored in the bio-membrane is given by
 |
3.4 |
In a coarse-grained approach approximating the discrete structure of the membrane by a homogeneous elastic medium, we find an expression for the total metabolic energy from different standing wave patterns generated by the oscillations of the molecular groups. Thus, the number of standing waves in an enclosure with frequencies in the range from ω to ω + dω is determined by the geometry of the network of coupled oscillators. The density of modes for a system of oscillators located in a d-dimensional space depends on dimensionality d according to Mihaly & Martin (1996): f = Aωd−1, where A depends on the spatial distribution of the elements of the oscillator system, i.e. the type of lattice they may form in space.
In the case of perfect lattice periodicity, the integration needs to be performed only over the interval −π/2a < k < π/2a, where a denotes the mean separation between the neighbouring oscillators. When perfect lattice periodicity is absent, as would be typical of enzymes in a bio-membrane, there will still be a finite limit imposed on the integration owing to the finite spacing between neighbouring oscillators. At steady state, the average occupation number for each mode is given by the Bose–Einstein statistics because there is no obvious exclusion principle at work for a number of energy quanta associated with a given excitation state. Hence, the statistical average of the occupation number nj in a given mode is found as
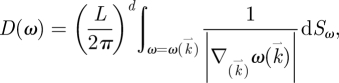
where we have introduced the biological parameter β = (gτ)−1. To calculate the average value of the metabolic energy u, it is more convenient to perform mode counting in frequency space than in the space of wavevectors k. This requires the introduction of the density of states, which can be viewed as a Jacobian of this type of transformation. The density of the oscillator states, D(ω), as a function of frequency ω is, in general, found as
 |
3.5 |
where Sω represents the surface boundary and the denominator in the integrand describes the gradient of the dispersion relation in reciprocal (wavevector) space (Haken 1983). The conservation of the number of states leads to the normalization condition
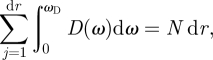 |
where r is the degeneracy of the oscillatory modes. We then assume that the dispersion relation between the frequency and the wavenumber is  (i.e.
(i.e.  where v is the velocity of the excitation waves propagating through the biological medium. Note that as in the Debye theory of solids, the vibrational states can only be occupied up to a cut-off value (the Debye frequency) ωD determined by the mean distance between the neighbouring oscillators.
In table 3, we have summarized the correspondence between the Debye theory of solids and quantum metabolism and introduced the mean separation between interacting enzymes in a network, a, the signalling speed, v, and the volume of the oscillator network, V, with N oscillators present.
Table 3.
Correspondence between the Debye theory and quantum metabolism.
| Debye theory variables | quantum metabolism variables |
|---|---|
| kB: Boltzmann constant | g = C Δp: cell specific membrane conductance |
| T: absolute temperature | τ: mean time between environmental nutrient supply |
| ℏ: Planck's constant | ℏ: Planck's constant |
| ω: characteristic oscillator frequency | ω′: enzymatic network's turnover frequency |
| τD: Debye period of the oscillators = (2π/vs) × (4πV/3N)1/3 | τmin: minimum turnover time for the enzymes =2a/v |
| TD: Debye temperature = ℏωmax/kB | τ*: characteristic cycle time (= ℏ/gτmin) |
A crystalline solid composed of N coupled oscillators will manifest quantum statistical behaviour (such as the power-law scaling of the specific heat with temperature) in the low-temperature range: T ≪ TD, where the Debye temperature is TD = hωD/kB. Likewise, a network of coupled enzymatic oscillators will manifest its quantum dynamics provided the mean time for nutrient supply is below the mean turnover time for the enzymatic processes, or τ ≪ τ*. Thus, the control parameter in the case of metabolism, the rate of nutrient supply, replaces temperature in equilibrium thermodynamics as an environmental variable. The inherent oscillator frequency of crystal oscillators is replaced by the mean turnover time of the enzymatic processes as an internal variable of the system that characterizes it. Therefore, the presence of quantum conditions for metabolism is predicated on the condition for the time between nutrient supply events to be shorter than the inherent enzymatic turnover time. Conversely, the classical limit occurs when τ ≫ τ*, where τminτ* = h/2πg with the minimum turnover rate for enzymes determined by the speed of the signalling processes v such that τmin = 2a/v. The signalling process may be electromagnetic, mechanical or chemical depending on each particular case considered. With a fixed value of the environmentally determined period of nutrient supply, an elongation of the minimum cycle time leads to a classical limit. This corresponds to a relative oversupply of metabolic substrates. Conversely, a quantum metabolism phenomenon can be linked to the restricted supply of metabolic energy in analogy with the restricted amount of thermal energy in quantum solids.
We can now proceed to the mathematical determination of metabolic rate as a function of physical dimensionality d and the conditions set by the environment in terms of nutrient supply rates. Using x = ℏβω, the average metabolic energy is calculated as
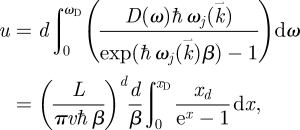 |
3.6 |
where L is the linear dimension of the system. Hence, the metabolic rate is given by
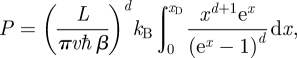 |
3.7 |
where the integral is proportional to the so-called Debye function (in n-dimensional space) defined as follows:
| 3.8 |
which is plotted in figure 1 using the logarithmic scale. Note that the limit as the integral goes to infinity is known:
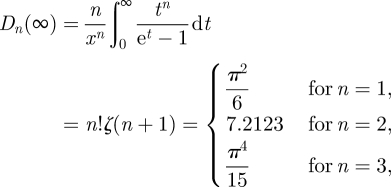 |
3.9 |
thus,
Figure 1.

Log–log plots of the Debye functions 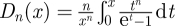 for one, two and three dimensions. Higher dimensions give lower curves.
| 3.10 |
Consequently, the total metabolic energy can be found by integration as
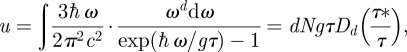 |
3.11 |
where Dd is the Debye function of order d defined above. We now consider the computation of equation (3.11) under two extreme cases defined by τ* and τ.
(i) We consider the case τ ≪τ* (quantum limit) that yields the scaling of the metabolic energy with the characteristic cycle time as
| 3.12 |
where the coefficient C1 is proportional to the number of oscillators N, dimensionality d and the parameter g that contains universal constants and dimensionality-dependent coefficients found in equation (3.9). We assume that the metabolic energy is proportional to the weight of the organism W, u = rW, and hence the cycle time scales with weight according to
| 3.13 |
where C2 = (r/C1)1/(d+1).
Therefore, to obtain the basal metabolic rate (BMR) in the organism, P, as the value of energy per unit time, we divide u by τ and find that
| 3.14 |
where α = γCΔp based on equation (1.1) and α = (a/C1)d/(d+1) based on equations (3.12) and (3.13).
This is our central mathematical result in this paper. The dependence on the dimension leads to the following. For example, in linear geometry, d = 1, the scaling law obtained gives an exponent 1/2, while in planar geometry, d = 2, it becomes 2/3 and finally in three dimensions, d = 3, we find the exponent to be 3/4. Note that as the embedding spatial dimensionality of the biological system of oscillators, d, increases asymptotically, the exponent tends to one. This corresponds also to what we refer to as the classical exponent that is found in the limit of τ ≫ τ*.
(ii) We now consider the case τ ≫ τ*. It is important to stress that the quantum limit corresponds to τ ≪ τ* and the classical limit to τ ≫ τ*; the latter results in the other asymptotic limit of the Debye function and consequently for the metabolic energy we obtain
| 3.15 |
Hence, P = dNg, which is proportional to the number of oscillators and scales with W, i.e. BMR scales with mass linearly in the classical limit. Note that up to the leading order, the same isometric scaling relationship applies to the Einstein methodology in which the quantum oscillators are decoupled from one another. The pre-factor in both models is proportional to the number of degrees of freedom (dN) and hence also to the spatial dimensionality. Thus, in addition to a difference in the scaling exponent β = d/(d + 1), the value of the metabolic rate depends on dimensionality d. Thus, the higher the dimensionality, the greater the metabolic rate is expected to be.
In both these asymptotic limits (infinite dimensionality and/or long cycle time), we have obtained isometric scaling relations. The present model has been able to lead to a range of exponents between 1/2 and 1 (figure 1), which cover all empirically observed values, by changing either the dimensionality (d = 1, 2 or 3) or cycle time. To the best of our knowledge, there is no other cell-level-based model capable of doing this. Both for infinite dimensionality and for all τ values, as well as in the limit of large τ and arbitrary d, we end up with the same (linear) scaling law. This situation can be interpreted in physiological terms as taking place under the conditions of nutrient oversupply. Interestingly, isometry is often found in biological conditions where this is indeed the case, such as in plants that have a virtually boundless supply of light energy and in certain bacteria that live in abundant nutrient conditions.
Note that these scaling laws apply strictly speaking to the continuum limit of the model, which means the finite value of the distance between the neighbouring molecular oscillators plays no role here. However, as can be seen from figure 1, in the asymptotic limit of the Debye function argument x → 0, the exponent changes continuously, flattening the curve on approaching the origin, which means that effectively the dimensionality tends to zero (d = 0) and the scaling exponent for BMR disappears as the metabolic rate P no longer depends on the weight of the organism.
Within the Debye methodology, the scaling law applies strictly speaking only to the asymptotic regime (the so-called quantum regime). As in the opposite case (the classical regime) the resultant relationship is an isometry, it is not difficult to find out that the intermediate ranges of cycle times result in power-law relationships interpolating between the two extremes (Landau & Lifshitz 1984).
4. Discussion
The empirical studies that have been documented in the works of several authors and organized in the recent studies by Glazier (2005) and Makarieva et al. (2008) indicate a large variation in both the proportionality constants and the scaling exponents that describe the allometric rules. The proportionality constants are highly taxon dependent. They also vary between endotherms and ectotherms. The scaling exponents are also taxon dependent with β = 1 for plants and prokaryotes and β = 2/3 and 3/4 for animals. These values deviate somewhat from the precise fractions depending on the species (Makarieva et al. 2008). However, the exponent is not uniquely defined by the taxon and may depend on environmental conditions (availability of resources, for example).
Our model indicates that the proportionality constant α is determined by the bioenergetic properties of the membrane as α = γCΔp, where C is the proton conductance, γ is a proportionality constant and Δp the proton-motive force. The quantities C and Δp vary between uni-cells, mitochondria and chloroplasts (table 2). The scaling exponent β is dependent on two properties: (i) the relation between the resource constraints (mean cycle time, τ) and the characteristic cycle time τ* and (ii) the dimension of the enzymatic distribution of the molecular networks.
The condition τ ≪ τ* corresponds to the case where the cycle time describing nutrient flow is relatively short. This reflects well the characteristics of animals that derive their nutrients from plants. In this case, the energy transduction process is quantized and the scaling exponent β will be now dependent on the dimension of the molecular oscillator network. Here, we have β = d/(d + 1), so if the enzymes are located in a chain along a line, then d = 1 gives β = 1/2, if they are located anisotropically on a plane, then d = 2 gives β = 2/3 and if these enzymes are distributed uniformly in space, d = 3 gives β = 3/4.
The condition τ ≫ τ* corresponds to the case where the cycle time is long. This situation will be typical of plants (which use light as the source of energy) and prokaryotes, which generally have a large nutrient supply available. Energy transduction in this model will be continuous or classical. The scaling exponent is now given by β = 1. For most large organisms, taxa determine whether τ ≪ τ* or τ ≫ τ*. Hence, taxa largely define whether the system is in the quantum or classical regime. In colonial organisms, external conditions may result in a shift from τ ≪ τ* to τ ≫ τ*, which is a shift from the quantum to the classical state.
This latter situation is exemplified by the experiment on colonial organisms described by Nakaya et al. (2003), which has indicated that environmental conditions may induce a shift from a 3/4 scaling rule to isometry. Hence the scaling exponent is highly dependent on the interactions between cells in the organism that merits special attention in the context of the present work.
Colonial organisms are composed of units that are identical in size and form, populating a two-dimensional surface. Unitary organisms are composed of units that are identical in size and populate a three-dimensional volume. In the ordinary state, there are strong interactions between individual units while the take-over state is characterized by either no or weak interactions between the individual units. Importantly, there was an observed 50 per cent reduction in the total metabolic rate in the take-over state, with no change in the supply of nutrients to the colony. We can interpret this as a shift from an adequately supplied metabolizing system to one that is oversupplied (by a factor of 2) with metabolic substrates. This could then be brought to bear on the theory presented in this paper. We argue that the ordinary state is a three-dimensional quantum metabolic state with an exponent β = 3/4 while the take-over state is energy-oversupplied (i.e. a classical state), leading to an isometry and hence β = 1.
5. Conclusions and implications
The thrust of our approach in this paper was to derive at a cellular level a general expression for the metabolic rate as a function of cycle time and the dimensionality of the physical space embedding the set of energy-transducing enzymes. Uni-cells, mitochondria in eukaryotes and thylakoid membrane in chloroplasts have different geometrical structures leading to different scaling laws for their metabolic rates. We have derived a relationship between the metabolic energy, u, and the cycle time, τ, and spatial dimensionality of the oscillator network, d, to show that for one-dimensional systems the metabolic rates scale with mass through a 1/2 exponent, in two-dimensional systems through a 2/3 exponent, while in three-dimensional systems, the 3/4 exponent is found. When the embedding dimensionality d tends to infinity, the scaling relationship becomes an isometry. Moreover, we obtained a condition characterizing a transition from a quantum metabolic regime whose scaling exponent is dimensionality dependent to a classical state that leads to an isometry in all dimensions. The criterion separating the classical from the quantum regime is analogous to the Debye criterion used for solids, and it basically links it to the oversupply (classical metabolism—isometry) or adequate supply/undersupply of nutrients (quantum metabolism—allometry) in the surrounding environment. These results form a cornerstone of our explanation of the experimental observations accumulated by various authors over many decades. They also suggest how both the geometry of the metabolic network and the environmental conditions can generate significant changes in metabolic rates, a situation that has significant implications, for example, in developmental biology or adaptation of living organisms to environmental conditions.
The bioenergetics of metabolism depends on three factors: (i) the composition of the bio-membrane, which determines the proportionality constants; (ii) the dynamics of resource constraints, which determines whether the energy transduction mechanism follows quantum or classical rules; and (iii) the geometry of the molecular oscillator network for systems in the quantum regime, which determines the actual value assumed by the scaling exponent.
The model put forth in this paper and developed for higher organisms accommodates both single cell and multi-cellular organisms because the only difference will be in the geometrical arrangement of the cells and their mitochondrial proteins as well as their interactions. In the ordinary state, the Debye methodology of quantum metabolism in three-dimensional space is appropriate and leads to the 3/4 scaling law. In the take-over state, the classical metabolism in two-dimensional space applies, leading to isometry. Note that in the classical methodology, spatial dimensionality changes the pre-factor in the BMR from 3 to 2 (lowering the rate) and the lack of (quantum) interactions results in the scaling exponent β changing from 3/4 to 1. We point to the distributed arrangement of membrane proteins in mitochondria (two dimensional or quasi-three dimensional) and elliptical arrangement in bacteria. These cases can be expected to lead to fractional exponents between 2/3 and 3/4. In the case of plants, thylakoid membrane proteins appear to be arranged almost linearly, but the resultant scaling exponent is an isometry rather than the expected 1/2 from the quantum regime of the allometric law. Note, however, that a transition from fractional exponents to isometry may also signal a change from the quantum to the classical regime, i.e. a relative elongation of the mean cycle time as would be expected from much more slowly metabolizing plant cells.
Our analysis shows that the variability in proportionality constants and scaling exponents can be explained in terms of proton and electron dynamics, which regulates energy transduction across membranes. Consequently, under certain classes of ecological constraints, the scaling exponent β is completely determined by the relation between τ and τ* and independent of the geometry. It is worth mentioning in this connection that cycle time can be experimentally manipulated, for instance, using uncoupling agents and inhibitors of electron transport. There are six distinct types of poisons that may affect mitochondrial function (Roskoski 1996): (i) respiratory chain inhibitors (e.g. cyanide, antimycin, rotenone, TTFA, malonate), which block respiration in the presence of either ADP or uncoupling agents; (ii) phosphorylation inhibitors (e.g. oligomycin), which abolish the burst of oxygen consumption; (iii) uncoupling agents (e.g. DNP, CCCP, FCCP, oligomycin), which disrupt the linkage between the respiratory chain and the phosphorylation system; (iv) transport inhibitors (e.g. atractyloside, bongkrekic acid, NEM), which prevent either the export of ATP or the import of raw materials across the mitochondrial inner membrane; (v) ionophores (e.g. valinomycin, nigericin), which make the inner membrane permeable to compounds that are ordinarily unable to cross it; and (vi) Krebs cycle inhibitors (e.g. arsenite, aminooxyacetate), which block one or more of the TCA cycle enzymes, or an ancillary reaction. Experiments involving such chemical compounds and measurements of metabolic rates could provide new insights into malleability of scaling laws owing to changes in the prevailing molecular parameters.
Acknowledgements
J.A.T. thanks NSERC, the Allard Foundation and the Alberta Cancer Foundation (ACF) for funding support for this work. L.D. was supported by the Max Planck Society.
References
- Arnold L., Gundlach V. M., Demetrius L. 1994. Evolutionary formalism for products of positive random matrices. Ann. Appl. Probab. 4, 859–901. ( 10.1214/aoap/1177004975) [DOI] [Google Scholar]
- Bianchi M. 2008. Collective behavior in gene regulation: metabolic clocks and cross talking. FEBS J. 275, 2356–2363. ( 10.1111/j.1742-4658.2008.06397.x) [DOI] [PubMed] [Google Scholar]
- Demetrius L. 2003. Quantum statistics and allometric scaling of organisms. Phys. A 322, 477–480. ( 10.1016/S0378-4371(03)00013-X) [DOI] [Google Scholar]
- Demetrius L. 2006. The origin of allometric scaling laws in biology. J. Theor. Biol. 243, 455–467. ( 10.1016/j.jtbi.2006.05.031) [DOI] [PubMed] [Google Scholar]
- Froehlich H. 1968. Long-range coherence and energy storage in biological systems. Int. J. Quant. Chem. 2, 641–649. ( 10.1002/qua.560020505) [DOI] [Google Scholar]
- Froehlich H. 1972. Selective long range dispersion forces between large systems. Phys. Lett. A 39, 153–155. ( 10.1016/0375-9601(72)91060-2) [DOI] [Google Scholar]
- Froehlich H. 1980. The biological effects of microwaves and related questions. Adv. Electron. Electron Phys. 53, 85–152. ( 10.1016/S0065-2539(08)60259-0) [DOI] [Google Scholar]
- Glazier D. S. 2005. Beyond the 3/4 power law: variation in the intra- and inter-specific scaling of metabolic rate in animals. Biol. Rev. 80, 611–662. ( 10.1017/S1464793105006834) [DOI] [PubMed] [Google Scholar]
- Haken H. 1983. Quantum field theory of solids: an introduction. Amsterdam, The Netherlands: Elsevier Science. [Google Scholar]
- Harold F. M. 1986. The vital force: a study of bioenergetics. New York, NY: Freeman. [Google Scholar]
- Hemmingsen A. M. 1960. Energy metabolism as related to body size and respiratory surfaces and its evolution. Rep. Steno Mem. Hosp. Copenhagen 9, 1–110. [Google Scholar]
- Hochachka P. W., Somero G. W. 2000. Biochemical adaptation. Oxford, UK: Oxford University Press. [Google Scholar]
- Kleiber M. 1961. The fire of life. An introduction to animal energetics. Huntington, NY: R.E. Krieger. [Google Scholar]
- Klevecz R. R., Li C. M., Marcus I., Frankel P. H. 2008. Collective behavior in gene regulation: the cell is an oscillator, the cell cycle a developmental process. FEBS J. 275, 2372–2384. ( 10.1111/j.1742-4658.2008.06399.x) [DOI] [PMC free article] [PubMed] [Google Scholar]
- Landau L. D., Lifshitz E. M. 1984. Statistical physics. Course of Theoretical Physics, no. 5, 3rd edn London, UK: Butterworth-Heinemann. [Google Scholar]
- Liu D. S., Astumian R. D., Tsong T. Y. 1990. Activation of Na+ and K+ pumping modes of (Na,K)-ATPase by an oscillating electric field. J. Biol. Chem. 265, 7260–7267. [PubMed] [Google Scholar]
- Makarieva A. M., Gorshkov V. G., Li B. L., Chown S. L., Reich P. B., Gavrilov V. M. 2008. Mean mass-specific metabolic rates are strikingly similar across life's major domains: evidence for life's metabolic optimum. Proc. Natl Acad. Sci. USA 105, 16 994–16 999. ( 10.1073/pnas.0802148105) [DOI] [PMC free article] [PubMed] [Google Scholar]
- Mihaly L., Martin M. C. 1996. Solid state physics: problems and solutions. New York, NY: John Wiley and Sons. [Google Scholar]
- Nakaya F., Saito Y., Motokawa T. 2003. Switching of metabolic rate scaling between allometry and isometry in colonial ascidians. Proc. R. Soc. Lond. B 270, 1105–1113. ( 10.1098/rspb.2003.2347) [DOI] [PMC free article] [PubMed] [Google Scholar]
- Palumbo M. C., Farina L., De Santis A., Giuliani A., Colosimo A., Morelli G., Ruberti I. 2008. Collective behavior in gene regulation: post-transcriptional regulation and the temporal compartmentalization of cellular cycles. FEBS J. 275, 2364–2371. ( 10.1111/j.1742-4658.2008.06398.x) [DOI] [PubMed] [Google Scholar]
- Rolfe D. F., Brown G. C. 1997. Cellular energy utilization and molecular origin of standard metabolic rate in mammals. Physiol. Rev. 77, 731–758. [DOI] [PubMed] [Google Scholar]
- Roskoski R., Jr 1996. Biochemistry. Amsterdam, The Netherlands: Elsevier. [Google Scholar]
- Rowlands S., Eisenberg C. P., Sewchand L. S. 1983. Contractils: quantum mechanical fibrils. J. Biol. Phys. 11, 1–4. ( 10.1007/BF01857965) [DOI] [Google Scholar]
- Rubner M. 1908. The problem of life and its relationship to growth and nutrition (in German). Munich, Germany: Oldenburg. [Google Scholar]
- Scheffler I. E. 2008. Mitochondria, 2nd edn New York, NY: John Wiley and Sons. [Google Scholar]
- Schmidt-Nielsen K. 1984. Scaling: why is animal size so important? Cambridge, UK: Cambridge University Press. [Google Scholar]
- Singer S., Nicholson G. L. 1972. The fluid mosaic model of the structure of cell membranes. Science 175, 720–730. ( 10.1126/science.175.4023.720) [DOI] [PubMed] [Google Scholar]
- Tsong T. Y. 1987. Electroconformational coupling and membrane protein function. Prog. Biophys. Mol. Biol. 50, 1–45. ( 10.1016/0079-6107(87)90002-2) [DOI] [PubMed] [Google Scholar]
- Tsong T. Y. 1990. Electrical modulation of membrane proteins: enforced conformational oscillations and biological energy and signal transductions. Annu. Rev. Biophys. Biophys. Chem. 19, 83–106. ( 10.1146/annurev.bb.19.060190.000503) [DOI] [PubMed] [Google Scholar]
- Tsong T. Y., Astumian R. D. 1988. Electroconformational coupling: how membrane-bound ATPase transduces energy from dynamic electric fields. Annu. Rev. Physiol. 50, 273–290. ( 10.1146/annurev.ph.50.030188.001421) [DOI] [PubMed] [Google Scholar]
- Webb S. J. 1980. Laser-Raman spectroscopy of living cells. Phys. Rep. 60, 201–224. ( 10.1016/0370-1573(80)90149-0) [DOI] [Google Scholar]
- Westerhoff H., Tsong T. Y., Chock P. B., Chen Y. D., Astumian R. D. 1986. How enzymes can capture and transmit free energy from an oscillating electric field. Proc. Natl Acad. Sci. USA 83, 4734–4738. ( 10.1073/pnas.83.13.4734) [DOI] [PMC free article] [PubMed] [Google Scholar]