

Abstract
Most macrofungi produce ephemeral fruit bodies during autumn but some have adapted to spring fruiting. In this study, temporal changes in the time of spring fruiting in Norway and the UK during 1960–2007 have been investigated by statistical analyses of about 6000 herbarium and field records, covering 34 species. Nearly 30 per cent of the temporal variation in fruiting could be ascribed to spatial and species-specific effects. Correcting for these effects, linear trends towards progressively earlier fruiting were detected during the entire period in both Norway and the UK, with a change in average fruiting day of 18 days over the study period. Early fruiting was correlated with high winter temperatures in both countries, indicating that the observed phenological changes are likely due to earlier onset of spring. There were also significant correlations between climatic conditions in one year and timing of fruiting the following year, indicating that below-ground mycelia are influenced by climatic conditions over a longer time period before fruiting. Fruiting dates were, however, not strictly related to changes in vernal accumulated thermal time. Our results indicate that global warming has lead to progressively earlier fruiting of spring fungi in northwest Europe during the last half century.
Keywords: spring fungi, phenology, fruit bodies, climate change, thermal time
1. Introduction
Recent climate change has resulted in changes in the timing of phenological events in many organisms (Fitter & Fitter 2002; Root et al. 2003; Gordo & Sanz 2005; Jonzén et al. 2006; Menzel et al. 2006), but relatively little attention has been paid to how micro-organisms, including fungi, respond to climate change. However, some studies from Norway and the UK have reported shifts in the phenology of fungus fruiting bodies over the last 50 years (Gange et al. 2007; Mattock et al. 2007; Kauserud et al. 2008; Moore et al. 2008). In the UK, an extension of the autumnal fruiting season in both directions has been observed (i.e. earlier onset and later finish) both for mycorrhizal and saprotrophic species (Gange et al. 2007). Since 1975, many species of fleshy fungi that were formerly reported only to fruit in autumn now also fruit in spring (Gange et al. 2007; Moore et al. 2008). In Norway, the autumnal fruiting season has been significantly delayed both for mycorrhizal and saprotrophic taxa (Kauserud et al. 2008), which has been coupled to an extended growing season and, hence, a delayed arrival of the autumn and of climatic conditions that favour fruiting. Whether the documented changes have effects on the carbon cycle owing to a prolonged fungal growing season is not yet known.
Most macrofungi (i.e. those with macroscopic fruiting bodies) produce ephemeral fruit bodies during autumn, while some (e.g. many bracket fungi) have perennial fruit bodies. A few species have adapted to fruiting during spring, especially ascomycetes such as morels and various cup fungi of Pezizales. Using yearly first observation data for four common spring-fruiting fungi, Mattock et al. (2007) reported dramatic displacements of the fruiting period (towards earlier fruiting) in 1950–2006 in the UK and evidence of correlation between spring temperature and fruiting time of the four species. For agricultural crops and other plants, many phenological and growth processes have been shown to be related directly to the accumulated thermal time (or growing degree days) experienced by the crop (Chmielewski 2003). However, to date, these methods have not been applied to the study of fruiting in macrofungi.
Few data have been collected specifically for phenological studies of fungal fruiting. However, large datasets of records of fungal fruit bodies are becoming available when collection databases are opened for free access, e.g. via the GBIF portal (http://www.gbif.org). Such data are highly relevant for studies of phenological change (Kauserud et al. 2008) because most fleshy fruit bodies are ephemeral (lasting for only a few days, up to few weeks) so that the date of collection represents a good phenological record. In the small study by Mattock et al. (2007), a strong correlation was found between phenological data obtained from a database of fruit body records filed by the public and data collected from a smaller region by use of more rigorous procedures. Herbarium specimens have also proved useful for monitoring phenological changes in plants (Primack et al. 2004).
In this study, we analyse changes in fruit body phenology using extensive herbarium databases in Norway and the UK to determine (i) if spring fruiting in Norway and the UK has responded differently to climate change, as appears to be the case for autumn fungi (Gange et al. 2007; Kauserud et al. 2008; Moore et al. 2008) and (ii) what climatic factors are correlated with timing of fruit body production, and if these factors differ between Norway and the UK. We also examine the effects of weather variables in the preceding season on vernal (spring) fruiting. For the first time, we also evaluate whether between-year variation in accumulated thermal time can explain phenological changes of spring fungi.
2. Material and methods
(a). Data
The data on fungal fruiting comprise 6007 dated records of fungi that produce ephemeral fruit bodies in spring, collected between 1960 and 2007. Of these, 2241 records were from Norway and 3766 from the UK (excluding Northern Ireland). All records were geo-referenced to municipality for Norway and vice-county for the UK. Data from Norway were obtained from the Norwegian Mycology Database (Natural History Museum, University of Oslo), and in the UK from the Fungus Record Database (FRDBI). The data cover 34 species of which 24 occur in Norway and 22 in the UK (12 are shared between the two countries; electronic supplementary material, table S1). Most of the analysed species are considered to be saprotrophic (electronic supplementary material, table S1). The number of records for each species ranged from 15 to 713 (electronic supplementary material, table S1). In this study, we use the day of the year (January 1 = 1) as the response. The start of the fruiting season for spring fungi is set as October 1 (day −91); please note that days of the year in October–December are negative. This was done because many of the UK spring fungi also fruit in November and December. The total distribution of observations (1960–2007) during the year is shown in figure 1, separately for Norway and the UK.
Figure 1.

The annual temporal distribution of observations in (a) Norway and (b) the UK during the period 1960–2007. Each line represents the relative accumulated number of observations during one year, where 1 = 1st of January. Colours represent the different decades: violet lines, 1960–1969; blue lines, 1970–1979; green lines, 1980–1989; orange lines, 1990–1999; and red lines, 2000–2007.
Data on mean monthly temperature and precipitation anomalies for the period 1959–2007 (relative to the 1961–1990 standard period) were obtained from the Norwegian Meteorological Institute for five climate regions in Norway and from the meteorological data services of BBSRC for six regions in the UK. Mean monthly temperature and precipitation are coded as Tjan and Pjan for January, Tfeb and Pfeb for February and so on, while LTjan and LPjan indicate the climatic conditions for the preceding year.
The accumulated temperature sum (thermal time) for each day of the year was calculated for each climate region with January 1 as a start date. Daily mean temperatures were estimated by linear interpolation between monthly temperature means, and thermal time was obtained for each observed fruiting day in each region. The thermal times are estimated for broad regions only, and changes in the thermal time are only considered approximate indicators of what species experience.
(b). Statistical analyses of spatial and temporal trends
For the statistical analyses, we used the R-software (R Development Core Team 2008), and the R-packages ‘mgcv’ (Wood 2006) and ‘nlme’ (Pinheiro et al. 2008).
To describe the data, we performed a partitioning of the variability (Legendre & Legendre 1998) with respect to the information contained by the different species, different geographical extent and different countries. Then, we analysed the temporal trend of the combined data from the UK and Norway by a regression procedure using a generalized additive mixed effects model (GAMM) (Wood 2006). Here, we applied similar model specifications for random effects as the analyses of climatic influence (below). The temporal trends were also analysed with focus on the start and end of the fruiting season analysed by a procedure similar to that of Gange et al. (2007). For the annual fruiting, temporal development of the 2.5th, 50th and 97.5th percentiles was analysed using a generalized additive model (Wood 2006). Percentiles were used to reduce the effect of changes in observation numbers.
Using an alternative approach, the proportion of species whose mean and median fruiting day had moved forward or backward was determined, and then a binomial test was performed to determine whether these proportions had changed between the start (1960–1969) and end (1998–2007) of the study period. If changes were random, we would expect as many positive as negative differences. Furthermore, the annual change in fruiting day for each species was estimated by generalized least squares (Pinheiro & Bates 2002) in which a power-function compensation for heteroscedasticity was included. To compensate for potential confounding effects of geography, we included an offset by a thin-plate spline of longitude and latitude. Further, to test the significance of each relationship, we applied a wild bootstrap (Liu 1988; Mammen 1993), i.e. bootstrap observations were obtained by resampling the sign of the residuals. The signs were resampled for all residuals in each year. By this approach, we keep temporal differences in variance, as well as in year dependencies (Kauserud et al. 2008). Subsequently, we evaluated the species-specific estimated annual change against the corresponding initial mean fruiting day.
(c). Statistical analyses of effects of climate on fruiting day and thermal time
Owing to the complexity of the data, with potential dependencies and intricate residual structures, we applied a mixed effects model and included an offset step to centre the response on species and geography, which are both potentially confounding variation in fruiting day (our response variable). The model exercise applied here consists of three steps: (i) offset (i.e. normalization of the response), (ii) model specification, and (iii) model selection.
The observation of the sth species, s = 1 … S, was recorded by day of year (Day) for the kth observation (k = 1 … nij) in the ith county (i = 1 … I) at the jth time (j = 1 … Ji). The variable time represents the years from 1960 to 2007, and the subscripts reflect the possibility that several records of fruit bodies were observed in a particular county in a specific year.
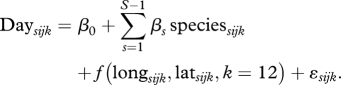
To offset (i) the potentially confounding effects of species and geography, we assume a normal distribution by which the offset has the same effect as extracting the residuals (rDay) for subsequent analyses:
 |
2.1 |
Here f(longsijk, latsijk, k = 12) is a thin-plate spline of longitude (long) and latitude (lat) with 12 knots (Wood 2006). Residual day of the year, ϵsijk = rDayijk was used as the response in subsequent analyses. This approach quantifies climatic effects conservatively, as only effects that are not explainable through geographical or interspecific differences are analysed.
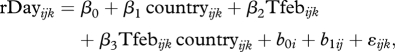
For the model specification (ii), we recognize that the data require a model with two components: fixed effects and random effects. The fixed effects are effects that are constant (fixed) for all observations; it is the fixed effects that we want to estimate and interpret as biological trends. The random effects are stochastic contributions to the variability of the records that can be ascribed to grouping or nesting in the data (Pinheiro & Bates 2002). In this study, we recognize random effects as counties (geographical dependency) and year within county (temporal dependency). In addition, we evaluate the residual structure for signs of a non-constant residual variance. There are alternative specifications for the random effects, such as cross-random effects and year with county nested in year, but the structure described was found statistically appropriate by an AIC (Akaike's information criterion, Hastie et al. 2001). The model specifications can be illustrated by the relationship between residual day of year (rDay) and February temperature:
 |
2.2 |
where the βi are fixed effects to be estimated for differences between Norway and the UK (country, coded as 0 and 1) and the effect of temperature in February. The b0i is the county-specific random effect (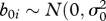 )), and the b1ij is the time-specific random effect within counties (
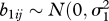 )). Then the residual effect is
  ), where δ is the power coefficient of time, time = year 1959, to be estimated. This basic framework was used for specification of the final model.
For both responses, day of year and thermal time, the model selection (iii) included two models to explore: (i) the effect of time and (ii) the effect of monthly mean climate (temperature and precipitation).
For estimating the temporal trend (i) on both responses, we used a cubic smooth spline specification of the temporal trend through a GAMM. We allowed the two countries potentially to differ with respect to temporal trends in fruiting time.
The model selection of climate variability on the responses, day of year and thermal time, follows exactly the same procedure. The effect of monthly mean temperature and precipitation, as well as a one-year lag of temperature and precipitation, was estimated from the combined dataset (Norway plus the UK). The climate variables were included in the model by a forward-selection procedure based upon AIC using maximum likelihood estimating the effects of the linear mixed effects (LME). Selection stopped when the variables failed to improve the model according to the AIC. However, the AIC was found to favour rather complex models with several non-significant terms. Therefore, a backward elimination of the covariates selected by the AIC was performed. A marginal F-test, with 5 per cent as critical level, was used to prune the interaction terms and subsequently also main effects that were not part of an interaction effect. For the final fixed-effect model, we checked the specification of the covariance, by reducing the complexity of the random effect structure. To obtain correct estimates of the random effects for comparison between models of different random contributions, we used a restricted maximum-likelihood LME. This eventually produced a model that described the effect of monthly temperature and precipitation, and whether there was a difference between Norway and the UK, with respect to those particular effects. This was performed for both day of year and thermal time as response variables.
3. Results and discussion
(a). Spatial and temporal variation in spring fruiting 1960–2007
Analysis of the potential contribution of spatial and species effects on the variation in fruiting dates for the pooled data from Norway and the UK revealed that longitude/latitude accounted for 13.9 per cent of the variation, country (Norway versus the UK) for 10 per cent, while species effects accounted for 16.8 per cent of the variation. The combined effect of longitude/latitude, species and country accounted for 28.2 per cent of the variation, which leaves 71.8 per cent of the temporal variation in fungal fruiting to be attributed to other factors, including variation in climate conditions. Looking at the two regions separately, the effects of longitude/latitude were higher in Norway than in the UK (10.2% versus 5.0%), while the effects of species-specific differences were far more important in the UK than in Norway (19.3% versus 11.6%). The variation in spring-fruiting date attributable to other factors was at the same level in Norway and the UK, 79.9 per cent and 77.6 per cent, respectively. Norway spans 13° latitude, stretching from boreonemoral to subarctic vegetation zones, and its climate is more heterogeneous than that of the UK, and it is therefore reasonable that a stronger spatial effect is observed in Norway compared with the UK. In contrast, the species-specific effects were stronger in the UK than in Norway, which may result from the spring-fruiting season being longer in the UK, providing opportunities for more displacement than in Norway (cf. figure 1).
Normalized fruiting day showed a distinct south–north trend across the UK and Norway (figure 2), where the mean fruiting date in Northern Norway was about 120 days later than in Southern UK. Mean fruiting date in Northern Scotland was 40 days later than in Southern England, and mean fruiting date in Northern Norway was about 80 days after that in Southern Norway and Northern Scotland. This latitudinal pattern follows general trends well known from plant phenology (Ovaska et al. 2005).
Figure 2.

The distribution of normalized fruiting day across Norway and the UK. Isopleths indicate the mean number of days earlier fruiting (Southern UK) and later fruiting (Scotland and Norway) than the 0 isopleth.
The analysis of the temporal trend revealed that a significant shift towards earlier fruiting was observed both for the UK and Norway (p-value < 0.001; figure 3a). The annual linear trend was estimated to be −0.37 ± 0.07, suggesting on average 18 days earlier fruiting over the entire study period and 3.8 days per decade. The temporal trends were not significantly different between Norway and the UK (interaction; F1,4008 = 3.2, p-value = 0.073). However, there was a slight tendency for a steeper trend in the UK than in Norway. The phenological changes in fruiting of spring fungi in Norway and the UK during the period 1960–2007 correspond well with trends observed for other organism groups in Western Europe. Warmer springs have led to earlier leaf unfolding and flowering of plants (Fitter & Fitter 2002; Badeck et al. 2004; Wolfe et al. 2005; Menzel et al. 2006), earlier arrival of migratory birds (Jonzén et al. 2006; Rubolini et al. 2007) and earlier appearance of insects (Roy & Sparks 2000; Harrington et al. 2007). Cross-European plant phenology studies have showed that leaf unfolding and flowering in spring and summer have, one average, advanced by 1–3 days per decade in Europe (reviewed by Rosenzweig et al. 2007), corresponding well with our estimate for spring fungi (3.8 days per decade).
Figure 3.

(a) Temporal changes in the mean annual fruiting date (thick lines) during the period 1960–2007 for spring fungi in Norway (red) and the UK (blue). The broken lines are 95% pointwise confidence intervals. (b,c) Temporal changes in the annual 2.5th, (blue), 50th (green) and 97.5th (red) percentile of day of year during the period 1960–2007 in (b) Norway and (c) the UK. The thick lines indicate the average trend, while the broken lines are 95% pointwise confidence intervals. (d) Temporal changes in the mean thermal time (temperature sum) to fruiting during the period 1960–2007 for spring fungi in Norway (red) and the UK (blue). The middle lines indicate the average while the upper and lower are 95% pointwise confidence intervals.
To determine the extent to which the start and end of the spring season has changed, we extracted the 2.5th and 97.5th percentiles of records per year (standardized by both species and geography) (figure 3b,c). In the combined dataset, there was a significant nonlinear change both in the early percentile (F2.5,44.5 = 4.96, p = 0.007) and in the late percentile (F7.6,39.4 = 3.12, p = 0.009). However, for Norway, there were no significant trends in the 2.5th percentile (F1,46 = 1.34, p = 0.253, figure 3b) or the 97.5th percentile (F1,46 = 0.28, p = 0.598), but a significant change in the 50th percentile (median, F1,46 = 5.8, p = 0.020). On the other hand, in the UK, there was a strong nonlinear trend in the 2.5th percentile towards earlier fruiting (F2.2,44.8 = 6.74, p = 0.002, figure 3c), but no significant trend in the 97.5th percentile (F1,46 = 0.61, p = 0.440). In the UK as in Norway, there was a linear trend in the median (F1,46 = 12.1, p = 0.001). Thus, our analyses indicate that the end of the spring season has remained constant in both Norway and the UK during the investigation period, but that the start of the season has in the UK become earlier during the period 1960–1990 (about 90 days in total) and after remained near constant between 1990 and 2007 (figure 3c). In a study from the UK based on yearly first observations of four spring fungi during the period 1950–2006 (Mattock et al. 2007), fruiting became progressively earlier during the entire period, contrasting somewhat our observations. However, yearly first observations are vulnerable to outlier observations and bias in sampling intensity, while the 2.5th percentile, as used in the present study, probably gives a more robust estimate. We see no obvious reason why the start of the season has changed in the UK and not in Norway.
Analysis of fruiting times of individual species over the study period shows that in Norway, fruiting takes place earlier in recent periods for most species (figure 4a). Binomial test with 24 trials suggests significance both for the mean (P(earlier) = 0.83, p = 0.002) and for the median (P(earlier) = 0.88, p < 0.001) fruiting day. Likewise, in the UK with 18 trials, a significant shift towards earlier fruiting was found both for the mean (P(earlier) = 0.83, p = 0.008) and for the median (P(earlier) = 0.94, p < 0.001) (figure 4b). The results from this alternative analytical approach corresponds well with the results above (figure 3a) and with the study by Mattock et al. (2007). A comparison of the lower and upper confidence limits revealed no significant difference between Norway and the UK in the proportions of species with changed fruiting time. It is somewhat surprising that while the overall spring-fruiting season has been displaced both in Norway and in the UK, the end of the season (both in Norway and in the UK) and the start (only in Norway) has remained unchanged. This may indicate that first or last observational data in some cases do not reflect overall changes in fungal fruiting patterns over the entire fruiting season, in particular as both the mean and median trends are towards earlier fruiting. The results could also indicate that there are some constraints on the ends of the fruiting season, e.g. that the warmer summer conditions, terminating the spring-fruiting season, comes approximately at the same time now as before.
Figure 4.

The change in mean fruiting date for individual species during the period 1960–2007 in (a) Norway and (b) the UK. Points below the diagonal line indicate that fruiting took place earlier during 1988–2007 than during 1960–1969. The vertical distance from the diagonal to each point is the change in mean fruiting day between the two time periods.
To determine if species that fruit early in spring have changed their fruiting time differently from later spring fruiters, we investigated the relationship between species displacement in fruiting date and the mean initial fruiting date (1960–1969). No clear trend was found (p = 0.48 and p = 0.92, for Norway and the UK, respectively). This is in contrast to what was observed for autumnal fruiting fungi in Norway, where early fruiters had displaced their fruiting period significantly more than late-fruiting species (Kauserud et al. 2008).
(b). Climate factors that drive time of fruiting
In estimating the effects of climatic predictors on the fruiting time during the study period 1960–2007 (table 1), the model shows a clear winter temperature effect (Tjan and Tfeb), and suggests that higher winter temperatures give rise to earlier spring fruiting both in Norway and in the UK (table 1). In Norway, the magnitude of the response to warmer January climate amounts to approximately a one-day earlier fruiting (average fruiting time normalized on species and geography) as response to an increase of 1°C, whereas in UK the warmer January and February by 1°C amount to approximately three days earlier fruiting.
Table 1.
The results from analyses of the influence of monthly climate variability on the normalized day of year for fruiting. An LME model with both fixed effects and a random contributiona was estimated. Covariate = climatic and country predictors, value = estimated fixed effects, s.d. error = standard error for the estimated fixed effects, d.f. = number of degrees of freedom. In this analysis, the effects of species and geography were accounted for.
| covariate | value | s.d. error | d.f. | t-value | p-value |
|---|---|---|---|---|---|
| (intercept) | 7.48 | 2.32 | 4010 | 3.23 | 0.001 |
| countryUK | 2.23 | 2.33 | 343 | −0.96 | 0.334 |
| LTjul | −2.82 | 0.66 | 1646 | −4.27 | <0.001 |
| Tfeb | 0.21 | 0.45 | 1646 | 0.48 | 0.632 |
| LPaug | −0.05 | 0.02 | 1646 | −2.79 | 0.005 |
| Tjan | −0.87 | 0.36 | 1646 | −2.44 | 0.015 |
| LToct | 1.17 | 0.59 | 1646 | 1.97 | 0.049 |
| countryUK:LTfeb | −2.47 | 0.76 | 1646 | −3.24 | 0.001 |
aThe random effects were as follows: county s.d. = 10.2, year in county s.d. = 28.7, and residuals s.d.1960 = 23.4, and δNorway = −0.015 and δUK = 0.137. s.d. = standard deviation, and the residual variance is following a power function of time (year 1959) and δ = power coefficient.
It is likely that the fungal mycelia are active over extended periods in winter and spring under warmer conditions, and that they will reach requirements for size and/or nutrient acquisition more rapidly and thus be able to fruit earlier in the year. However, the time and resources required for mycelial growth and subsequent fruit body production are unknown for the vast majority of fungal species (Moore et al. 2008); in many cases, the timescale is likely to be measured in months or even years. In support of this, we observed a strong lagged response, (i.e. a relationship between climate conditions during one year and time of fruiting in the following year) (table 1). In particular, the July temperature and precipitation during August the summer before season will produce an earlier average fruiting (table 1). Noteworthy, a 1°C increase in July temperature amounts to nearly three days earlier fruiting. This indicates that the state of below-ground mycelia of fungi (including the fruiting potential) is determined by climatic conditions over more than a single year. Nevertheless, a warm October (LToct) was associated with a delay in fruiting time (table 1), which means that a warm October may be unfavourable for mycelial growth, leading to a delay in resource acquisition and fruiting. A delayed effect of August precipitation the year before was also found (p = 0.005), indicating that a wet summer is associated with earlier fruiting the next season. Thus, in general, the results suggest that a warm and wet summer produce earlier fruiting next year, and in combination with a cooler autumn but warm winter will give early average fruiting dates. An extended period of mycelial activity might have implications on the carbon cycle in these ecosystems, as a higher degree of respiration then is expected.
(c). Accumulated thermal time
In the analysis of the effects of thermal time, our null hypothesis was that the thermal time at date of fruiting was constant over the investigation period 1960–2007, meaning that fungi has a strict response to thermal time concerning fruiting time. However, when accounting for the difference between species and geographical regions, a clear trend in the normalized thermal time with year was found, both in Norway and in the UK (figure 3d). In Norway, there was a linear increase in thermal time during the period, while in the UK there was an increase in thermal time until 1980 after which it levelled off (figure 3d). The changes in thermal time suggest that spring fungi do not have a fixed thermal time for fruiting. The results indicate that fungal mycelia now receive more thermal energy before fruiting than previously. This indicates that the fungi do not use all of the increased energy supply for fruiting or that additional factors are involved in regulating time of fruiting. The occurrence of lagged responses (i.e. that time of fruiting also depends on climatic conditions the year before) may also contribute to the observed lack of correspondence between thermal time (calculated from 1st of January the same year as fruiting) and fruiting time. Hence, while thermal time is a very good predictor of phenological spring events in plants (Chmielewski 2003), this is apparently not the case for fungi.
The influences of single climate variables on thermal time for fruiting were broadly similar for Norway and the UK (table 2). Thermal time was positively correlated with winter and spring temperatures (TJan, Tfeb and Tmar), whereas a delayed effect of autumn temperature (LTsep) was mainly observed for the UK: a warm September reduced thermal time at fruiting the following year (table 2). Furthermore, a wet winter and spring (Pfeb and Papr) were associated with reduced thermal time at time of fruiting, whereas a wet spring (LPapr and LPmay) was associated with increased thermal time the following year. These results also underline that there is no straightforward relationship between thermal time and time of fruiting in spring fungi, and that precipitation strongly influences the energy budget required for fruiting during spring time.
Table 2.
The results from analyses of the influence of monthly climate on the normalized accumulated temperature sum (thermal time) at the date of fruiting. An LME model with both fixed effects and a random contributiona was estimated. Covariate = climatic and country predictors, value = estimated fixed effects, s.d. error = standard error for the estimated fixed effects, d.f. = number of degrees of freedom. In this analysis the effects of species and geography were accounted for.
| covariate | value | s.d. error | d.f. | t-value | p-value |
|---|---|---|---|---|---|
| (intercept) | −74.79 | 46.67 | 4010 | −1.60 | 0.109 |
| countryUK | 107.02 | 45.38 | 343 | 2.36 | 0.019 |
| Tfeb | 18.54 | 3.68 | 1641 | 5.03 | <0.001 |
| Tjan | 22.25 | 3.09 | 1641 | 7.20 | <0.001 |
| LPmay | 0.53 | 0.18 | 1641 | 3.01 | 0.003 |
| Tmar | 19.12 | 3.92 | 1641 | 4.87 | <0.001 |
| Papr | −0.40 | 0.16 | 1641 | −2.49 | 0.013 |
| LPapr | 0.68 | 0.17 | 1641 | 4.05 | <0.001 |
| Pfeb | −0.40 | 0.15 | 1641 | −2.70 | 0.007 |
| LPjul | 0.31 | 0.26 | 1641 | 1.21 | 0.225 |
| LTsep | 14.31 | 7.45 | 1641 | 1.92 | 0.055 |
| countryUK:LPjul | −0.47 | 0.15 | 1641 | −2.78 | 0.023 |
| countryUK:LTsep | −60.60 | 14.86 | 1641 | −2.85 | 0.004 |
aThe random effects were as follows: county s.d. = 103.2, year in county s.d. = 242.1, and residuals s.d.1960 = 222.4, and δNorway= −0.135 and δUK = 0.223. s.d. = standard deviation, and the residual variance is following a power function of time (year 1959) and δ = power coefficient.
4. Summary
Our results indicate that spring fungi, both in Norway and in the UK, have changed their mean fruiting time towards earlier fruiting during the period 1960–2007 owing to increased temperatures and that the responses have been similar in Norway and the UK. These results are in line with phenological changes observed for other groups of organisms in Western Europe during the same period (Roy & Sparks 2000; Fitter & Fitter 2002; Gordo & Sanz 2005; Jonzén et al. 2006; Menzel et al. 2006; Harrington et al. 2007; Rubolini et al. 2007). Both in Norway and in the UK, high summer temperatures (the preceding year) and winter temperatures were associated with early fruiting, which point towards global warming as an underlying cause for the observed displacements in fruiting time. The magnitude of the response amounts to approximately a five-day shift towards earlier fruiting in response to an increase of 1°C during the winter/spring period. The results also demonstrate that spring fungi show a lag response to climatic conditions occurring during the preceding year. However, thermal time appears not to be a good predictor for fruiting time for spring fungi in general. This study supports the idea that non-systematically collated herbarium and field records are a valuable source of phenological information for fungi if analysed statistically sound.
Acknowledgements
We acknowledge all who have contributed records to the Norwegian Mycological Database and the UK Fungus Record Database (FRDBI), Paul Kirk for help with data acquisition and the Climate Division at the Norwegian Meteorological Institute and BBSRC, for providing climate data. Rothamsted Research receives grant-aided support from the Biotechnology and Biological Sciences Research Council of the UK.
References
- Badeck F.-W., Bondeau A., Böttcher K., Doktor D., Lucht W., Schaber J., Sitch S.2004Responses of spring phenology to climate change. New Phytol. 162, 295–309 (doi:10.1111/j.1469-8137.2004.01059.x) [Google Scholar]
- Chmielewski M.2003Phenology and agriculture. In Tasks for vegetation science. Phenology: an integrative environmental science, vol. 39 (ed. Schwartz M. D.), pp. 505–522 Dordrecht, The Netherlands: Kluwer Academic Publisher [Google Scholar]
- Fitter A. H., Fitter R. S. R.2002Rapid changes in flowering time in British plants. Science 296, 1689–1691 (doi:10.1126/science.1071617) [DOI] [PubMed] [Google Scholar]
- Gange A. C., Gange E. G., Sparks T. H., Boddy L.2007Rapid and recent changes in fungal fruiting patterns. Science 316, 71 (doi:10.1126/science.1137489) [DOI] [PubMed] [Google Scholar]
- Gordo O., Sanz J. J.2005Phenology and climate change: a long-term study in a Mediterranean locality. Oecologia 146, 484–495 (doi:10.1007/s00442-005-0240-z) [DOI] [PubMed] [Google Scholar]
- Harrington R., et al. 2007Environmental change and the phenology of european aphids. Glob. Change Biol. 13, 1550–1564 (doi:10.1111/j.1365-2486.2007.01394.x) [Google Scholar]
- Hastie T., Tibshirani R., Friedman J.2001The elements of statistical learning. New York, NY: Springer [Google Scholar]
- Jonzén N., et al. 2006Rapid advance of spring arrival dates in long-distance migratory birds. Science 312, 1959–1961 (doi:10.1126/science.1126119) [DOI] [PubMed] [Google Scholar]
- Kauserud H., Stige L. C., Vik J. O., Økland R. H., Høiland K., Stenseth N. C.2008Mushroom fruiting and climate change. Proc. Natl Acad. Sci. USA 105, 3811–3814 (doi:10.1073/pnas.0709037105) [DOI] [PMC free article] [PubMed] [Google Scholar]
- Legendre P., Legendre L.1998Numerical ecology. Amsterdam, The Netherlands: Elsevier [Google Scholar]
- Liu R. Y.1988Bootstrap procedures under some non-i.i.d. models. Ann. Stat. 16, 1696–1708 (doi:10.1214/aos/1176351062) [Google Scholar]
- Mammen E.1993Bootstrap and wild bootstrap for high dimensional linear models in resampling. Ann. Stat. 21, 255–285 (doi:10.1214/aos/1176349025) [Google Scholar]
- Mattock G., Gange A. C., Gange E. G.2007Spring fungi are fruiting earlier. Brit. Wild. 18, 267–272 [Google Scholar]
- Menzel A., et al. 2006European phenological response to climate change matches the warming pattern. Glob. Change Biol. 12, 1969–1976 (doi:10.1111/j.1365-2486.2006.01193.x) [Google Scholar]
- Moore D., Gange A. C., Gange E. G., Boddy L.2008Fruit bodies: their production and development in relation to environment. In Ecology of saprotrophic basidiomycetes (eds Boddy L., Frankland J. C., van West P.), pp. 79–102 Amsterdam, The Netherlands: Elsevier [Google Scholar]
- Ovaska J. A., Nilsen J., Wielgolaski F. E., Kauhanen H., Partanen R., Neuvonen S., Kapari L., Skre O., Laine K.2005Phenology and growth in mountain birch provenances of latitudinal, altitudinal and cost—inland gradients. In Plant growth, herbivory and human impact in Nordic mountain birch forests. Ecological studies, 180(eds), pp. 99–116 Berlin, Germany: Springer Verlag [Google Scholar]
- Pinheiro J. C., Bates D. M.2002Mixed effect models for S and S-plus. New York, NY: Springer Verlag [Google Scholar]
- Pinheiro J. C., Bates D., DebRoy S., Sarkar D.The R Core team 2008nlme: linear and nonlinear mixed effects models, pp. 1–90, R package v. 3 [Google Scholar]
- Primack D., Imbres C., Primack R. B., Miller-Rushing A. J., Del Tredici P.2004Herbarium specimens demonstrate earlier flowering times in response to warming in Boston. Am. J. Bot. 91, 1260–1264 (doi:10.3732/ajb.91.8.1260) [DOI] [PubMed] [Google Scholar]
- R Development Core Team 2008R: a language and environment for statistical computing. In R Foundation for Statistical Computing Vienna, Austria, ISBN 3-900051-07-0. See http://www.R-project.org [Google Scholar]
- Root T. L., Price J. T., Hall K. R., Schneider S. H., Rosenzweig C., Pounds J. A.2003Fingerprints of global warming on wild animals and plants. Nature 421, 57–60 (doi:10.1038/nature01333) [DOI] [PubMed] [Google Scholar]
- Rosenzweig C., et al. 2007Assessment of observed changes and responses in natural and managed systems. In Climate change 2007: impacts, adaptation and vulnerability. Contribution of working group II to the fourth assessment report of the Intergovernmental Panel on Climate Change (eds Parry M. L., Canziani O. F., Palutikof J. P., van der Linden P. J., Hanson C. E.), pp. 79–131 Cambridge, UK: Cambridge University Press [Google Scholar]
- Roy D. B., Sparks T. H.2000Phenology of British butterflies and climate change. Glob. Change Biol. 6, 407 (doi:10.1046/j.1365-2486.2000.00322.x) [Google Scholar]
- Rubolini D., Møller A. P., Rainio K., Lehikoinen E.2007Intraspecific consistency and geographic variability in temporal trends of spring migration phenology among European bird species. Clim. Res. 35, 135–146 (doi:10.3354/cr00720) [Google Scholar]
- Wolfe D. W., Schwartz M. D., Lakso A. N., Otsuki Y., Pool R. M., Shaulis N. J.2005Climate change and shifts in spring phenology of three horticultural woody perennials in northeastern USA. Int. J. Biometeorol. 49, 303–309 (doi:10.1007/s00484-004-0248-9) [DOI] [PubMed] [Google Scholar]
- Wood S. N.2006Generlized additive models London, UK: Chapman & Hall [Google Scholar]