

Abstract
We assessed the structure and latitudinal selection that might result in sensitivities to critical day-lengths that trigger diapause between Culex pipiens populations distributed along North-South and East-West axes in eastern North America. Strong population structure between Cx. p. pipiens and Cx. p. quinquefasciatus existed. Among Cx. p. pipiens, a 100-km increase in the latitudinal change resulted in an increased square root of FST by 0.002. A 100-km increase in the longitudinal change caused an increased square root of FST by 0.035. A lack of latitudinal influence on the structure between Cx. p. pipiens populations suggests a uniform signal using the 12 microsatellite markers, which might increase the risk of West Nile virus (WNV) transmission toward northern areas because of longer breeding season, extend host-seeking period, and larger population size. Northern Cx. p. pipiens may have undergone additional generations before diapause is triggered, magnifying population size when WNV amplification is peaking.
Introduction
The recent spread of West Nile virus (WNV) in North America has focused attention on the major mosquito vectors that transmit this infection among birds and humans, such as Culex pipiens pipiens Linnaeus (Northern house mosquito) and Culex pipiens quinquefasciatus Say (Southern house mosquito). These mosquitoes are allopatric in North America. Cx. p. pipiens enters diapause and is typically found north of 39° N latitude, whereas Cx. p. quinquefasciatus does not undergo diapause and is restricted to areas south of 36° N latitude. Both nominal taxa and their intermediates exist between 36° and 39° N latitude.1,2 In these regions of overlap, the Cx. p. pipiens population peaks earlier in the summer season, whereas the Cx. p. quinquefasciatus population does not achieve peak abundance until the end of summer.3
The seasonality of WNV transmission corresponds closely to that of the abundance of anautogenous (i.e., requires a blood meal to reproduce) Cx. p. pipiens. Infection in birds becomes intense in the northeastern United States mainly during late August or September. Presumably, the force of WNV transmission among local birds is driven by the rising mid-summer abundance of these mosquitoes. Near the end of the breeding season, Cx. p. pipiens mosquitoes begin emerging as adults that will enter diapause and that will not seek hosts until spring.4 This diapause is triggered by a combination of short day length and low temperature perceived by the fourth larval instar and pupal stages.3,5
Day length correlates with latitude, and the number of longer days increases with increasing latitude.6 At the latitude of Boston, MA (42.4° N), the abundance of anautogenous Cx. p. pipiens crests in early August, shortly after the local day-length has fallen to < 14.25 h/day.3 This critical diel falls earlier at southern latitudes than in the north. Thus, it may be that Cx. p. pipiens populations and the force of WNV transmission may increase as latitude increases and may wane at lower latitudes because of this disparity in the length of the breeding season.5
Studies on the population structure of Cx. pipiens complex in North America are very important to potentially enable the development of new strategies for controlling the diseases transmitted by these mosquitoes. Such knowledge improves our understanding of how these populations interact with each other geographically, and whether developmental cues, such as diel length, may select for subpopulations that respond differently to changes in day-length. Such changes, if they occur, would tend to be expressed genetically as greater structuring along a latitudinal rather than longitudinal gradient. Previous studies with the use of microsatellite markers7–9 and through enzyme electrophoresis10–14 have not shown the presence or absence of such a pattern.
In this study, we analyze the effects of latitude and longitude on the population structure of Cx. pipiens s.l. mosquitoes based on variation at 12 microsatellite loci15,16 among populations along the North-South (N-S) and East-West (E-W) axes in eastern North America during the breeding season in 2004 and 2005. We explore the possibility that these mosquito populations may be structured more distinctly on a N-S than an E-W axis in eastern North America.9
Materials and Methods
Study sites and field collections
We collected egg rafts of Cx. pipiens s.l. by placing black polyethylene dishpans partially filled with a bacterial hay infusion overnight in sheltered outdoor locations near homes.17 We conducted this sampling monthly from July to September 2004 and 2005 whenever weather permitted. We chose collection sites (Figure 1) to represent a broad range of latitudes and longitudes across eastern North America, so that we could compare groups along the N-S and E-W axes. Along the N-S axis, collection sites in 2004 included those at Portland, ME (ME; 43.41° N, 70.18° W); Cambridge, MA (MA; 42.2° N, 71.05° W); Lehigh County, PA (PAL; 40.5° N, 75.42° W); Fairfax County, VA (FVA; 38.51° N, 77.19° W); Richmond, VA (RVA; 37.34° N, 77.27° W), Norfolk, VA (NVA; 36.54° N, 76.18° W), and Columbia, SC (SC; 34° N, 81° W). In 2005, we established collection sites at Montreal, Québec, Canada (QUE; 45.30° N, 73.27° W) in lieu of Portland, ME, and at the zone of introgression, i.e., Memphis, TN (MTN; 35.10° N, 90° W) and Nashville, TN (NTN; 36.10° N, 86.5° W). Along the E-W axis, collection sites in 2004 included Urbana-Champaign, IL (IL; 40.07° N, 88.14° W); Columbus, OH (OH; 39.59° N, 83.03° W); Central Pennsylvania in Harrisburg and York (PAC; 40.18° N, 76.49° W); and Lehigh, PA. In 2005, we retained all sites comprising the E-W axis except for the one in Ohio.
Figure 1.
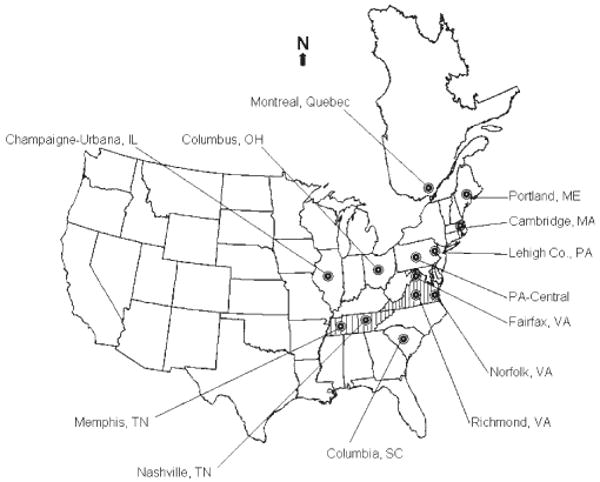
Collection sites from which samples of Cx. pipiens s.l. were collected in eastern North America. Striped areas show the hybrid zone (36–39°N latitude).
We isolated individual egg rafts from each collection in plastic petri dishes and allowed them to hatch. We examined first-instar larvae from each family of mosquitoes under a compound microscope to morphologically differentiate Cx. pipiens s.l. from Cx. restuans18 because they both share similar larval breeding habitats. We randomly selected 10 cohorts of first-instar Cx. pipiens s.l. larvae from each collection site per month, and we shipped them to Harvard School of Public Health Laboratory. We reared the larvae further until they emerged as adults (F0 generation) under standard insectary conditions (28–30°C). We froze male and female adult specimens at −20°C and processed them for microsatellite DNA analysis. We fed representative male siblings per family with 10% sugar solution for 2 days, and later we froze them at −20°C. We examined their copulatory structures for morphologic identification of the members of Cx. pipiens s.l.
Mosquito identification
The appearance of the egg breaker on the first-instar larvae serves to separate Cx. pipiens s.l. from morphologically similar mosquito species.17,18 We examined the copulatory structures of six siblings of 2-day-old adult male mosquitoes taken from each family under a compound microscope to determine their DV/D ratio.19,20 DV is the distance from the tip of the ventral arm of the phallosome to its intersection with the dorsal arm, and D is the distance between the tips of the dorsal arms of the phallosome, measured at their intersection with the ventral arms. We performed polymerase chain reaction (PCR) as per protocol21 to confirm microscopic identification of Cx. pipiens s.l.
Microsatellite DNA analysis
We processed two siblings of adult mosquitoes per family (F0 generation) each month from each collection site, thus we processed a total of 500 indi viduals of Cx. pipiens s.l. each year in 2004 and 2005 for microsatellite DNA analysis; however, we included 12 microsatellite genotypes of one sibling per family only from each population in all data analyses, except for temporal differentiation to resolve sample bias as explained below. We used the adult mosquito DNA extract of Cx. pipiens s.l. (1 μL ≃ 5 μg) as a template in the PCR reaction volume of 20 μL, which contained 2 μL of 10× PCR buffer, 0.25 μL of 10 mmol/L dNTP (premixed, 10 mmol/L each), 0.12 μL of labeled forward primer, 0.12 μL of unlabeled reverse primer, 0.1 μL of Taq DNA polymerase (5 U/μL), and 2 μL of 5× Taq enhancer (Eppendorf, Westbury, NY). We amplified microsatellite fragments for desired loci using 12 loci-specific primers. We used nine microsatellite loci that we developed15 and three loci (CxpGT4, CxpGT9, CxpGT46) from Keyghobadi and others.16 The procedure for amplifying these microsatellite loci has been described by Edillo and others.15
Statistical analyses
We measured population genetic diversity by the number of alleles and heterozygosities at each locus within populations using GENEPOP 3.4.22,23 We tested each locus separately for goodness-of-fit for Hardy-Weinberg equilibrium (HWE) using the probability test and inbreeding coefficient (FIS).22,24 We performed Fisher exact test in GENEPOP 3.4 to detect linkage disequilibrium for pairwise loci in each population. We examined the population structure by using the F-statistics, FST,25,26 calculated by using GENEPOP 3.4.23 For purposes of this study, FST is a better measure of genetic differentiation than RST, in which differentiation is primarily influenced by drift.25 We tested the significance of FST by using a log-likelihood (G) based exact test.27 We determined the temporal differentiation of FST between months in each of the breeding seasons and for each population by taking the average of FST estimates calculated from each of the five data sets randomly derived via a Monte Carlo bootstrapping method to resolve sample size bias. Each of the five data sets was composed of 10 adult mosquitoes for each month in a breeding season and for each population (i.e., N = 30 per data set with 12 microsatellite genotypes per individual) randomly and repeatedly derived via a Monte Carlo bootstrapping method from each array of siblings processed per family (F0 generation) by using custom software code written in J version 6.01 (J Software, Iverson Software Inc., Toronto, ON, Canada).
To determine the effects of the differences in latitude and longitude, controlling for year-to-year difference, on FST estimates between population pairs, we estimated the asymptotic variance-covariance matrix and the weighted least squares algorithm with the following model: √FST = β0 + β1 × Δ latitude + β2 × Δ longitude + β3 × year, in which Δ latitude is the N-S distance and Δ longitude is the E-W distance. We used the square root transformation of FST estimates to normalize them. The non-independence of both the FST estimates between population pairs, and the N-S and E-W distances required the use of this model instead of simple linear regression techniques (D. Graham, unpublished data).
We determined gene flow (Nm) from FST estimates to provide the corrected multilocus estimates of the effective number of migrants per population pairs.28 To determine the effects of the differences in latitude and longitude, controlling for year-to-year differences, on gene flow between population pairs, we used the same model: √Nm = β0 + β1 × Δ latitude + β2 × Δ longitude + β3 × year.
Results
Classification of mosquitoes
We identified the mosquitoes to subspecies based on the average DV/D ratio of six sibling males taken from every family that was subjected to microsatellite analysis. All sites north of the zone of introgression had Cx. p. pipiens, whereas south of the zone of introgression in SC had Cx. p. quinquefasciatus in both years. We found both Cx. p. pipiens and intermediates between Cx. pipiens and Cx. quinquefasciatus in sites within the zone of introgression, although we collected two intermediate specimens from IL, suggesting a slight expansion of the hybrid zone at this 40.07° latitude.
Genetic diversity and HWE
We measured population genetic diversity by the number of alleles and heterozygosity. The number of alleles per locus varied from 3 to 25 in 2004 (Supplemental Table 1, available online at www.ajtmh.org) and from 4 to 28 in 2005 (Supplemental Table 2, available online at www.ajtmh.org). The average observed heterozygosities for all loci within each of the populations were consistently high; in 2004, they ranged from 0.68 to 0.76, whereas those in 2005 ranged from 0.68 to 0.83.
Within each population, we calculated locus-specific departures from HWE in 2004 (Supplemental Table 1) and in 2005 (Supplemental Table 2), and we applied sequential Bonferroni procedure. In 2004, 33 of 108 tests (30.56%) for all populations (excluding the separate analysis at the zone of introgression) deviated from HWE, whereas in 2005, it was slightly lower, 29 of 108 tests (26.85%). All populations had relatively similar number of loci that departed from HWE from year-to-year, except those from SC and IL. One locus from SC population departed from HWE in 2004, and it increased to seven loci in 2005. Six loci from IL population were away from HWE in 2004, and it decreased to one locus in 2005.
Deviations from HWE generally are attributed to differential selection and non-random mating.29,30 We observed that the CxqCAG5 locus deviated from HWE across seven or eight populations (excluding the separate analysis in the zone of introgression) in 2004 and in 2005, respectively, and showed consistently large positive FIS (Supplemental Tables 1 and 2). Separate analysis of Cx. p. pipiens and the intermediates in the zone of introgression for both years resulted into a consistent deviation from HWE at CxqCAG5 locus, apparently indicating the presence of null alleles.
Linkage disequilibrium analysis
Alleles of different loci are not randomly associated if they occur together in individuals with a probability higher than would be expected by chance alone. There were 66 independent comparisons for each Cx. p. pipiens population, so we would expect one pair of loci (0.66%) to be significant at the 0.01 level by chance alone. After incorporating a sequential Bonferroni correction, mosquito samples from PAL and IL had all loci in linkage equilibrium in both years. One pair of loci showed linkage disequilibrium from each of the populations (P < 0.0001) in 2004 from ME (CxqGT2 and CxpGT9), MA (CxqATG9 and CxpGT9), PAC (CxqCA9 and CxqCA115), and FVA (CxqCA9 and CxqCA115), and in 2005 from QUE (CxqGT108 and CxpGT46), VA (CxqATG9 and CxpGT4 for pooled samples of Cx. p. pipiens and intermediates; CxqATG9 and CxqCA9 for Cx. p. pipiens samples only), and SC (CxqCTG10 and CxqCAG5) populations. These suggest that independent segregation of these loci in each population was within what should be expected by chance alone.
Effects of latitude and longitude
We found that differences in latitude (N-S distance) and longitude (E-W distance) were significant predictors for increases in the square root of FST estimates between Cx. p. pipiens populations at the 0.05 level. A 100-km increase in the latitudinal change resulted in an increase in the square root of FST by 0.002 (Figure 2A), and a 100-km increase in the longitudinal change resulted in an increase in the square root of FST by 0.035 (Figure 2B). We found greater genetic structuring between Cx. p. pipiens and Cx. p. quinquefasciatus populations in both years (Figure 2C). In 2004, the FST estimate between these populations at the N-S extremes of our samples was 0.108, greatly exceeding 0.012, which represented the E-W extremes (Table 1). Likewise in 2005, the FST estimate between these populations at the N-S extremes was 0.075, exceeding 0.05, which represented the E-W extremes (Table 1). We found a significant difference of FST estimates between different population pairs in 2004 and 2005 (P < 0.01; Figure 2D). In the hybrid zone, we found little genetic differentiation between those neighboring populations of Cx. pipiens from FVA and the intermediates from VA in both years (FST = 0.016 in 2004, FST = 0.019 in 2005; P < 0.01) and those intermediates from VA and TN (FST = 0.047; P < 0.01) in 2005 (Table 1). Genetic differentiation became moderate as geographic distance increased between those populations of Cx. pipiens from FVA and the intermediates from TN (FST = 0.061, P < 0.01) in 2005 (Table 1).
Figure 2.
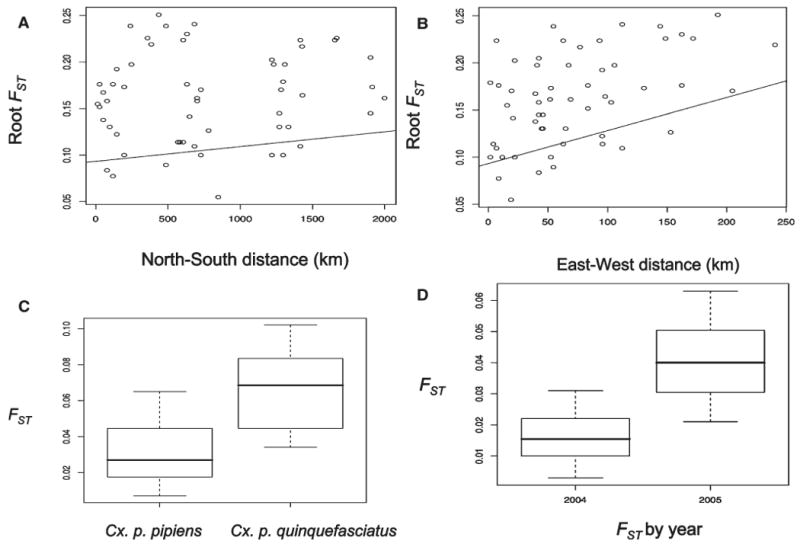
Effects of latitude and longitude on the square root of FST estimates of Cx. pipiens s.l. mosquito populations in eastern North America. A, Effects of latitudinal change (North-South distance). B, Effects of longitudinal change (East-West distance). C, FST estimates between Cx. pipiens population pairs and between Cx. p. pipiens and Cx. p. quinquefasciatus populations. D, FST estimates of Cx. pipiens s.l. populations by year.
Table 1.
Matrices of pairwise estimates of genetic divergence (FST) and gene flow (Nm) (enclosed in parentheses) of Cx. pipiens complex mosquito populations in Eastern North America in 2004 and 2005
| Sites | SC | TN (i*) | TN (p†) | VA (i*) | VA (p†) | TN (i* + p†) | VA (i* + p†) | FVA | OH | IL | PAC | PAL | MA |
|---|---|---|---|---|---|---|---|---|---|---|---|---|---|
| 2004 | |||||||||||||
| ME | 0.108‡ (1.37) | – | – | 0.033‡ (2.25) | 0.029‡ (2.39) | – | 0.026‡ (2.35) | 0.016‡ (3.16) | 0.027‡ (3.02) | 0.026‡ (3.31) | 0.025‡ (3.44) | 0.013‡ (2.84) | 0.017‡ (3.86) |
| MA | 0.084‡ (3.00) | – | – | 0.030‡ (3.51) | 0.031‡ (3.96) | – | 0.027‡ (3.33) | 0.012‡ (4.73) | 0.017‡ (4.78) | 0.021‡ (4.74) | 0.013‡ (4.48) | 0.008‡ (4.00) | |
| PAL | 0.083‡ (2.40) | – | – | 0.018‡ (3.78) | 0.015‡ (3.85) | – | 0.015‡ (3.68) | 0.010‡ (4.68) | 0.003§ (5.18) | 0.012‡ (4.26) | 0.006‡ (5.02) | ||
| PAC | 0.091‡ (2.37) | – | – | 0.023‡ (3.62) | 0.023‡ (3.73) | – | 0.020‡ (3.75) | 0.007§ (4.27) | 0.010§ (5.89) | 0.013‡ (4.58) | |||
| IL | 0.069‡ (3.53) | – | – | 0.014‡ (4.49) | 0.017‡ (4.48) | – | 0.012‡ (4.81) | 0.016‡ (4.28) | 0.013‡ (5.37) | ||||
| OH | 0.082‡ (3.37) | – | – | 0.028‡ (4.38) | 0.026‡ (4.63) | – | 0.024‡ (4.60) | 0.020‡ (4.50) | |||||
| FVA | 0.085‡ (3.25) | – | – | 0.016‡ (4.16) | 0.019‡ (4.26) | – | 0.016‡ (4.12) | ||||||
| VA (p + i) | 0.058‡ (3.75) | – | – | −0.008¶ (5.85) | −0.013¶ (7.62) | ||||||||
| VA (p) | 0.057‡ (2.91) | – | – | −0.003¶ (5.15) | |||||||||
| VA (i) | 0.059‡ (4.12) | ||||||||||||
| 2005 | |||||||||||||
| Que | 0.075‡ (2.03) | 0.049‡ (2.80) | 0.051‡ (3.05) | 0.063‡ (2.03) | 0.048‡ (2.78) | 0.051‡ (2.86) | 0.047‡ (3.15) | 0.063‡ (2.21) | – | 0.050‡ (2.85) | 0.051‡ (2.79) | 0.057‡ (3.06) | 0.039‡ (3.03) |
| MA | 0.062‡ (2.51) | 0.034‡ (2.68) | 0.030‡ (2.70) | 0.052‡ (1.88) | 0.053‡ (2.51) | 0.033‡ (2.97) | 0.047‡ (2.80) | 0.058‡ (2.22) | – | 0.042‡ (2.95) | 0.050‡ (3.00) | 0.057‡ (3.05) | |
| PAL | 0.038‡ (2.65) | 0.057‡ (3.17) | 0.047‡ (2.99) | 0.040‡ (2.82) | 0.037‡ (3.28) | 0.053‡ (3.17) | 0.035‡ (3.19) | 0.030‡ (3.66) | – | 0.050‡ (3.10) | 0.031‡ (3.74) | ||
| PAC | 0.043‡ (2.97) | 0.053‡ (3.02) | 0.039‡ (3.31) | 0.029‡ (3.06) | 0.031‡ (3.75) | 0.050‡ (3.13) | 0.027‡ (3.76) | 0.025‡ (3.56) | – | 0.032‡ (3.76) | |||
| IL | 0.033‡ (2.63) | 0.024‡ (4.17) | 0.024‡ (4.68) | 0.027‡ (2.55) | 0.021‡ (3.49) | 0.022‡ (5.44) | 0.022‡ (3.43) | 0.041‡ (2.96) | |||||
| FVA | 0.049‡ (2.39) | 0.061‡ (2.62) | 0.039‡ (2.53) | 0.019‡ (2.61) | 0.028‡ (3.10) | 0.051‡ (2.55) | 0.026‡ (3.22) | ||||||
| VA (p + i) | 0.025‡ (3.33) | 0.035‡ (3.68) | 0.026‡ (3.24) | 0.002¶ (5.18) | −0.012¶ (7.86) | 0.029‡ (3.58) | |||||||
| TN (p + i) | 0.038‡ (2.84) | −0.009¶ (6.63) | −0.003¶ (6.07) | 0.039‡ (2.58) | 0.032‡ (3.48) | ||||||||
| VA (p) | 0.028‡ (3.13) | 0.038‡ (3.77) | 0.029‡ (3.25) | 0.007¶ (4.26) | |||||||||
| VA (i) | 0.038‡ (2.58) | 0.047‡ (2.28) | 0.032‡ (2.47) | ||||||||||
| TN (p) | 0.039‡ (2.76) | 0.016‡ (3.76) | |||||||||||
| TN (i) | 0.041‡ (2.69) |
i = intermediate.
p = Cx. p. pipiens.
P < 0.001.
P < 0.01.
Nonsignificant.
Because the CxqCAG5 locus exhibited the highest heterozygote deficits, and null alleles were likely present that might have caused a biased estimate, we excluded this locus and reanalyzed FST estimates. Patterns of population differentiation did not differ when the CxqCAG5 locus was excluded from the re-analysis of FST estimates The mean of FST estimates in 2004 (Table 1) was 0.028, whereas the mean of the adjusted FST estimates was 0.027. Likewise, the mean FST estimate in 2005 (Table 1) was 0.037, whereas that of the re-analyzed FST estimates was 0.036.
Gene flow estimates (Nm)
We calculated the multilocus estimates of the effective number of migrants per generation between population pairs indirectly from FST estimates (Table 1). Estimates of gene flow were lower between Cx. p. quinquefasciatus and Cx. p. pipiens populations (mean ± SE: 2.78 ± 0.25 in 2004 and 2.63 ± 0.12 in 2005) than between population pairs of Cx. p. pipiens (mean ± SE: 4.20 ± 0.15 in 2004 and 3.12 ± 0.10 in 2005), indicating the existence of greater genetic structuring between sibling species.
Between Cx. p. pipiens population pairs, we found that the latitudinal and the longitudinal changes between collection sites remained significant predictors for gene flow at the 0.05 level. A 100-km increase in the N-S distance resulted in a decrease in the square root of Nm by 0.179, and a 100-km increase in the E-W distance resulted in a decrease in the square root of Nm by 0.007. The difference in gene flow across years remained significant (P < 0.01).
Temporal differentiation of FST estimates
We determined whether there was temporal differentiation of FST estimates between months of the breeding season. This was performed by taking the average of FST estimates calculated from each of the five data sets derived by Monte Carlo bootstrapping repeated sampling method taken from two siblings per family of 10 in each month for each population (Table 2). Six of the eight Cx. p. pipiens populations sampled in July 2004 were moderately different26 from those sampled in September 2004; this trend was not apparent in 2005. Cx. p. quinquefasciatus population in SC did not generally differ between months of each year's breeding season.
Table 2.
Mean FST estimates (< ±0.01) of Cx. pipiens s.l. sampled between months during the breeding season in 2004 and 2005 calculated from five monthly data sets derived by Monte Carlo bootstrapping repeated sampling method
| 2004 | 2005 | |||||
|---|---|---|---|---|---|---|
| Population | July vs. August | August vs. September | July vs. September | July vs. August | August vs. September | July vs. September |
| ME*/Que† | −0.015 | −0.012 | 0.031‡ | NA§ | 0.024‡ | NA§ |
| MA | 0.030‡ | 0.013‡ | 0.002‡ | 0.019‡ | 0.003‡ | 0.032‡ |
| PAL | 0.024‡ | 0.039‡ | 0.080¶ | 0.013‡ | 0.029‡ | 0.029‡ |
| PAC | −0.004 | 0.103¶ | 0.103¶ | 0.010‡ | 0.028‡ | 0.025‡ |
| FVA | 0.021‡ | 0.018‡ | 0.087¶ | 0.035‡ | 0.037‡ | 0.012‡ |
| VA(p)‖ | 0.025‡ | 0.007‡ | 0.059¶ | 0.034‡ | 0.017‡ | 0.029‡ |
| VA(i)** | 0.029‡ | 0.019‡ | 0.053¶ | NA§ | 0.029‡ | NA§ |
| TN(p)‖ | −‡‡ | −‡‡ | −‡‡ | NA§ | NA§ | 0.063¶ |
| TN(i)** | −‡‡ | −‡‡ | −‡‡ | NA§ | 0.003‡ | NA§ |
| SC | −0.002 | 0.014‡ | 0.019‡ | 0.062¶ | 0.092¶ | 0.113¶ |
| IL | 0.071¶ | 0.009‡ | 0.069¶ | NA§ | 0.035‡ | NA§ |
| OH | 0.034‡ | 0.134¶ | 0.147¶ | – | – | – |
2004.
2005.
Little genetic differentiation.
NA = not applicable.
Moderate genetic differentiation.
p = Cx. p. pipiens.
i = intermediate.
No samples.
Discussion
In this study, we found that when Cx. p. quinquefasciatus population from SC was included in the pairwise comparisons with Cx. p. pipiens populations from each of the collection sites, as expected a much greater distinction of FST estimates was observed between latitudinal pairs rather than longitudinal pairs in both 2004 and 2005. The greater gradient observed in FST estimates may result from introgression northward from the hybrid zone and into the mid-Atlantic and New England regions. Flight of Cx. p. quinquefasciatus was documented as far as 12.6 km.31 Dispersal of Cx. p. quinquefasciatus at distances greater than their average flight may be associated with human activity, such as long distance transport by commercial trucks.32,33 Concordant with our FST analyses, estimates of gene flow between these mosquito populations also showed the existence of greater genetic structuring. Barriers to gene flow exist between Cx. p. pipiens and Cx. p. quinquefasciatus because of their distinct latitudinal distribution.3 The inability of Cx. p. quinquefasciatus to hibernate seems to limit their northward expansion into the latitudinal range of Cx. p. pipiens where winters are severe.34
The hypothesis that these Cx. p. pipiens populations may be structured more distinctly on a N-S than an E-W axis in eastern North America was not shown. If latitudinal selection for diel response was solely responsible for these differences, we would have expected distinct population structure between Cx. p. pipiens populations at varying latitudinal distributions. Our results apparently indicated that with the very minimal effect of latitudinal selection for diel response, one would expect northern populations of these mosquito vectors to have fewer restraints on their population growth because the environmental cue (14.25 hours of daylight) would be reached later in the breeding season at higher latitudes, allowing additional generations of host-seeking mosquitoes to be generated before fourth-instar larvae and pupae are triggered to enter an overwintering diapause in which they do not seek hosts, and a metabolic switch from blood feeding to sugar gluttony follows.35 The lack of a clear trend of latitudinal genetic structuring among Cx. p. pipiens populations lends support toward a uniform signal among North American Cx. p. pipiens mosquitoes, although we cannot assume that the 12 microsatellite markers used reflect the overall genome. Such an effect would increase risk of WNV transmission towards northern areas because of the longer breeding season, an extended period for host seeking, and the larger size of the maximum population of mosquitoes that would result from this combination of factors.
The latitudinal and the longitudinal changes between collection sites remained significant predictors for gene flow among Cx. p. pipiens mosquitoes. Barriers to gene flow in Cx. p. pipiens populations may include both by geographical distance and topography, especially in species with low vagility. Mountainous terrain (e.g., Appalachian Mountains, Notre Dame Mountains) and river (e.g., St. Lawrence River in Québec) are particularly important barriers; however, dispersal may occur in mosquitoes during wind storms or through transportation by humans.32,33
Six of the eight Cx. p. pipiens populations sampled in the early and later period of the breeding season in 2004 showed moderate temporal differentiation of FST, which may be associated with their ability to hibernate, but not in 2005 when temperature was warmer. Cx. p. quinquefasciatus population sampled in SC between months of each breeding season did not differ, which might be apparently consistent with its inability to hibernate. It may be that Cx. p. pipiens that were highly fit to hibernate (i.e., ability to respond to critical diel and temperature) were selected for and might have introduced a differential factor in the later part of the breeding season in 2004.
Temperature records taken from the nearest weather stations of the collection sites showed that the mean (±SE) monthly temperature during our mosquito collections from July to September 2004 along the E-W transects was 21.41 ± 0.25°C, whereas along the N-S axis it was 23.05 ± 0.95°C. Mean (±SE) monthly temperature from July until September 2005 was higher than that in 2004; along the E-W sites, it was 23.52 ± 0.23°C, whereas along the N-S axis, it was 25 ± 0.99°C. Most likely, warmer temperatures may have influenced the genetic similarity of Cx. p. pipiens populations sampled between months of the breeding season in 2005. Previous reports 6,36 showed that Cx. p. pipiens in the laboratory after feeding at short photoperiod (12 hours) and warmer temperatures (25°C) were able to terminate diapause, whereas cold temperatures (15°C) increased the incidence of diapause. Moreover, warmer temperature also limits the number of larval development sites that may act as important barrier to dispersal of these mosquitoes. The varying amount of shading caused by vegetation cover and tree canopy in our collection sites may have also influenced the exposure of mosquitoes to latitudinal day length.
In conclusion, Cx. p. pipiens and Cx. p. quinquefasciatus populations have strong population structure; however, Cx. p. pipiens populations are not structured more distinctly on a N-S than an E-W axis in the eastern North America, although latitudinal and longitudinal changes between their collection sites are significant predictors for gene flow. A lack of latitudinal effect on the structure between Cx. p. pipiens populations suggests a uniform signal considering the 12 microsatellite markers used. A latitude change may have exerted a stronger effect on the length of the breeding season. Thus, northern Cx. p. pipiens may have undergone additional generations before diapause is triggered, magnifying population size when WNV amplification is peaking, which may increase the risk of WNV transmission towards northern areas in eastern North America.
Supplementary Material
Acknowledgments
The authors thank N. Grefe, S. Hutter, M. Holman, R. Robich, M. Tabibi, N. Whitehurst, and M. Reddy for their help in obtaining and/or rearing mosquito samples.
Financial support: This research was supported by Grant RO1A1 52284 from the National Institute of Allergy and Infectious Diseases and funds provided by the Centers for Disease Control and Prevention under Grant RO1 A1 44064 from the National Institutes of Health to the late A.S. Statistical analyses of latitude and longitude were supported by Grant T32 AI007535 from the National Institute of Allergy and Infectious Disease to J.M. and Grant RO1 EB 006195 from the National Institute of Biomedical Imaging and Bioengineering to M.P. This work is dedicated in memory of Andrew Spielman, a famous scientist and professor who died after completing the molecular work by F.E.E.
Footnotes
Note: Supplemental tables can be found online at www.ajtmh.org.
Contributor Information
Frances Edillo, Harvard School of Public Health, Department of Immunology and Infectious Diseases, Boston, MA 02115.
Anthony Kiszewski, Harvard School of Public Health, Department of Immunology and Infectious Diseases, Boston, MA 02115.
Justin Manjourides, Harvard School of Public Health, Department of Biostatistics, Boston, MA 02115.
Marcello Pagano, Harvard School of Public Health, Department of Biostatistics, Boston, MA 02115.
Michael Hutchinson, Department of Environmental Protection, Harrisburg, PA 17105.
Andrew Kyle, Department of Environmental Protection, Harrisburg, PA 17105.
Jorge Arias, Fairfax Department of Health, Fairfax, VA 22030.
David Gaines, Virginia Department of Health, Office of Epidemiology, Richmond, VA 23218.
Richard Lampman, Illinois Natural History Survey, Division for Biodiversity and Ecological Entomology, Champaign, IL 61820.
Robert Novak, Division of Infectious Diseases, University of Alabama at Birmingham School of Medicine, Birmingham, AL 35294.
Ivo Foppa, Department of Epidemiology, Tulane School of Public Health and Tropical Medicine, New Orleans, LA 70112.
Charles Lubelcyzk, Maine Medical Center Research Institute, Vector-borne Disease Laboratory, South Portland, ME 04106.
Robert Smith, Maine Medical Center Research Institute, Vector-borne Disease Laboratory, South Portland, ME 04106.
Abelardo Moncayo, Tennessee Department of Health Communicable and Environmental Disease Services, Vector-borne Disease Section, Nashville, TN 37216.
References
- 1.Barr AR. The distribution of Culex p. pipiens and C. p. quinquefasciatus in North America. Am J Trop Med Hyg. 1957;6:153–165. doi: 10.4269/ajtmh.1957.6.153. [DOI] [PubMed] [Google Scholar]
- 2.Mattingly PF, Rozeboom LE, Knight KE, Laven H, Drummond FH, Christophers SR, Shute PG. The Culex pipiens complex. Trans R Entomol Soc. 1951;7:331–343. [Google Scholar]
- 3.Spielman A. Structure and seasonality of Neartic Culex pipiens populations. Proc NY Acad Sci. 2001;951:220–234. doi: 10.1111/j.1749-6632.2001.tb02699.x. [DOI] [PubMed] [Google Scholar]
- 4.Spielman A, Wong J. Studies on autogeny in natural populations of Culex pipiens. III. Midsummer preparation for hibernation in anautogenous populations. J Med Entomol. 1973;10:319–324. doi: 10.1093/jmedent/10.4.319. [DOI] [PubMed] [Google Scholar]
- 5.Eldridge BF. Environmental control of ovarian development in mosquitoes of the Culex pipiens complex. Science. 1966;151:826–828. doi: 10.1126/science.151.3712.826. [DOI] [PubMed] [Google Scholar]
- 6.US Naval Observatory. Tables of Sunrise, Sunset, and Twilight. American Ephemeris (Suppl) Washington, DC: US Gov. Printing Office; 1946. [Google Scholar]
- 7.Fonseca DM, Lapointe DA, Fleischer RC. Bottlenecks and multiple introductions: population genetics of the vector of avian malaria in Hawaii. Mol Ecol. 2000;9:1803–1814. doi: 10.1046/j.1365-294x.2000.01070.x. [DOI] [PubMed] [Google Scholar]
- 8.Fonseca DM, Keyghobadi N, Malcolm CA, Mehmet C, Schaffner F, Mogi M, Fleischer RC, Wilkerson RC. Emerging vectors in the Culex pipiens complex. Science. 2004;303:1535–1538. doi: 10.1126/science.1094247. [DOI] [PubMed] [Google Scholar]
- 9.Fonseca DM, Smith JL, Wilkerson RC, Fleischer RC. Pathways of expansion and multiple introductions illustrated by large genetic differentiation among worldwide populations of the Southern house mosquito. Am J Trop Med Hyg. 2006;74:284–289. [PubMed] [Google Scholar]
- 10.Cornel AJ, McAbee RD, Rasgon J, Stanich MA, Scott TW, Coetzee M. Difference in extent of genetic introgression between Culex pipiens and Culex quinquefasciatus (Diptera: Culicidae) in California and South Africa. J Med Entomol. 2003;40:36–51. doi: 10.1603/0022-2585-40.1.36. [DOI] [PubMed] [Google Scholar]
- 11.Nayar JK, Knight JW, Munstermann LE. Temporal and geographic genetic variation in Culex pipiens quinquefasciatus (Diptera: Culicidae) from Florida. J Med Entomol. 2003;40:882–889. doi: 10.1603/0022-2585-40.6.882. [DOI] [PubMed] [Google Scholar]
- 12.Urbanelli S, Silvestrini F, Reisen WK, De Vito E, Bullini L. Californian hybrid zone between Culex pipiens pipiens and Culex pipiens quinquefasciatus revisited (Diptera:Culicidae) J Med Entomol. 1997;34:116–127. doi: 10.1093/jmedent/34.2.116. [DOI] [PubMed] [Google Scholar]
- 13.Pryor SC, Daly J. Temporal variation in morphological and genetic characteristics within a hybrid population of Culex pipiens (Diptera: Culicidae) J Med Entomol. 1991;28:481–486. doi: 10.1093/jmedent/28.4.481. [DOI] [PubMed] [Google Scholar]
- 14.Tabachnik WJ, Powell JR. Genetic analysis of Culex pipiens populations in the Central Valley of California. Ann Entomol Soc Am. 1983;76:715–720. [Google Scholar]
- 15.Edillo FE, Tripét F, McAbee RD, Foppa IM, Lanzaro GC, Cornel AJ, Spielman A. A set of broadly applicable microsatellite markers for analyzing the structure of Culex pipiens (Diptera: Culicidae) populations. J Med Entomol. 2003;44:145–149. doi: 10.1603/0022-2585(2007)44[145:asobam]2.0.co;2. [DOI] [PubMed] [Google Scholar]
- 16.Keyghobadi N, Matrone M, Ebel GD, Kramer LD, Fonseca DM. Microsatellite loci from the northern house mosquito (Culex pipiens), a principal vector of West Nile virus in North America. Mol Ecol Notes. 2004;4:20–22. [Google Scholar]
- 17.Reiter P. A standardized procedure for the quantitative surveillance of certain Culex mosquitoes by egg raft collection. J Am Mosq Control Assoc. 1986;2:219–221. [PubMed] [Google Scholar]
- 18.Dodge HR. Studies on mosquito larvae II. The first instar larvae of North American Culicidae and of world Anophelinae. Can Entomol. 1966;98:337–393. [Google Scholar]
- 19.Sundararaman S. Biometrical studies on intergradation in the genitalia in certain populations of Culex pipiens and Culex quinquefasciatus in the United States. Am J Hyg. 1949;50:307–314. doi: 10.1093/oxfordjournals.aje.a119363. [DOI] [PubMed] [Google Scholar]
- 20.Spielman A. The functional anatomy of the copulatory apparatus of male Culex pipiens (Diptera: Culicidae) Ann Entomol Soc Am. 1966;59:309–314. doi: 10.1093/aesa/59.2.309. [DOI] [PubMed] [Google Scholar]
- 21.Crabtree MB, Savage HM, Miller BR. Development of species-diagnostic polymerase chain reaction assay for the identification of Culex vectors of St. Louis encephalitis virus based on interspecies sequence variation in ribosomal DNA spacers. Am J Trop Med Hyg. 1995;53:105–109. [PubMed] [Google Scholar]
- 22.Raymond M, Rousset F. GENEPOP: population genetics software for exact tests and ecumenism. J Hered. 1995;86:248–249. [Google Scholar]
- 23.Weir BS, Cockerham CC. Estimating F-statistics for the analysis of population structure. Evolution. 1984;38:1358–1370. doi: 10.1111/j.1558-5646.1984.tb05657.x. [DOI] [PubMed] [Google Scholar]
- 24.Weir BS. Genetic Data Analysis: Methods for Discrete Population Genetic Data. Sunderland, MA: Sinauer Associates; 1990. [DOI] [PubMed] [Google Scholar]
- 25.Slatkin M. A measure of population subdivision based on microsatellite allele frequencies. Genetics. 1995;139:457–462. doi: 10.1093/genetics/139.1.457. [DOI] [PMC free article] [PubMed] [Google Scholar]
- 26.Wright S. Evolution and the Genetics of Populations, Vol 4 Variability Within and Among Natural Populations. Chicago: University of Chicago Press; 1978. [Google Scholar]
- 27.Goudet J, Raymond M, De Mee s T, Rousset F. Testing differentiation in diploid populations. Genetics. 1996;144:1933–1940. doi: 10.1093/genetics/144.4.1933. [DOI] [PMC free article] [PubMed] [Google Scholar]
- 28.Barton NH, Slatkin M. A quasi-equilibrium theory of the distribution of rare alleles in a subdivided population. J Hered. 1986;56:409–415. doi: 10.1038/hdy.1986.63. [DOI] [PubMed] [Google Scholar]
- 29.Lehmann T, Licht M, Elissa N, Maega BT, Chimumbwa JM, Watsenga FT, Wondji CS, Simard F, Hawley WA. Population structure of Anopheles gambiae in Africa. J Hered. 2003;94:133–147. doi: 10.1093/jhered/esg024. [DOI] [PubMed] [Google Scholar]
- 30.Lanzaro GC, Touré YT, Carnahan J, Zheng G, Dolo G, Traore S, Petrarca V, Vernick KD, Taylor CE. Complexities in the genetic structure of Anopheles gambiae populations in west Africa as revealed by microsatellite. Proc Natl Acad Sci USA. 1998;95:14260–14265. doi: 10.1073/pnas.95.24.14260. [DOI] [PMC free article] [PubMed] [Google Scholar]
- 31.Reisen WK, Milky MM, Meyer RP. Population dynamics of adult Culex mosquitoes (Diptera: Culicidae) along the Kern River, Kern County, California, in 1990. J Med Entomol. 1992;29:531–543. doi: 10.1093/jmedent/29.3.531. [DOI] [PubMed] [Google Scholar]
- 32.Failloux AB, Raymond M, Ung A, Chevillon C, Pasteur N. Genetic differentiation associated with commercial traffic in the Polynesian mosquito, Aedes polynesiensis Marks 1951. Biol J Linnean Soc. 1997;60:107–118. [Google Scholar]
- 33.Julvez J, Mouchet J, Ragavoodoo C. Epidémiologie historique du paludisme dans l'archipel des Mascareignes (Océan Indien) Ann Soc Belg Med Trop. 1990;70:249–261. [PubMed] [Google Scholar]
- 34.Meola R, Readio J. Juvenile hormone regulation of the second biting cycle in Culex pipiens. J Insect Physiol. 1987;33:751–754. [Google Scholar]
- 35.Robich RM, Denlinger DL. Diapause in the mosquito Culex pipiens evokes a metabolic switch from blood feeding to sugar gluttony. Proc Natl Acad Sci USA. 2005;102:15912–15917. doi: 10.1073/pnas.0507958102. [DOI] [PMC free article] [PubMed] [Google Scholar]
- 36.Madder DJ, Surgeoner GA, Helson BV. Induction of diapause in Culex pipiens and Culex restuans (Diptera: Culicidae) in Southern Ontario. Can Entomol. 1983;115:877–883. doi: 10.1093/jmedent/20.3.275. [DOI] [PubMed] [Google Scholar]
Associated Data
This section collects any data citations, data availability statements, or supplementary materials included in this article.