

Abstract
Only a small fraction of spectra acquired in LC-MS/MS runs matches peptides from target proteins upon database searches. The remaining, operationally termed background, spectra originate from a variety of poorly controlled sources and affect the throughput and confidence of database searches. Here, we report an algorithm and its software implementation that rapidly removes background spectra, regardless of their precise origin. The method estimates the dissimilarity distance between screened MS/MS spectra and unannotated spectra from a partially redundant background library compiled from several control and blank runs. Filtering MS/MS queries enhanced the protein identification capacity when searches lacked spectrum to sequence matching specificity. In sequence-similarity searches it reduced by, on average, 30-fold the number of orphan hits, which were not explicitly related to background protein contaminants and required manual validation. Removing high quality background MS/MS spectra, while preserving in the data set the genuine spectra from target proteins, decreased the false positive rate of stringent database searches and improved the identification of low-abundance proteins.
Keywords: proteomics, LC-MS/MS, sequence similarity searches, background spectra filtering, de novo sequencing, MS BLAST
Introduction
Typical LC-MS/MS experiment, a cornerstone of many proteomic efforts of today (reviewed in refs 1–3), produces several thousands tandem mass spectra. Yet, only 5–50% of them match peptides from database entries and even smaller fraction of those actually hit target proteins,4–6 even if a majority of spectra are of good quality and rich in fragment ions.7 The unmatched spectra fall into three major groups: first, they might represent peptides originating from target protein(s), which the search engine, for some reason, failed to match. This typically includes spectra of peptide precursors with polymorphic sequences that are common in organisms having diverse genetic backgrounds;8,9 peptides with post-translational modifications; peptide products of unspecific protease cleavage;10,11 products of orifice fragmentation of abundant peptide precursors,4,6 among others. Depending on their quality, these spectra could be matched to target protein(s) by error-tolerant searches.12–18
Second, a large, diverse, and poorly defined group of spectra is often termed as peptide background. They originate from ubiquitous human and sheep keratin contaminants; from autolysis products of proteolytic enzymes, such as trypsin,19 which are especially abundant in in-gel protein digests;20,21 from preparation-specific protein contaminants,22,23 such as proteins from the cell media or expression host organism, antibodies, GST, TEV and PreScission proteases, among others. Many of these sequences are either not present in a database or scattered through a large number of partially redundant database entries. When abundant, they also give rise to a large pool of polymorphic sequences, orifice fragmentation products, sodium adducts, and so forth, as described above. Because of the organismal diversity of background proteins and redundancy of corresponding database entries, both stringent and error-tolerant database searches identify corresponding peptide precursors with very limited efficiency.
A separate subgroup of background MS/MS peptide spectra is often encountered in shotgun functional proteomics.24 Stable protein constellations (such as, for example, protein complexes or organelles) are often coisolated together with a variety of proteins that, despite weak nonspecific binding to the bait or genuine interactors, are found in considerable quantities since they are highly expressed. Therefore, target bona fide protein interactors often represent a small fraction of the total protein content. The composition of coisolated background proteins is strongly experiment-dependent and they are better recognized by correlating their relative abundances,25,26 rather than by direct comparison against some generic control.
Tandem mass spectra acquired from precursors of nonpeptide origin (detergents, plasticizers, etc.)27 represent the third major group of unmatched spectra. They are mostly detected as singly charged ions and, assuming the employed mass spectrometer offers adequate mass resolution, are readily recognized in survey scans and, if required, excluded from subsequent MS/MS experiments. However, they are often co-selected with genuine multiply charged peptide precursors and might contaminate MS/MS spectra, since, for better sensitivity, the width of the isolation window is maintained within the m/z range of 2–4 Da.28–30
Background spectra represent a significant bottleneck in protein identification. Large size of search queries requires substantial computational resources and processing time. Because of diverse origin of protein background, searches should be performed against a comprehensive, rather than a species-restricted, database. Since the expected number of random hits increases with increasing the size of both the query and database, higher threshold scores are usually imposed, and the rate of false negative identifications also increases.
Overpopulating MS/MS queries with background spectra most severely affects sequence-similarity searches that are commonly used for the identification of protein from organisms with unsequenced genomes.31–33 Homology-driven proteomics relies on relatively weak similarities between redundant, degenerate, and largely inaccurate peptide sequence candidates, obtained by automated interpretation of tandem mass spectra, and protein sequences from often phylogenetically distant species available in a database.31,34 Larger organismal scope and the ability to identify unknown (i.e., not available in a database) proteins come at the price of reduced search specificity, and therefore, background peptides much stronger affect the confidence of produced hits, compared to conventional stringent database searches. In particular, human and sheep keratins (ubiquitous contaminants in almost any protein preparation) are rich in low complexity sequence stretches, and therefore, it is not surprising that sequence-similarity searches retrieve many high scoring protein hits that are, at the first glance, unrelated to keratins. Sorting them out requires manual inspection of each produced alignment followed by BLAST searches with full-length sequences of cross-species protein hits and thorough consideration of their domain compositions, which is hardly possible under high-throughput settings.
Therefore, it would be advantageous to remove background spectra prior to database searches. However, since the abundance of background precursors varies very strongly, the corresponding MS/MS spectra are poorly reproducible and often contaminated by chemical noise and fragments of accidentally coselected precursors.35 Furthermore, MS/MS spectra of precursors of nonpeptide origin contain only a few representative peaks and are difficult to recognize by applying some generic fragmentation rules.
To address this problem, computational methods have been developed to recognize background spectra by comparison with a reference library or with spectra from a blank LC-MS/MS run.35,36 Gentzel et al. found matching the intensity profiles of fragment ions counterproductive,35 although this approach has been employed in many mass spectral library search algorithms37–41 and, instead, chose to match solely m/z patterns. Yates et al. used cross-correlation of Fourier transforms to match both m/z and intensities of peaks.36 Although these are robust solutions, they are computationally intense and do not provide a statistically transparent cross-platform framework since they derive empirical similarity thresholds directly from acquired data.
Here, we report an algorithm and its software implementation for rapid screening of large MS/MS queries, which recognizes and, subsequently, removes unannotated background spectra regardless of their precise origin. We demonstrated that unbiased, sequence database-independent filtering decreases the rate of background-related false positive hits, improves the identification confidence of minor protein components, and, hence, stands out as the essential element of any proteomics data mining pipeline.
Materials and Methods
Chemicals
Cleland’s reagent (dithiothreitol, DTT) was obtained from Merck (Darmstadt, Germany) and other chemicals from Sigma-Aldrich (Munich, Germany). Porcine trypsin (sequencing grade modified trypsin, cat. number V5111) was purchased from Promega (Mannheim, Germany); LC solvents were from Fisher Scientific (Schwerte, Germany); formic and trifluoroacetic acids were from Merck (Darmstadt, Germany).
Protein samples
from the bug Triatoma infestans and Brazilian pine Araucaria angustifolia were obtained from ongoing collaboration projects with the Laboratory of Biochemistry and Protein Chemistry, University of Brasilia, and Plant Cell Biology Laboratory, University of São Paulo. Spots were visualized by Coomassie Brilliant Blue R250 or (where specified) silver staining, excised from two-dimensional polyacrylamide gels and in-gel digested with trypsin as described.20,21 Recovered tryptic peptides were dried down in a vacuum centrifuge and stored at −20 °C until analyzed.
Human protein complexes were isolated from HeLa cells by immunoaffinity chromatography basically as described by Gregan et al.42 Briefly, proteins eluted from affinity beads with 50– 200 µL of the buffer containing 100 mM glycine in 100 mM Tris, pH 8.0, were digested in-solution with trypsin at the enzyme concentration of 16 ng/µL at 39 °C overnight and tryptic peptides concentrated off-line on a UltraMicroSpin-C18 (The Nest Group, Southborough MA) cartridge.43
Analysis by LC-MS/MS
was performed on the Ultimate 3000 nanoLC system (Dionex, Amsterdam, The Netherlands), which was interfaced to a LTQ Orbitrap hybrid mass spectrometer (Thermo Fisher Scientific, Bremen, Germany) via a robotic nanoflow ion source TriVersa (Advion BioSciences Ltd., Ithaca, NY) equipped with a LC coupler and a chip with the diameter of electrospray nozzles of 4.1 µm. The TriVersa source was controlled by Chipsoft 6.4. software (Advion Biosciences) and operated at the ionization voltage of 1.7 kV and the capillary transfer temperature was set at 180 °C.
Tryptic peptides were taken up in 10 µL of 0.05% TFA and 4 µL was loaded onto 5 mm × 300 µm i.d. trapping column packed with C18 PepMAP100 5 µm particles (Dionex) in 0.05% TFA at the flow rate of 20 µL/min. After a 5 min wash, peptides were eluted into 15 cm × 75 µm i.d. nanocolumn packed with C18 PepMAP100 3 µm particles (Dionex) at the flow rate of 200 nL/min and separated using the following mobile phase gradient: from 5 to 20% of solvent B in 20 min, 20–50% B in 16 min, 50–100% B in 5 min, 100% B during 10 min, and back to 5% B in 10 min. Solvent A was 95:5 H2O/acetonitrile (ACN) (v/v) containing 0.1% formic acid; solvent B was 20:80 H2O/ ACN (v/v) containing 0.1% formic acid.
Protein mixtures isolated by immunoaffinity chromatography were digested in-solution and analyzed as described above; however, the elution gradient was from 5 to 20% of solvent B in 73 min, 20–50% B in 71 min, 50–100% B in 5 min, 100% B during 10 min, and back to 5% B in 10 min.
LC-MS/MS analysis was performed in data-dependent acquisition (DDA) mode controlled by Xcalibur 2.0 software (Thermo Fisher Scientific). The automated gain control (AGC) was set to 5E05 charges for MS scan on the Orbitrap and 5E04 charges for MS/MS on the ion trap analyzers. Typical DDA cycle consisted of a survey scan within m/z 300–1600 performed at the Orbitrap analyzer under the target mass resolution of 60 000 (full width at half-maximum) followed by MS/MS fragmentation of the four most abundant precursor ions under the normalized collision energy of 35% in the linear trap. Survey spectra were acquired in one microscan and MS/MS spectra in three microscans with maximal ion injection time of 100 ms. Ion selection threshold for triggering MS/MS experiments was set to 500 counts with the precursor ions isolation width of 4 amu. Activation parameter q = 0.25 and activation time of 30 ms were applied. Singly charged ions were excluded from MS/ MS experiments, and m/z of fragmented precursor ions were dynamically excluded for further 90 s; otherwise, no precompiled exclusion lists were applied. Spectra were exported as.dta files using BioWorks 3.1 software (Thermo Fisher Scientific) under the following settings: peptide mass range, 500–3500 Da; minimum total ion intensity threshold, 500; minimum number of fragment ions, 5; minimum signal-to-noise ratio, 3; charge state recognition enabled. Each.dta file was named according to the original name of the.raw file, the scan number and the assumed charge of the precursor ion. Different.dta files could be related to the same peptide if during LC-MS/MS experiment either the same precursor ion was fragmented several times, or detected in different charge states. All.dta files from each LC-MS/MS run were merged into a single.mgf (MASCOT generic format) file by a dedicated script.
Protein Identification by Stringent Database Searches
Where specified, LC-MS/MS runs were searched against the MSDB database (2 344 227 sequence entries; updated April, 2006) by MASCOT v. 2.1 software (Matrix Science Ltd., London, U.K.) installed on a local 2 CPU server. Tolerances for precursor and fragment masses were set at 10 ppm and 0.6 Da, respectively; up to 2 missed cleavages were allowed; instrument profile, ESI-Trap; fixed modification, carbamidomethyl (cysteine); oxidation (methionine) and acetylation of the N-terminal peptide of protein sequence entry were set as variable modifications.
MASCOT identifications were considered confident if hits were produced by matching of at least three MS/MS spectra each with peptide ions score above 20. For hits matched by one or two spectra, it was required that at least one spectrum should be matched with the score of 50 or above.
De novo Peptide Sequencing and Protein Identification by MS BLAST Searches
were performed as described.32 All MS/MS spectra obtained in each LC-MS/MS experiment were interpreted de novo by a modified version of PepNovo software44 termed PepNovo2MSB (available for free download at http://peptide.ucsd.edu). The software was set to produce up to 7 redundant, degenerate, and partially complete and accurate sequence candidates per each interpreted MS/MS spectrum. For each spectrum, PepNovo reported the expected confidence of produced sequence candidates by assigning a quality score, which corresponded to the expected number of correctly called amino acid residues in the top sequence proposal. Unless specified otherwise, in de novo sequencing experiments we only considered sequence candidates having the score of 6.0 or above. All selected peptide sequence candidates obtained by PepNovo sequencing of all peptide precursors were merged into a single MS BLAST query string.12,34 MS BLAST searches were performed against nr database at the Web-accessible server at http://genetics.bwh.harvard.edu/msblast/ maintained by Sunyaev’s laboratory. Statistical significance of hits was evaluated according to MS BLAST scoring scheme,34 which, however, only considered high scoring segment pairs (HSPs) with the BLAST scores of 55 or above, as was specified via LC-MS/MS presets option.32 Other MS BLAST settings were explained in details in ref.45
EagleEye Spectra Filtering Software: Data Processing Settings and Web-Based User Interface
The filtering software here termed EagleEye was programmed in C++ language, runs at the Linux cluster and is accessible at http://genetics.bwh.harvard.edu/cgi-bin/msfilter/eagleeye.cgi. A stand-alone version of EagleEye is available from the authors upon request.
Basically, EagleEye screens the query of individual MS/MS spectra packed as a single.mgf (MASCOT generic format) file, which is used in MASCOT searches of LC-MS/MS data sets, against a background library. The library typically comprises spectra combined from multiple control and blank runs. Acquiring experiment and blank (control) LC-MS/MS runs at the same or similar instrument under the same settings increases chances of accurate matching of fragment peak patterns in individual spectra. EagleEye allows users to select either one of several default background spectra libraries maintained at the server, or upload any user-compiled library (as.mgf file) along with the query. Each spectrum within.mgf file is separately screened against the same background library under the same set of user-definable filtering parameters. User-definable parameters for EagleEye filtering are submitted with the same input form and include the tolerance for precursor and fragment masses, as well as the estimate of the fraction of good-quality query spectra that could be lost because of random matching (p-value cutoff).
Optionally, EagleEye could produce a low redundancy background library from highly redundant data sets obtained by combining spectra from several independent LC-MS/MS runs. This library, in compressed format, is downloadable via a Web link and can be further used for spectra filtering as a user-supplied background library.
EagleEye Web server supports batch mode operation: the batch query could contain several.mgf files (each representing complete LC-MS/MS run), which are processed as individual jobs under the same filtering settings. To improve upload times, both query and library files should be submitted in a compressed format. Upon submission, the user’s browser receives a cookie with the unique session identifier, which can be used to access EagleEye server anytime later from the same or different networked computer and track filtering progress, manage individual queries, or view and collect results. Once the submitted batch is processed, the server provides a link for downloading a compressed archive, in which for each submitted.mgf file a separate directory is created. Each directory contains two.mgf files with retained (nonbackground) and background spectra, as well as two text files in tab-separated format with processing settings and a list of matched spectra and scores. Filtered.mgf files extracted from the archive can be directly submitted to MASCOT search or de novo interpretation. Screening a data set of ca. 2000 MS/MS spectra against a library of ca. 270 000 background spectra typically takes less than 10 min.
Library of Background MS/MS Spectra
A library of background tandem spectra was composed by processing a partially redundant collection of.dta files obtained in LC-MS/MS runs of 5 independent in-gel tryptic digests of blank gel pieces. Digests were analyzed on a new precolumn and analytical column to reduce the column memory. Each run was separately checked by MASCOT that only identified peptides from trypsin and human and (or) sheep keratins. Additionally, we added 1750 trypsin and keratin spectra identified by MASCOT (with peptide ion scores above 50) or MS BLAST searches (High Scoring Segment Pair (HSP) score above 55) in separate analysis. To lower the library redundancy, each of these spectra was screened against the existing library and added only if no matching spectrum was recognized. The background library used in this work comprised, in total, 12 009 unannotated MS/ MS spectra acquired from doubly and triply charged precursor ions and was further preprocessed by removing low-abundance fragment peaks (see the definition below) from each spectrum to reduce computational time and memory requirements.
Results and Discussion
We developed a computational method for filtering background MS/MS spectra from LC-MS/MS runs on the basis of their similarity to spectra from a precompiled background library. Our approach is statistical in nature and does not rely upon any empirically chosen parameters, such as the number or percentage of matching peaks. The statistical model allows transparent control over filtering stringency and is independent of both the filtered query and background spectra library.
The library includes a representative set of unannotated background MS/MS spectra packed into a.mgf file. We underscore that spectra were collected irrespectively of their abundance, identity or information content. Hence, filtering was not intended to substitute spectral quality assessment.7,35
Once a representative background spectra library was compiled, filtering could be performed in the framework of the database similarity search. However, in contrast to traditional searches, we are less interested here in the identification of confident matches, but rather of the set of spectra, which match nothing in the background library and are therefore worth saving for further analysis.
Generally, a database similarity search consists of three components: a similarity/dissimilarity measure (in our case, between two MS/MS spectra with the same precursor m/z and charge), a search algorithm and a statistical framework to identify significant matches. Since our search algorithm is trivial, we focus below on the dissimilarity measure and on the estimation of its statistical significance.
Measure of Dissimilarity between MS/MS Spectra
Numerous measures of similarity between MS/MS spectra (reviewed above) were developed specifically for finding sufficient relatedness between weakly similar spectra for the purpose of accurate database searches. Our goal was entirely different, as we needed to identify whether sufficient nonbackground information is retained in queried MS/MS spectra. Often, valuable tandem mass spectra from target peptide precursors are polluted with only a few background peaks, which affect neither database searching, nor de novo interpretation.46 Yet, upon comparison with the corresponding background spectra, “background signature” warrants their statistically significant similarity and prompts false elimination of spectra of, otherwise, uncompromised quality. Also, rapid acquisition of MS/MS spectra in LC-MS/MS experiments affects ions statistics, and therefore, it is almost impossible to exactly reproduce both m/z and relative abundance of fragment ions.35
We therefore defined a measure that depends on the number of mismatched (rather than matched) peaks and determines if the two spectra are significantly dissimilar, rather than significantly similar. The approach was developed for and tested on tandem mass spectra acquired on a LTQ Orbitrap instrument. Survey scans were performed using the high resolution Orbitrap analyzer, while MS/MS spectra were acquired on the linear ion trap. Therefore, it was assumed that the charge state of each precursor ion was accurately determined and no alternative masses for the same precursor m/z were considered. If m/z and charge states of precursor ions of queried and library MS/MS spectra did not match, the spectra were considered dissimilar. If, regardless of their abundances, m/z and charge states of precursor ions matched, we further quantified the dissimilarity between m/z and abundances of corresponding fragment ions.
Our measure of dissimilarity between m/z and abundances of ragment ions is simple and follows a typical spectra evaluation routine used by an expert scientist. When comparing two MS/MS spectra, the expert will first of all notice any mismatched peaks of high relative abundance. Even if there are only a few such peaks, while many low-abundance background peaks match, the expert will have little doubt that the queried spectrum still possesses valuable information (Figure 1). We used this simple notion to define a numeric distance between the two spectra, i and j. In statistical terms, the distance relies upon the normalized density of mismatched peaks.
Figure 1.

Comparison of a queried MS/MS spectrum (peaks up) and a background spectrum (peaks down) acquired from precursors with matching m/z and charge state. In the spectra at the left-hand side panel, there are almost no unmatched high-intensity peaks, and therefore, the queried spectrum is, most likely, background. In the right-hand side panel, the queried spectrum contains meaningful nonoverlapping fragments, and despite pronounced background signature (ions within m/z 450 – 550 and above m/z 800), it should not be removed from the data set.
The intensity of each fragment peak was first normalized by the base peak intensity Imax and peaks with the intensity lower than 0.05 × Imax were discarded. Often the background and queried spectra matched only by relatively low-abundance fragments within the narrow m/z range right below m/z of the precursor ion, although fragment ions at the higher m/z region were different. This usually happened when a multiply charged peptide precursor ion was accidentally coisolated with an intense singly charged peak of nonpeptide background.47 Upon collisional fragmentation, background ion produced singly charged fragments densely populating the low m/z range of the spectrum, whereas the area above the precursor m/z remained clean and mostly contained singly charged ions produced from the multiply charged peptide precursor. Therefore, in each pair of MS/MS spectra, three m/z ranges were considered separately: m/z < 0.9 × (m/z)prec; 0.9 × (m/z)prec < m/z < (m/z)prec; m/z > (m/z)prec; where (m/z)prec stands for m/z of the precursor ion. These regions are designated with subscripts A, B, and C, respectively.
Within each region we defined Si,junm as the sum of fragmention intensities in the spectrum i, which do not match any fragments in the spectrum j within the selected mass tolerance, and Sitotal as the sum of all peak intensities in the spectrum i. Accordingly, Sj,iunm and Sjtotal have the same meaning, but in the spectrum j. The distance Dij between spectra i and j is given by eq 1:
| (1) |
The unmatched and total intensities were summed in all three regions in both spectra. The coefficients CA, CB, and CC were selected to maximize the removal of background spectra, while retaining all high quality target spectra, as was judged by their peptide ion scores computed by MASCOT. Intuitively, the largest weight should be given to peak intensities in the region C, which is almost free from chemical noise, while the smallest is given to peak intensities in the region B that is often enriched in background. We ran computational experiments on a small independent training set and, by optimizing the coefficients using a simple grid search, arrived at the following set of best-performing values: CA = 2; CB = 1; and CC = 4.
We underscore that the distance Dij, a spectra dissimilarity measure, does not rely on pairwise comparison of m/z and intensities of particular fragment peaks. Comparative computational experiments described below and in Supporting Information Figure 1S showed that its specificity greatly outperformed Pearson’s correlation and spectral angle approaches and was more robust against both the inherent variability of MS/MS spectra and random chemical noise.
Statistical Framework To Identify Significant Matches between MS/MS Spectra
Filtering was only expected to eliminate spectra that produced statistically significant matches to spectra from background library. While searching a database, we are naturally interested in the statistical significance of the very best match. This, somewhat surprisingly, greatly simplified the problem. We defined a distance, or a measure of dissimilarity, between MS/MS spectra regardless of spectra properties and were interested in the closest background match for each query spectrum. The statistical properties of the shortest distance in a sample represent a well-studied “extreme value problem”, which is often encountered when analyzing statistical confidence of database searching hits (see refs 48–50 for representative reviews). Regardless of the samples properties the extreme values come from, there are only three asymptotic forms for the probability distribution that are frequently called Gumbel, Frechet and Weibull distributions.51–53 The Gumbel and Frechet distributions only apply for values with an unbounded tail. In our case, dissimilarities between spectra are bounded by zero; that is, the closest possible match cannot have the dissimilarity value less than zero. Therefore, the extreme values of dissimilarities between spectra should follow the Weibull distribution for any definition of dissimilarity measure.
Weibull distribution has two parameters and one of the two should linearly scale with the size of the background library. We estimated the two parameters from simulations using a set of 2000 high quality MS/MS spectra, each of which produced a hit with ions score of 45 or above upon MASCOT searches against a protein database. Each spectrum was then compared to a library of 6000 background spectra and the distance to the closest match was stored. The cumulative distribution of these distances produced a good fit to the analytical form of the Weibull extreme value distribution (Figure 2). The two parameters α = 1.20 and β = 8.87 of the distribution were estimated from this fit (eq 2).
| (2) |
Figure 2.
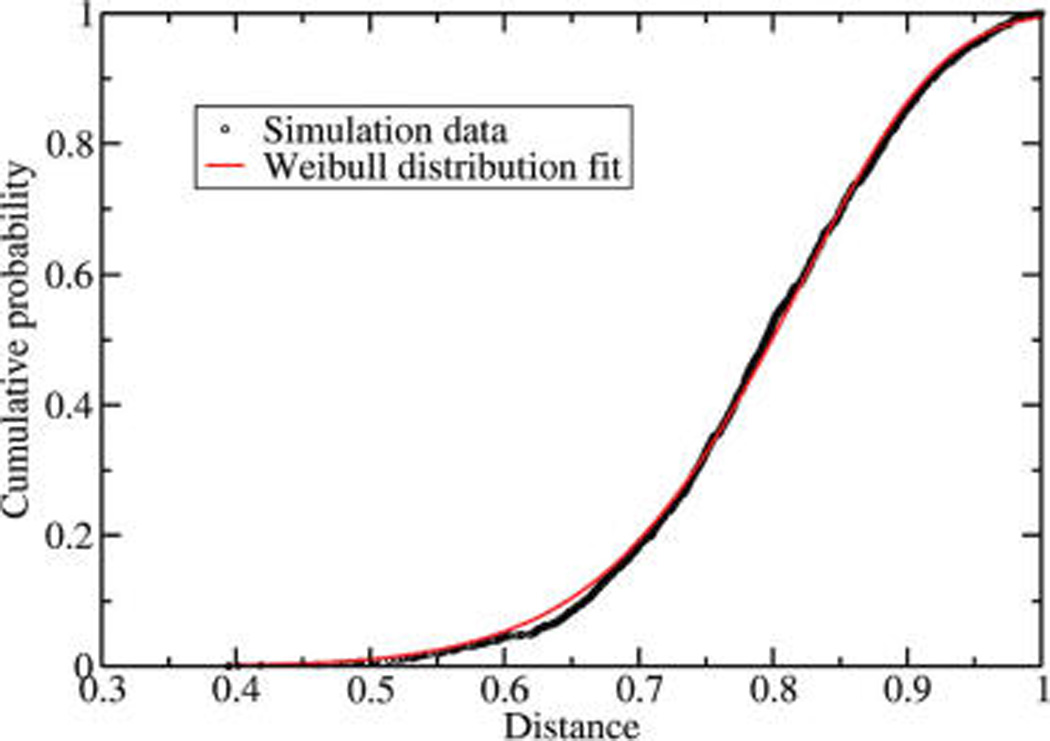
Cumulative distribution of scores of best matches of MS/MS spectra against the background library. Test empirical distribution for a data set of high-quality MS/MS spectra is presented as black circles and its Weibull approximation as a smooth red line. The x-axis represents the shortest distance obtained for each of the candidate spectra. The y-axis represents the probability of obtaining equal or a smaller distance at random.
By performing simulations using libraries of different sizes, we learned that the parameter α, indeed, scaled linearly with the background library size (data not shown). This was expected because it is related to the mathematical expectation of the number of hits with the dissimilarity value below a certain threshold and is directly proportional to the total library size, even if the library is partially redundant. Note that some library redundancy was, actually, desired since keeping several, slightly different, variants of MS/MS spectra acquired from the same background precursor compensated for systematic drift in the mass spectrometer settings (such as mass calibration drift or collision energy fluctuations) without compromising the filtering performance.
Knowing the distribution and its parameters allowed us to compute the probability that a random spectrum does not have a close match within the background library. This probability can be expressed as a p-value threshold, which controls the expected fraction of genuinely unique spectra falsely removed by filtering. It is important that this p-value corresponds to the conditional probability given the match of m/z and charge of the precursors. For example, if the precursor m/z and z of a background spectrum matched m/z and z of 10 000 high-quality spectra of genuine peptides, then we might expect that, under p-value cutoff of 0.001, approximately 10 of these spectra will be lost. Note that both spectra acquisition and filtering routines deliberately targeted only multiply charged precursors.
The Program Workflow
For filtering out background, users upload a compressed archive of (optionally, several).mgf files, each of which represents full set of MS/MS spectra produced in a LC-MS/MS run, and a background library (Figure 3). Users also specify the precursor mass tolerance, fragment mass tolerance and p-value threshold. Each spectrum, both in the query and background library, was preprocessed and fragment peaks lower than the intensity cutoff (usually, 5% of the base peak intensity) were removed. Preprocessed spectra were only used for speeding spectra comparison; however, the intact spectra were returned to the user once filtering was completed. The query filtering process started with finding all background spectra with matching m/z and charge for each queried spectrum. For these pairs of spectra, the program computed the dissimilarity measure. Since the p-value is a monotonous function of the dissimilarity, given the user-defined p-value and the library size, the program calculated the dissimilarity Dp. Any two spectra i and j whose pairwise dissimilarity Dij < Dp were considered matching and the corresponding queried spectrum was marked as background. The remaining unmatched spectra were marked as good. Upon filtering completion, good and background spectra were assembled into separate.mgf files that could be downloaded from the server via the provided link.
Figure 3.
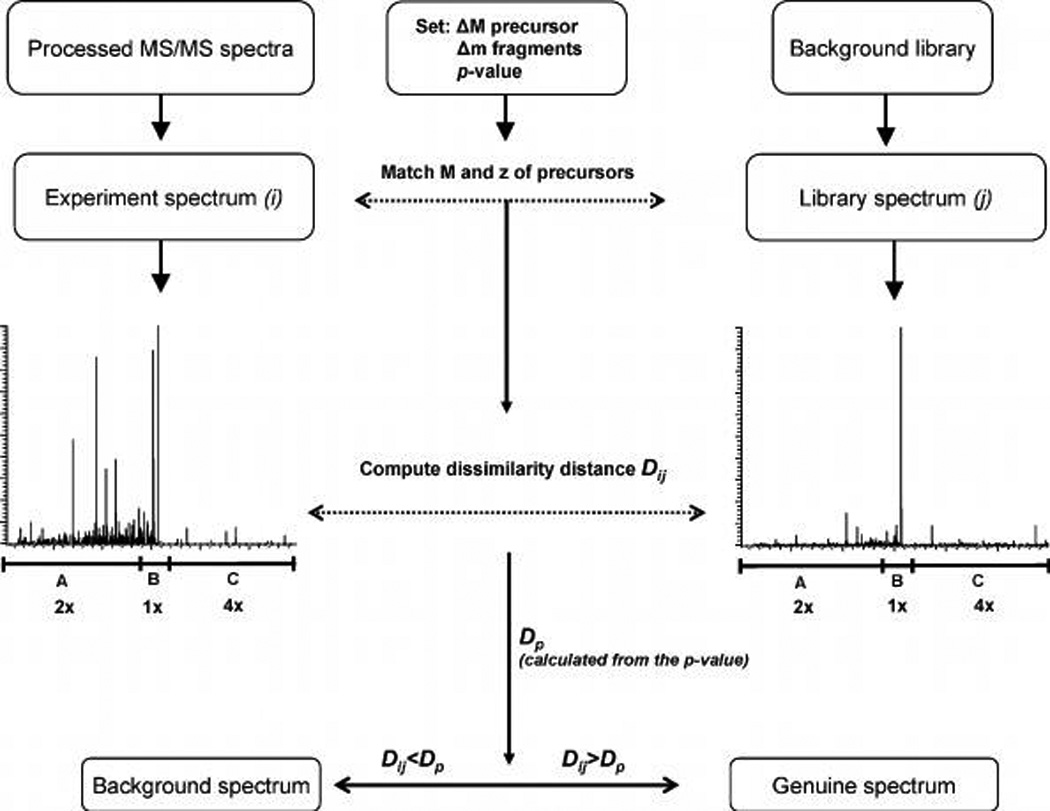
Workflow for filtering MS/MS spectra against a background library implemented in the EagleEye software. For each spectrum i out of the submitted pool, the software first identified the spectrum (or spectra) j in the background library, whose precursor masses (within the specified mass tolerance ΔM) and charges matched. Then, dissimilarity distance Dij was computed between spectra i and j by considering intensities of unmatched fragment peaks with mass tolerance Δm. To minimize the contribution of chemical noise, the unmatched intensities were taken with weights of 2, 1 and 4 for m/z ranges of A, B and C, respectively. Dij was further compared with the threshold distance Dp computed for the user-defined p-value according to eq 2. If Dij exceeded Dp, the compared spectra i and j were judged as significantly different and the probed spectrum i was declared nonbackground, even if they comprise some overlapping fragment peaks. Otherwise, spectrum i was considered as background. Note that the algorithm does not rely on pairwise correlation of abundances of fragment peaks with overlapping m/z.
Upon user’s request, the program can also build a nonredundant background library. EagleEye would cross-compare a user supplied spectra archive and only retain those with pairwise distances exceeding a user-defined threshold.
Validation and Performance of the Filtering Method
We operationally defined as background all spectra acquired while analyzing samples, which certainly do not contain any target proteins. In the simplest scenario of identification of gel separated proteins, background library could be reasonably represented by combining spectra acquired in LC-MS/MS runs of several in-gel digests of blank gel pieces (Figure 4). A typical background run produced more than 2000 spectra from multiply charged precursors, in which trypsin and a variety of sheep and human keratins were the only identifiable proteins; however, only a small fraction of these spectra matched corresponding protein entries upon MASCOT searches (see the analysis below). In the experience of our and other laboratories, massive keratin contamination of samples should be and can be avoided.21 However, despite the best efforts, poorly reproducible protein background is practically unavoidable at the low femtomole sequencing and its impact on the analysis depends on the user-defined sensitivity threshold (Figure 4) and specificity restrictions applied in database searches. Special care and different experimental strategy should be taken for the proteomics study of endogenous keratins.
Figure 4.
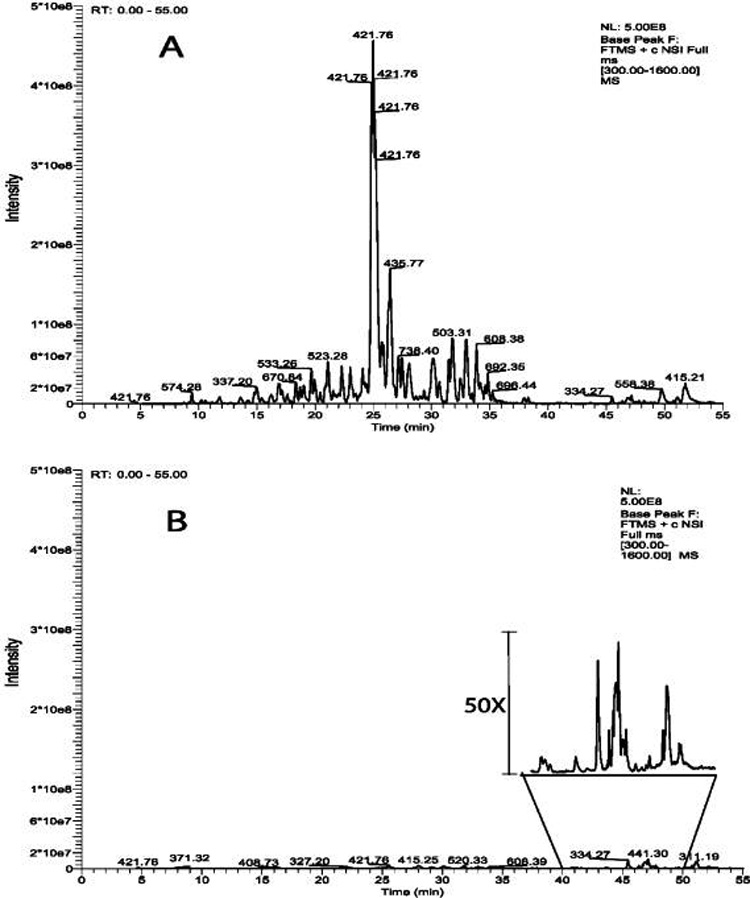
Base peak traces of LC-MS/MS runs of a typical control in-gel digest (A) and blank injection of 4 µL of 0.1% TFA (sample loading buffer) (B). Only multiply charged ions were selected for MS/MS in DDA experiments. The analysis of control in-gel digest produced 2087 MS/MS spectra, among them, 29 (4+); 357 (3+); 1701 (2+); blank injection, 66 MS/MS spectra; 4 (3+), 62 (2+). The assumed charges of the precursors are in parenthesis. MASCOT searches only identified trypsin and a variety of keratins.
To obtain a representative background library, we combined (without checking for inherent redundancy) MS/MS spectra from four independent control runs, which totaled 6415 spectra. To compensate the compositional variability of common contaminants,47,54 we added spectra from two separate LC-MS/MS runs of in-solution trypsin autolysates (2183 unique spectra screened against the above library). Further 1750 trypsin and keratin spectra that were not, for any reason, removed by EagleEye software, were hand picked from various analysis. Here, we deliberately refrained from reducing the library redundancy, although such option is available in EagleEye software. In total, the background library used in further experiments, contained 10 348 unannotated spectra acquired from multiply charged precursors of most common contaminants.
To validate the statistical model and evaluate the filtering performance of EagleEye, we created an artificial spectra data set having the precisely known composition. It comprised another independent control LC-MS/MS run (1659 background spectra) and the known number of hand-picked MS/MS spectra of the known quality (estimated by their peptide ion scores) that unequivocally matched nonbackground proteins upon MASCOT searches. The entire range of peptide ion scores was split into 4 bins and the model data set contained 100 MS/MS spectra for each score bin. The assignment of spectra to corresponding ions score bins was encoded into their filenames so that counting of retained and removed spectra did not require any further database searches.
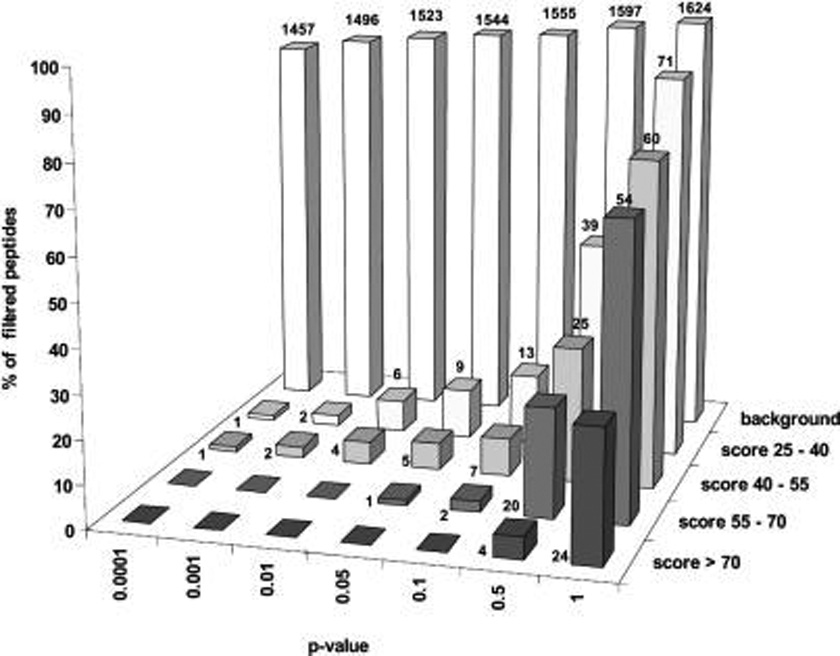
Experiments with the model data set demonstrated high filtering efficiency and good accuracy of the estimation of expected losses of nonbackground spectra (Figure 5A). For example, under p = 0.01 EagleEye removed more than 90% of all background spectra, while losing a single non-background MS/MS spectrum having a marginal peptide ions score. Increasing p-values slightly enhanced the filtering efficiency in terms of the number of removed background spectra, albeit some losses of target spectra also occurred. Note that, in principle, setting p = 1 should result in almost complete loss of spectra matching specificity. However, it remained conditionally dependent on matching of precursor m/z and charges and therefore less than 100% of spectra were lost.
Figure 5.

Evaluation of the filtering efficiency using a model data set. Bars represent the percentage of removed spectra with a given peptide ion score and p-value. The exact number of removed spectra is presented at each bar; bars without numbers indicate zero values. The total number of background spectra in the data set was 1659, and each peptide ion score bin contained 100 spectra. In panel A, mass tolerance was 0.01 Da for precursor ions and 0.6 Da for fragment ions. In panel B, p-value was fixed at 0.01 and precursor mass tolerance (in Da) varied, whereas fragment mass tolerance was 0.6 Da.
EagleEye outperformed spectra filtering approaches based on Pearson correlation and spectral angle similarity measures in the series of comparative tests (Supporting Information, Figure 1S), especially if precursor masses were considered with typical ion trap (±1 Da) tolerance, while the fragment mass tolerance was fixed. The observed difference came from the increased number of compared background and true spectra (note that their precursor masses should coincide within the preset tolerance), and therefore, similar losses of filtering efficiency should be expected when processing large proteomics data sets even under the high mass accuracy settings.
As anticipated, larger precursor mass tolerance (under the fixed p-value) slightly loosened the matching specificity and increased both the number of spectra of falsely removed target peptides and of correctly removed background (Figure 5B). Importantly, spectra losses also remained acceptable even under typical ion trap mass accuracy of ±1 Da.
We next asked if the filtering performance depends on the size and compositional properties of the background library. To this end, we built a much larger library by combining unannotated MS/MS spectra from 63 shotgun LC-MS/MS runs of in-solution tryptic digests of immunoaffinity isolations of various human protein complexes, in which 50–200 individual proteins were identified by MASCOT in each run (Supporting Information, Table 1S). To this collection, we added the above library of in-gel background spectra such that the new library contained, in total, 256 806 partially redundant unannotated spectra (Figure 6). Altogether, compared to the library of a typical in-gel digestion background (used in simulations shown in Figure 5), the new proteomics library was 25-fold larger and contained many more high quality peptide spectra from a variety of human proteins. Specifically for this test, we also compiled a new model data set essentially as described above, but, instead, used MS/MS spectra of peptides from various budding yeast proteins. MASCOT searches did not identify any yeast proteins in the immunoaffinity isolations used as a source for building the proteomics background library.
Figure 6.
Filtering of a model spectra data set against a rich proteomics background library of 256 806 MS/MS spectra. Bars represent the percentage of removed spectra with a given peptide ion score and p-value. The exact number of removed spectra are presented at each bar; bars without numbers indicate zero values. The model data set contained 1659 background spectra from a separate control LC-MS/MS run and 80 nonbackground spectra per each peptide ion score bin. The precursor mass tolerance was 0.01 Da; the fragments mass tolerance was 0.6 Da.
As anticipated (see the discussion above), the statistical model and p-values were relatively unaffected by both the library properties and size. Under restrictive p-values of 1 × 10⁻⁴ to 1 × 10⁻², slightly larger losses of target peptides occurred, yet being generally within the acceptable range, while the filtering efficiency remained high. Filtering removed slightly more background spectra (increase from 90% to 92% under p = 0.01), most likely because of the more complete background library. Importantly, when this large background library was uploaded at the server, filtering of the query of 1979 MS/MS spectra took less than 10 min, including uploading the query via the Internet. Hence, we concluded that, by means of user-defined p-values, the employed statistical model offers full control over the filtering specificity. Filtering efficiency was relatively unaffected by the database properties and size and proceeded at high speed, hence, lending itself to high-throughput data processing.
What Spectra Were Removed by Filtering?
We next asked what fraction of the removed spectra could be attributed to peptides and if EagleEye filtering, which does not rely on spectra to sequence matching, would remove more background spectra, than are recognized by both stringent and error-tolerant database searches (otherwise, there would be no need to filter). We note that the precise origin and information content of a very large number of LC-MS/MS spectra that match nothing in a database directly have been extensively debated as one of the major sources of false positive identifications.4,6,7,55
To this end, we analyzed in a layered manner the background spectra removed from the model data set (Figure 5A) under p-value of 0.01, starting from stringent and then error-tolerant searches by MASCOT and ending up with their de novo interpretation and MS BLAST database searches32 (Figure 7). Once certain spectra had been matched to a database entry, they were removed from the data set and were not considered in further analysis. In total, only 391 background spectra (26% of the total) were identifiable by MASCOT, even if enzyme cleavage specificity restrictions were not applied. Other 152 spectra (10%) were matched to trypsin/keratin entries upon de novo sequencing and MS BLAST searches. For the remaining 63% spectra, either de novo interpretation produced no quality peptide candidates (we used the value of 6 as an arbitrary PepNovo sequence quality score cutoff),32,46 or subsequent MS BLAST searches produced no confident alignments.34 Taken together, EagleEye filtering removed 4 times more background spectra than were recognized by any searches against a protein sequence database. We note that EagleEye would be equally applicable for subtracting any unannotated spectra (for example, originating from proteins with unknown sequences or modified peptides) and could rapidly and safely rectify large proteomics data sets for computationally demanding error-tolerant interpretations.13,55–59
Figure 7.
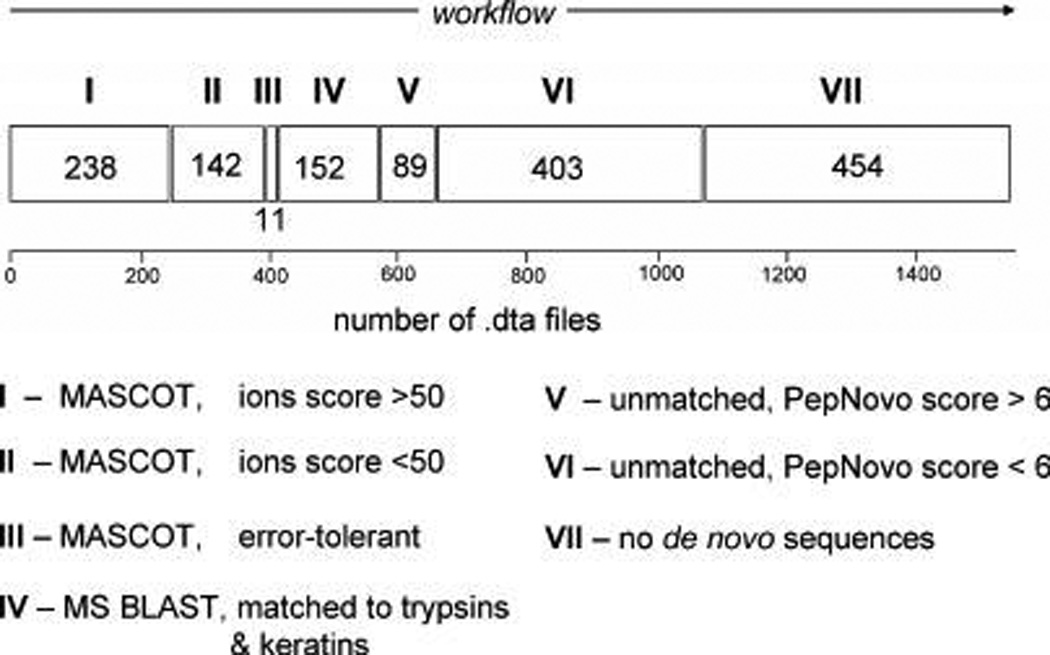
MS/MS spectra removed by EagleEye filtering from the model data set (Figure 5A) under p-value of 0.01 were analyzed by several steps of stringent and sequence-similarity database searches. Data processing started with stringent (MASCOT) database searches with and without enzyme cleavage specificity and matched spectra were removed. The remaining spectra were interpreted de novo and sequence candidates submitted to MS BLAST search as described.32 MASCOT searches in steps I, II and III only hit trypsin and keratin peptides. Step IV only accounted for spectra whose de novo interpretation produced candidate peptides confidently aligned to trypsin and keratin sequences. In steps V and VI, candidate sequences were produced by de novo interpretation yet were not confidently matched by MS BLAST. PepNovo score less than 6 usually indicates poor quality sequence predictions. De novo interpretation of spectra at step VII failed to produce any sequence candidates. The analyzed data set comprised, in total, 1489 background MS/MS spectra acquired from multiply charged precursors.
Filtering Improves the Performance of Sequence Similarity Searches
Experiments with model data sets demonstrated that filtering dramatically reduced the size of MS/MS spectra queries and efficiently eliminated trypsin/keratin-related peptide background, while retaining nonbackground spectra of even marginal quality. Sequence similarity searches with LC-MS/MS data sets are hampered by two major factors, which are both related to protein background.32 Large size of sequence queries requires huge amount of computational work, most of which is, in fact, done in vain. However, most importantly, because of the reasons discussed above, searches usually produce a large number of statistically confident hits, whose relation to keratin and trypsin might only be revealed by careful manual inspection of reported alignments and full-length sequences of protein hits. Here, we demonstrate that EagleEye filtering dramatically reduced the negative impact of both factors.
We analyzed in-gel tryptic digests of several 2D spots of proteins isolated from a blood-sucking bug T. infestans (a vector of Chagas disease)60 and from Brazilian endemic pine A. angustifolia. Genomes of both species are unknown and protein identification heavily relied on sequence similarity searches. Additionally, as a much simplified test, we analyzed an in-gel digest of BSA band using de novo sequencing sequence similarity searches. Among confident and borderline hits, produced by MS BLAST searches according to the adopted scoring scheme,34 we counted the number of target protein hits (also supported by a few peptides matched by MASCOT to homologous proteins from other species), the number of apparent trypsin and keratin hits (database entries, explicitly annotated as trypsin and keratins) and the number of “orphan” hits, which were not explicitly annotated as trypsin or keratins, but were also unrelated to the target proteins. Solely for the evaluation purpose, we deliberately selected examples in which both MASCOT and MS BLAST searches independently pinpointed the same major hit(s) since it would be easier to distinguish “orphan” and “true” hits. It was therefore not surprising that many hits were reported since these were highly conserved proteins and MS BLAST identified their homologues in a variety of species. Hits were separately counted among confident and borderline MS BLAST identifications and the experiments were performed with initial and filtered data sets under the same search settings. For the sake of analysis consistency, a low complexity filter was not employed in MS BLAST searches.
A representative bar diagram of the distribution of MS BLAST hits before and after EagleEye filtering is shown in Figure 8 and another four case studies are presented in Figure 2S in Supporting Information.
Figure 8.

Representative diagram of the distribution of MS BLAST hits obtained in searches with the raw (unfilled bars) and filtered (filled bars) queries. In the sample, both MASCOT and MS BLAST searches produced cross-species hits to actins from various plant species. True hits bars stand for actin and related entries; K-T bars, hits annotated as trypsins and keratins from various species; “Orphan” hits, statistically confident hits, unrelated to actins and not explicitly annotated as trypsins and keratins. The unprocessed data set contained 1821 MS/MS spectra, from which EagleEye filtering under p = 0.01 removed 1117 spectra. MS BLAST searches with raw and filtered queries took 38 and 8 min, respectively.
Figure 8 shows a representative diagram obtained by LC-MS/MS analysis of a silver stained spot of 42 kDa protein from A. angustifolia. MASCOT produced cross-species hits to several plant actins (best hit to Q9SPI7 actin from the spruce Picea rubens matched by 23 spectra with ions scores above 20). De novo sequencing followed by MS BLAST search confirmed the MASCOT hit (top hit P93485 actin from the pea Pisum sativum) and reported a large number of hits to homologous proteins from a variety of plant, mammalian, insect and bacteria species. Besides those, the search produced 470 hits directly related to trypsin and keratins (as judged by the annotations of database entries) and 838 orphan hits. We termed these hits orphan (rather than “false positives”) because they were not false positives in the statistical sense, albeit many of them (but not all!) could be traced by full-length BLAST searches to unannotated keratin or trypsin sequences or proteins whose sequences share with them significant local similarity. Compared to stringent MASCOT or SEQUEST searches, such analysis is very laborious and produces many tentative assignments.
EagleEye filtering decreased by 56-fold the number of orphan hits (down to 15 entries) and by 5-fold the number of trypsin/keratin (down to 92 entries), while also shortening the search time by 5-fold (Figure 8). Importantly, in this case, the number of true hits even slightly increased, apparently because, while processing the raw data set, BLAST engine falsely engaged a few candidate sequences into background-related alignments.
Similar tendency toward strong decreasing query sizes and, most importantly, numbers of trypsin/keratin and orphan hits was observed in all case studies presented in Supporting Information Figure 2S and, additionally, corroborated by a model experiment with the band of BSA standard, in which, by definition, it was straightforward to distinguish true and orphan hits. Importantly, in all cases, the number of reported true hits was practically unchanged, although many of them were redundant hits to homologous proteins in various species.
Taken together, EagleEye filtering markedly improved the performance of sequence similarity protein identifications by reducing the number of background-related orphan hits, while preserving the vast majority of peptide spectra originating from target proteins.
Filtering Improves the Identification of Low-Abundance Gel Separated Proteins
While identifying low-abundance gel separated proteins by LC-MS/MS, thousands of background MS/MS spectra (Figure 4) of varying quality and information content (Figure 7) are typically produced. Therefore, to control the rate of false positive identifications, higher matching specificity (and, consequently, higher threshold scores) are required compared to “clean” data sets.61 This, in turn, affects the identification of bona fide peptides from low abundant proteins that only produce marginal quality low scoring MS/MS spectra. We therefore reasoned that rapid removal of the bulk of unannotated background MS/MS spectra should lower false positive rate and, hence, rescue borderline (yet genuine) peptide hits.
We composed a data set of 10 independent LC-MS/MS runs of in-gel digests of plant proteins selected from a few proteomics projects. We reasoned that in database searches all plant hits (including cross-species hits) would represent bona fide target proteins, while hits from other species (like mammals) might be either background (for example, keratins) or false positives. Upon EagleEye filtering against in-gel background database, on average, 62% of acquired MS/MS spectra were removed (Table 2S in Supporting Information). We then searched raw and filtered MS/MS queries by MASCOT against MSDB and decoy databases61 and compared score distributions of plant hits in MSDB and all hits in decoy database as a measure of false positives rate.
Filtering did not affect the distribution of scores of matched plant peptides, while the number of false positive hits in a decoy database was very strongly reduced, as much as 5-fold at the marginal peptide ion score of 30 (Figure 9, Supporting Information Table 2S). In 8 out 10 digests, filtering reduced the total number of protein hits in decoy searches by 4- to 15-fold and in 2 digests no decoy protein hits were observed (Supporting Information Table 2S). In line with these observations, the number of nonplant hits in the search against MSDB was greatly reduced (including many borderline hits that might be pointing to homologous proteins from distantly related species and therefore requiring careful case-by-case manual validation), hence, greatly simplifying the accurate interpretation of full data sets (Supporting Information Figure 3S).
Figure 9.
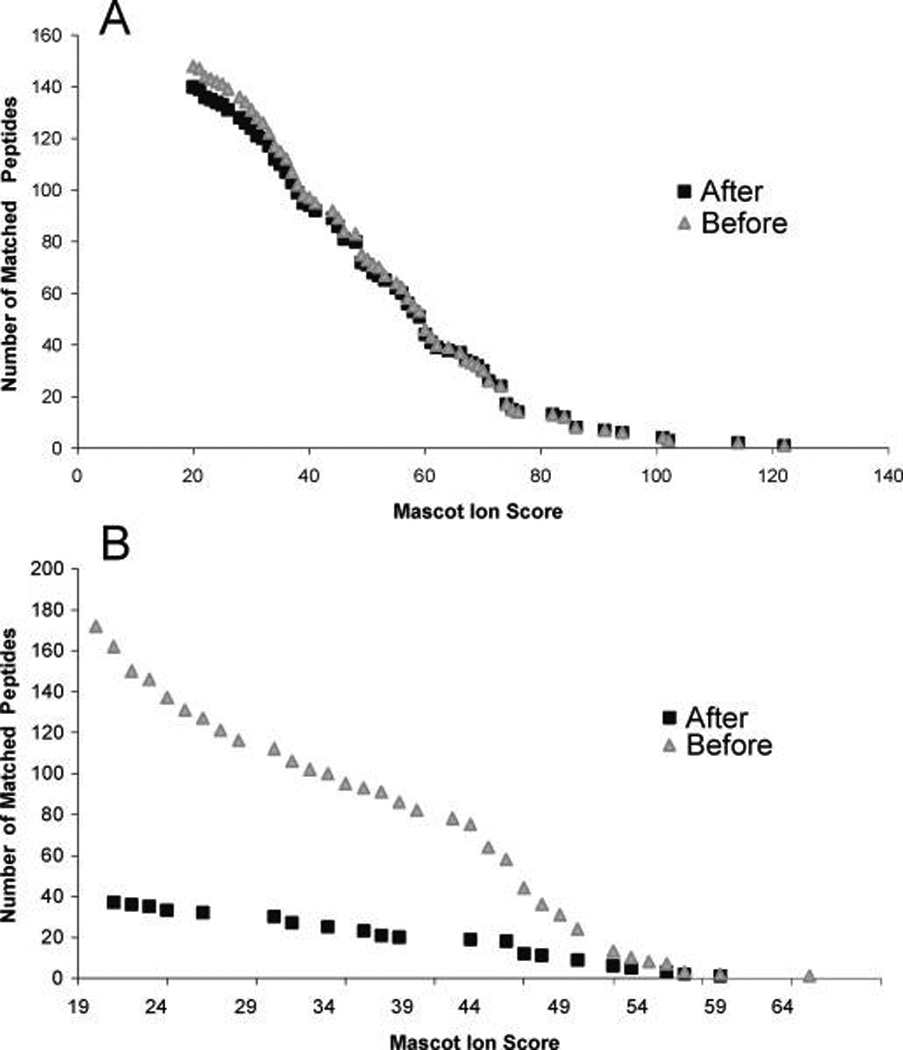
Cumulative distributions of peptide ion scores obtained in database searches of 10 independent LC-MS/MS runs against MSDB (A) and decoy (B) databases. Data points indicate the number of matched peptide with the given or lower score before (filled squares) and after (filled triangles) EagleEye filtering. Panel A presents the distribution of peptides matched to plant protein entries only. Note that the distribution of genuine hits was only slightly affected at the low scoring end, while at the same scores, decoy hits were observed in substantially lower numbers because of massive removal of background MS/MS spectra (B).
Filtering Improves Confidence of Protein Identification in Complex Mixtures
Biochemical isolation of protein assemblies, such as organelles or protein complexes, is usually accompanied by copurification of a large number of nonspecifically interacting proteins, which hamper the identification of genuine transient interactors.22,23,25,62 We hypothesized that EagleEye filtering would facilitate their identification in complex mixtures if the experiment design enables compilation of a representative background spectra library, irrespective of its internal redundancy and size.
To substantiate this notion, we considered a series of 63 immunoaffinity isolations of human protein complexes that were performed, with some modifications, as described in ref 42. Eluted proteins were digested in-solution, and tryptic peptides were desalted and concentrated on a reversed-phase cartridge and analyzed by LC-MS/MS. We compiled a proteomics background library out of 256 806 MS/MS spectra as described above and then selected another 6 immunoaffinity purifications from unrelated projects in which the tagged baits were not expected to produce any common interaction partners with the ones in the library, apart from usual protein background. Full MS/MS data sets from these immunoaffinity purifications were filtered against the protein background library and raw (unprocessed) and filtered data sets were searched by MASCOT against MSDB and decoy61 databases.
In agreement with Figure 6, we observed that, in many instances (including all already known genuine interactors, which served here as positive controls) filtering either removed no peptide spectra of target proteins, or removed a few spectra of marginal quality (data not shown). At the same time, the overall size of the queries was, on average, reduced by 2-fold by removing 2300–4300 spectra (details on the filtering efficiency are provided in Supporting Information, Table 1S). Cumulative distributions of peptide ion scores of decoy database hits obtained by searches with raw and filtered queries (Figure 10) demonstrated marked improvement of false positive rate, especially within the range of marginal peptide ions scores.
Figure 10.
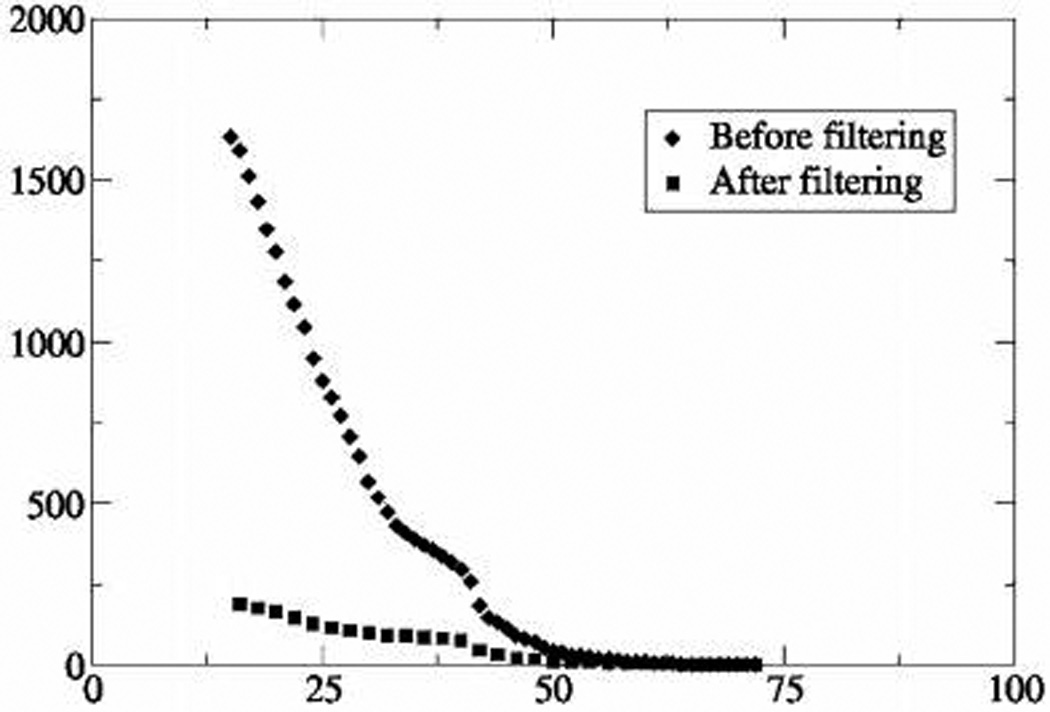
Cumulative distribution of peptide ion scores (x-axes) of decoy database hits (y-axes) before and after filtering of MS/MS data sets, acquired from immunoaffinity isolation experiments. Filtering was performed against a library of 256 806 tandem mass spectra obtained in 63 independent control experiments using unrelated baits.
Lower threshold scores enabled to claim confident matching of another 1520 spectra representing 814 unique peptides that, otherwise, should have been discarded.
Hence, we demonstrated that EagleEye filtering of complex proteomics data sets specifically and efficiently enriched MS/MS spectra from target proteins, regardless of their origin and annotation. We caution, however, that the proposed method is qualitative, rather than quantitative, and will work well only if screening is intended to enrich for MS/MS spectra that are completely absent in the control library–any quantitative information on the abundance of fragmented precursors is deliberately neglected.
When and How To Apply EagleEye Filtering?
EagleEye filtering safely and rapidly removes background spectra from large MS/MS queries of diverse quality and information content. As demonstrated above, it strongly improved protein identifications when database searches lacked specificity, either because of the data set properties (such as overwhelming number of MS/MS spectra from unrelated proteins), or because of deliberately relaxed matching requirements in error-tolerant searches.
Because of the high specificity of stringent database searches, filtering might not be required for identifying major protein components hit by several matching peptides. Things, however, look very different for the protein characterization by sequence similarity and or error-tolerant searches, because of much higher sequence search space and lower stringency of spectrum to sequence matching. Therefore, it is definitely worth filtering the queries prior to the identification of proteins via de novo sequencing, or unbiased (nonhypothesis driven) searches for modified and/or polymorphic peptide sequences, or identification of low-abundance components.
Our experience in applying filtering in numerous proteomics analyses suggests that the actual number of removed spectra is not an unequivocal merit of its efficiency. The number of acquired background spectra might vary and, apart from other factors, depends on the amount and properties of target proteins. When analyzing in-gel digests, trypsin/keratin peptides might serve as useful markers for troubleshooting Eagle-Eye performance. It is always expected that filtering should remove the bulk of trypsin/keratin peptides identifiable by both conventional and sequence similarity database searches (Figure 7 and Figure 8, Figure 2S in Supporting Information). Comparison of outputs of MASCOT searches of raw and filtered queries provides useful hints for either adjusting the filtering settings (precursor and fragment mass tolerances, p-value), or indicating that it might be necessary to compile another library that better reflects actual background patterns. In our experience, when building a background library it is important to consider that (i) MS/MS spectra depend on the instrument type and applied collision energy, (ii) single LC-MS/MS run does not fully represent the peptide composition of analyzed digest, and (iii) EagleEye matching algorithm is not applicable to spectra acquired from singly charged precursors.
Conclusion and Perspectives
Here, we present an algorithm and its software implementation that removes background tandem mass spectra from LC MS/MS data sets. The algorithm is based on the statistical estimate of spectra dissimilarity and does not rely upon any presumed peptide fragmentation model or protein sequence resource. Hence, the approach is, in principle, fully cross-platform, although, because of the adopted spectra matching model, it is not applicable for screening MS/MS from singly charged precursors. Note that the model also does not rely on pairwise comparison of intensities of matched peaks, which makes it highly robust toward inherent variability of fragment ion patterns, which is a well-known limitation of alternative peak correlation approaches. We demonstrated that filtering improved both stringent (MASCOT) and sequence similarity identification of proteins (de novo sequencing followed by MS BLAST search) by reducing both the computational load and the rate of false positive and false negative hits. Since EagleEye software operates with unannotated spectra, it was far more efficient, rapid and unbiased, compared with methodologies that, by some means, rely on sequence database searches.
Future developments could combine filtering with some kind of quality assessment scoring to further reduce the query size, yet preserving the most valuable spectra. Effectively, we used the PepNovo sequence quality score to select suitable candidate sequences for MS BLAST searches; however, rapid and less interpretation-biased spectra quality assessment algorithms are much desired.7,55
We demonstrated that filtering improved the speed, sensitivity, and statistical confidence of protein identifications and its performance was practically unaffected by the variations in size and properties of both queried and library MS/MS data sets. Computationally, filtering could be organized as a massively parallel process distributed among several nodes and could be much faster than a typical stringent database search against a large protein sequence database. Therefore, we believe it could be seamlessly integrated into any proteomics data interpretation pipeline.
Supplementary Material
Figures of evaluation of the filtering efficiency using Pearson’s correlation and spectral angle approaches; representative diagram of the distribution of MS BLAST hits obtained in searches with the raw and filtered queries; output of the MASCOT search of LC-MS/MS run of in-gel digest of a silver-stained spot before and after EagleEye filtering; tables characterizing EagleEye filtering efficiency of 10 silver-stained spots of plant proteins. This material is available free of charge via the Internet at http://pubs.acs.org.
Acknowledgment
The authors are grateful to Dr. Bianca Habermann and members of the Shevchenko laboratory (MPI CBG, Dresden, Germany) for useful discussion and experimental support; Drs. Anthony Hyman and Frank Buchholz (MPI CBG, Dresden, Germany) for collaboration on the analysis of immunopurified protein complexes; Drs. Pavel Pevzner and Ari Frank for interfacing PepNovo software to MS BLAST. The work was supported by grants PTJ-BIO/ 0313130 from BMBF (A.S.) and 1R01GM070986-01A1 from NIH NIGMS (S.S. and A.S.); T.S.B. was supported by short-term fellowships from DAAD and FAPESP (05/58747-8).
References
- 1.Aebersold R, Mann M. Mass spectrometry-based proteomics. Nature. 2003;422:198–207. doi: 10.1038/nature01511. [DOI] [PubMed] [Google Scholar]
- 2.Pandey A, Mann M. Proteomics to study genes and genomes. Nature. 2000;405:837–846. doi: 10.1038/35015709. [DOI] [PubMed] [Google Scholar]
- 3.Venable JD, Dong MQ, Wohlschlegel J, Dillin A, Yates JR. Automated approach for quantitative analysis of complex peptide mixtures from tandem mass spectra. Nat. Methods. 2004;1:39–45. doi: 10.1038/nmeth705. [DOI] [PubMed] [Google Scholar]
- 4.Chalkley RJ, Baker PR, Hansen KC, Medzihradszky KF, Allen NP, Rexach M, Burlingame AL. Comprehensive analysis of a multidimensional liquid chromatography mass spectrometry dataset acquired on a quadrupole selecting, quadrupole collision cell, time-of-flight mass spectrometer: I. How much of the data is theoretically interpretable by search engines. Mol. Cell. Proteomics. 2005;4:1189–1193. doi: 10.1074/mcp.D500001-MCP200. [DOI] [PubMed] [Google Scholar]
- 5.Cutillas PR, Biber J, Marks J, Jacob R, Stieger B, Cramer R, Waterfield M, Burlingame AL, Unwin RJ. Proteomic analysis of plasma membrane vesicles isolated from the rat renal cortex. Proteomics. 2004;5:101–112. doi: 10.1002/pmic.200400886. [DOI] [PubMed] [Google Scholar]
- 6.Johnson RS, Davis MT, Taylor JA, Patterson SD. Informatics for protein identification by mass spectrometry. Methods. 2005;35:223–236. doi: 10.1016/j.ymeth.2004.08.014. [DOI] [PubMed] [Google Scholar]
- 7.Savitski MM, Nielsen ML, Zubarev RA. New data base-independent, sequence tag-based scoring of peptide MS/MS data validates Mowse scores, recovers below threshold data, singles out modified peptides, and assesses the quality of MS/MS techniques. Mol. Cell. Proteomics. 2005;4:1180–1188. doi: 10.1074/mcp.T500009-MCP200. [DOI] [PubMed] [Google Scholar]
- 8.Shevchenko A, Leal de Sousa MM, Waridel P, Bittencourt ST, Valle de Sousa M, Shevchenko A. Sequence similarity-based proteomics in insects: characterization of the larvae venom of the Brazilian moth Cerodirphia speciosa. J. Proteome Res. 2005;4:862–869. doi: 10.1021/pr0500051. [DOI] [PubMed] [Google Scholar]
- 9.Liska AJ, Popov AV, Sunyaev S, Coughlin P, Habermann B, Shevchenko A, Bork P, Karsenti E. Homology-based functional proteomics by mass spectrometry Application to the Xenopus microtubule-associated proteome. Proteomics. 2004;4:2707–2721. doi: 10.1002/pmic.200300813. [DOI] [PubMed] [Google Scholar]
- 10.Schaefer H, Chamrad DC, Marcus K, Reidegeld KA, Bluggel M, Meyer HE. Tryptic transpeptidation products observed in proteome analysis by liquid chromatography-tandem mass spectrometry. Proteomics. 2005;5:846–852. doi: 10.1002/pmic.200401203. [DOI] [PubMed] [Google Scholar]
- 11.Thiede B, Lamer S, Mattow J, Siejak F, Dimmler C, Rudel T, Jungblut PR. Analysis of missed cleavage sites, tryptophan oxidation and N-terminal pyroglutamylation after in-gel tryptic digestion. Rapid Commun. Mass Spectrom. 2000;14:496–502. doi: 10.1002/(SICI)1097-0231(20000331)14:6<496::AID-RCM899>3.0.CO;2-1. [DOI] [PubMed] [Google Scholar]
- 12.Shevchenko A, Sunyaev S, Loboda A, Shevchenko A, Bork P, Ens W, Standing KG. Charting the proteomes of organisms with unsequenced genomes by MALDI-quadrupole time-of-flight mass spectrometry and BLAST homology searching. Anal. Chem. 2001;73:1917–1926. doi: 10.1021/ac0013709. [DOI] [PubMed] [Google Scholar]
- 13.Sunyaev S, Liska AJ, Golod A, Shevchenko A. MultiTag: multiple error-tolerant sequence tag search for the sequence-similarity identification of proteins by mass spectrometry. Anal. Chem. 2003;75:1307–1315. doi: 10.1021/ac026199a. [DOI] [PubMed] [Google Scholar]
- 14.Chalkley RJ, Baker PR, Huang L, Hansen KC, Allen NP, Rexach M, Burlingame AL. Comprehensive analysis of a multidimensional liquid chromatography mass spectrometry dataset acquired on a quadrupole selecting, quadrupole collision cell, time-of-flight mass spectrometer: II. New developments in protein prospector allow for reliable and comprehensive automatic analysis of large datasets. Mol. Cell. Proteomics. 2005;4:1194–1204. doi: 10.1074/mcp.D500002-MCP200. [DOI] [PubMed] [Google Scholar]
- 15.Huang L, Jacob RJ, Pegg SC, Baldwin MA, Wang CC, Burlingame AA, Babbitt PC. Functional assignment of the 20S proteasome from Trypanosoma brucei using mass spectrometry and new bioinformatics approaches. J. Biol. Chem. 2001;17:28327–28339. doi: 10.1074/jbc.M008342200. [DOI] [PubMed] [Google Scholar]
- 16.Taylor JA, Johnson RS. Implementation and uses of automated de novo peptide sequencing by tandem mass spectrometry. Anal. Chem. 2001;73:2594–2604. doi: 10.1021/ac001196o. [DOI] [PubMed] [Google Scholar]
- 17.Mackey AJ, Haystead TAJ, Pearson WR. Getting more from less: Algorithms for rapid protein identification with multiple short peptide sequences. Mol. Cell. Proteomics. 2002;1:139–147. doi: 10.1074/mcp.m100004-mcp200. [DOI] [PubMed] [Google Scholar]
- 18.Mann M, Wilm M. Error-tolerant identification of peptides in sequence databases by peptide sequence tags. Anal. Chem. 1994;66:4390–4399. doi: 10.1021/ac00096a002. [DOI] [PubMed] [Google Scholar]
- 19.Parker KC, Garrels JI, Hines W, Butler EM, McKee AH, Patterson D, Martin S. Identification of yeast proteins from two-dimensional gels: working out spot cross-contamination. Electrophoresis. 1998;19:1920–1932. doi: 10.1002/elps.1150191110. [DOI] [PubMed] [Google Scholar]
- 20.Shevchenko A, Wilm M, Vorm O, Mann M. Mass spectrometric sequencing of proteins from silver-stained polyacrylamide gels. Anal. Chem. 1996;68:850–858. doi: 10.1021/ac950914h. [DOI] [PubMed] [Google Scholar]
- 21.Shevchenko A, Tomas H, Havlis J, Olsen JV, Mann M. In-gel digestion for mass spectrometric characterization of proteins and proteomes. Nat. Protoc. 2006;1:2856–2860. doi: 10.1038/nprot.2006.468. [DOI] [PubMed] [Google Scholar]
- 22.Shevchenko A, Schaft D, Roguev A, Pijnappel WWMP, Stewart AF, Shevchenko A. Deciphering protein complexes and protein interaction networks by tandem affinity purification and mass spectrometry: analytical perspective. Mol. Cell. Proteomics. 2002;1:204–212. doi: 10.1074/mcp.m200005-mcp200. [DOI] [PubMed] [Google Scholar]
- 23.Roguev A, Shevchenko A, Schaft D, Thomas H, Stewart AF. A comparative analysis of an orthologous proteomic environment in the yeasts S.cerevisiae and S.pombe. Mol. Cell. Proteomics. 2004;3:125–132. doi: 10.1074/mcp.M300081-MCP200. [DOI] [PubMed] [Google Scholar]
- 24.Link AJ, Eng J, Schieltz DM, Carmack E, Mize GJ, Morris DR, Garvik BM, Yates JR., 3rd Direct analysis of protein complexes using mass spectrometry. Nat. Biotechnol. 1999;17:676–682. doi: 10.1038/10890. [DOI] [PubMed] [Google Scholar]
- 25.Andersen JS, Wilkinson CJ, Mayor T, Mortensen P, Nigg EA, Mann M. Proteomic characterization of the human centrosome by protein correlation profiling. Nature. 2003;426:570–574. doi: 10.1038/nature02166. [DOI] [PubMed] [Google Scholar]
- 26.Rinner O, Mueller LN, Hubalek M, Muller M, Gstaiger M, Aebersold R. An integrated mass spectrometric and computational framework for the analysis of protein interaction networks. Nat. Biotechnol. 2007;25:345–352. doi: 10.1038/nbt1289. [DOI] [PubMed] [Google Scholar]
- 27.Schlosser A, Volkmer-Engert R. Volatile polydimethylcyclosiloxanes in the ambient laboratory air identified as source of extreme background signals in nanoelectrospray mass spectrometry. J. Mass Spectrom. 2003;38:523–525. doi: 10.1002/jms.465. [DOI] [PubMed] [Google Scholar]
- 28.Shevchenko A, Chernushevich I, Ens W, Standing KG, Thomson B, Wilm M, Mann M. Rapid ‘de novo’ peptide sequencing by a combination of nanoelectrospray, isotopic labeling and a quadrupole/time-of-flight mass spectrometer. Rapid Commun. Mass Spectrom. 1997;11:1015–1024. doi: 10.1002/(SICI)1097-0231(19970615)11:9<1015::AID-RCM958>3.0.CO;2-H. [DOI] [PubMed] [Google Scholar]
- 29.Loboda AV, Krutchinsky AN, Bromirski M, Ens W, Standing KG. A tandem quadrupole/time-of-flight mass spectrometer with a matrix-assisted laser desorption/ionization source: design and performance. Rapid Commun. Mass Spectrom. 2000;14:1047–1057. doi: 10.1002/1097-0231(20000630)14:12<1047::AID-RCM990>3.0.CO;2-E. [DOI] [PubMed] [Google Scholar]
- 30.Medzihradszky KF, Campbell JM, Baldwin MA, Falick AM, Juhasz P, Vestal ML, Burlingame AL. The characteristics of peptide collision-induced dissociation using a high-performance MALDI-TOF/TOF tandem mass spectrometer. Anal. Chem. 2000;72:552–558. doi: 10.1021/ac990809y. [DOI] [PubMed] [Google Scholar]
- 31.Liska AJ, Shevchenko A. Expanding organismal scope of proteomics: cross-species protein identification by mass spectrometry and its implications. Proteomics. 2003;3:19–28. doi: 10.1002/pmic.200390004. [DOI] [PubMed] [Google Scholar]
- 32.Waridel P, Frank A, Thomas H, Surendranath V, Sunyaev S, Pevzner P, Shevchenko A. Sequence similarity-driven proteomics in organisms with unknown genomes by LC-MS/MS and automated de novo sequencing. Proteomics. 2007;7:2318–2329. doi: 10.1002/pmic.200700003. [DOI] [PubMed] [Google Scholar]
- 33.Katz A, Waridel P, Shevchenko A, Pick U. Salt-induced changes in the plasma membrane proteome of the halotolerant alga Dunaliella salina as revealed by Blue-Native gel electrophoresis and nanoLC-MS/MS analysis. Mol. Cell. Proteomics. 2007;6:1459–1472. doi: 10.1074/mcp.M700002-MCP200. [DOI] [PubMed] [Google Scholar]
- 34.Habermann B, Oegema J, Sunyaev S, Shevchenko A. The power and the limitations of cross-species protein identification by mass spectrometry-driven sequence similarity searches. Mol. Cell. Proteomics. 2004;3:238–249. doi: 10.1074/mcp.M300073-MCP200. [DOI] [PubMed] [Google Scholar]
- 35.Gentzel M, Kocher T, Ponnusamy S, Wilm M. Preprocessing of tandem mass spectrometric data to support automatic protein identification. Proteomics. 2003;3:1597–1610. doi: 10.1002/pmic.200300486. [DOI] [PubMed] [Google Scholar]
- 36.Yates JR, III, Morgan SF, Gatlin CL, Griffin PR, Eng JK. Method to compare collision-induced dissociation spectra of peptides: potential for library searching and subtractive analysis. Anal. Chem. 1998;70:3557–3565. doi: 10.1021/ac980122y. [DOI] [PubMed] [Google Scholar]
- 37.Monigatti F, Berndt P. Algorithm for accurate similarity measurements of peptide mass fingerprints and its application. J. Am. Soc. Mass Spectrom. 2005;16:13–21. doi: 10.1016/j.jasms.2004.09.013. [DOI] [PubMed] [Google Scholar]
- 38.Wan KX, Vidavsky I, Gross ML. Comparing similar spectra: from similarity index to spectral contrast angle. J. Am. Soc. Mass Spectrom. 2002;13:85–88. doi: 10.1016/S1044-0305(01)00327-0. [DOI] [PubMed] [Google Scholar]
- 39.Stein SE, Scott DR. Optimization and testing of mass-spectral library search algorithms for compound identification. J. Am. Soc. Mass Spectrom. 1994;5:859–866. doi: 10.1016/1044-0305(94)87009-8. [DOI] [PubMed] [Google Scholar]
- 40.Craig R, Cortens JC, Fenyo D, Beavis RC. Using annotated peptide mass spectrum libraries for protein identification. J Proteome Res. 2006;5:1843–1849. doi: 10.1021/pr0602085. [DOI] [PubMed] [Google Scholar]
- 41.Lam H, Deutsch EW, Eddes JS, Eng JK, King N, Stein SE, Aebersold R. Development and validation of a spectral library searching method for peptide identification from MS/MS. Proteomics. 2007;7:655–667. doi: 10.1002/pmic.200600625. [DOI] [PubMed] [Google Scholar]
- 42.Gregan J, Riedel CG, Petronczki M, Cipak L, Rumpf C, Poser I, Buchholz F, Mechtler K, Nasmyth K. Tandem affinity purification of functional TAP-tagged proteins from human cells. Nat. Protoc. 2007;2:1145–1151. doi: 10.1038/nprot.2007.172. [DOI] [PMC free article] [PubMed] [Google Scholar]
- 43.Junqueira M, Shevchenko A. Rapid and sensitive gel-free approach to dissect affinity purified protein complexes by nanoLC-MSMS. Proceedings of the 55th ASMS Conference Mass Spectrometry and Allied Topics; Indianapolis, IN. 2007. Abstract WPL-186. [Google Scholar]
- 44.Frank A, Pevzner P. PepNovo: de novo peptide sequencing via probabilistic network modeling. Anal. Chem. 2005;77:964–973. doi: 10.1021/ac048788h. [DOI] [PubMed] [Google Scholar]
- 45.Shevchenko A, Sunyaev S, Liska A, Bork P, Shevchenko A. Nanoelectrospray tandem mass spectrometry and sequence similarity searching for identification of proteins from organisms with unknown genomes. Methods Mol. Biol. 2003;211:221–234. doi: 10.1385/1-59259-342-9:221. [DOI] [PubMed] [Google Scholar]
- 46.Wielsch N, Thomas H, Surendranath V, Waridel P, Frank A, Pevzner P, Shevchenko A. Rapid validation of protein identifications with the borderline statistical confidence via de novo sequencing and MS BLAST searches. J. Proteome Res. 2006;5:2448–2456. doi: 10.1021/pr060200v. [DOI] [PubMed] [Google Scholar]
- 47.Shevchenko A, Chernushevich I, Wilm M, Mann M. De novo peptide sequencing by nanoelectrospray tandem mass spectrometry using triple quadrupole and quadrupole/time-of-flight instruments. Methods Mol. Biol. 2000;146:1–16. doi: 10.1385/1-59259-045-4:1. [DOI] [PubMed] [Google Scholar]
- 48.Forner F, Foster LJ, Toppo S. Mass spectrometry data analysis in the proteomics era. Curr. Bioinf. 2007;2:63–93. [Google Scholar]
- 49.Hernandez P, Muller M, Appel RD. Automated protein identification by tandem mass spectrometry: issues and strategies. Mass Spectrom. Rev. 2006;25:235–254. doi: 10.1002/mas.20068. [DOI] [PubMed] [Google Scholar]
- 50.Palagi PM, Hernandez P, Walther D, Appel RD. Proteome informatics I: bioinformatics tools for processing experimental data. Proteomics. 2006;6:5435–5444. doi: 10.1002/pmic.200600273. [DOI] [PubMed] [Google Scholar]
- 51.Aldous DJ. Probability Approximations via the Poisson Clumping Heuristic. New York: Springer; 1989. p. 45. [Google Scholar]
- 52.Gumbel EJ. Statistics of Extremes. New York: Columbia University Press; 1958. p. 156. [Google Scholar]
- 53.Kendall MG, Stuart A, Ord JK. The Advanced Theory of Statistics. Vol. 1. New York: Oxford University Press; 1977. p. 347. [Google Scholar]
- 54.Shevchenko A, Chernushevich I, Wilm M, Mann M. “De novo” sequencing of peptides recovered from in-gel digested proteins by nanoelectrospray tandem mass spectrometry. Mol. Biotechnol. 2002;20:107–118. doi: 10.1385/mb:20:1:107. [DOI] [PubMed] [Google Scholar]
- 55.Nesvizhskii AI, Roos FF, Grossmann J, Vogelzang M, Eddes JS, Gruissem W, Baginsky S, Aebersold R. Dynamic spectrum quality assessment and iterative computational analysis of shotgun proteomic data: toward more efficient identification of post-translational modifications, sequence polymorphisms, and novel peptides. Mol. Cell. Proteomics. 2006;5:652–670. doi: 10.1074/mcp.M500319-MCP200. [DOI] [PubMed] [Google Scholar]
- 56.Liska AJ, Sunyaev S, Shilov IN, Schaeffer DA, Shevchenko A. Error-tolerant EST database searches by tandem mass spectrometry and MultiTag software. Proteomics. 2005;5:4118–4122. doi: 10.1002/pmic.200401262. [DOI] [PubMed] [Google Scholar]
- 57.Frank A, Tanner S, Bafna V, Pevzner P. Peptide sequence tags for fast database search in mass-spectrometry. J. Proteome Res. 2005;4:1287–1295. doi: 10.1021/pr050011x. [DOI] [PubMed] [Google Scholar]
- 58.Tanner S, Shu H, Frank A, Wang LC, Zandi E, Mumby M, Pevzner PA, Bafna V. InsPecT: identification of posttranslationally modified peptides from tandem mass spectra. Anal. Chem. 2005;77:4626–4639. doi: 10.1021/ac050102d. [DOI] [PubMed] [Google Scholar]
- 59.Tabb DL, Saraf A, Yates JR., III GutenTag: high-throughput sequence tagging via an empirically derived fragmentation model. Anal. Chem. 2003;75:6415–6421. doi: 10.1021/ac0347462. [DOI] [PMC free article] [PubMed] [Google Scholar]
- 60.Charneau S, Junqueira M, Costa CM, Pires DL, Fernandes ES, Bussacos AC, Sousa MV, Ricart CO, Shevchenko A, Teixeira ARL. The saliva proteome of the blood-feeding insect Triatoma infestans is rich in platelet aggregation inhibitors. Int. J. Mass Spectrom. 2007;268:265–276. [Google Scholar]
- 61.Elias JE, Gygi SP. Target-decoy search strategy for increased confidence in large-scale protein identifications by mass spectrometry. Nat. Methods. 2007;4:207–214. doi: 10.1038/nmeth1019. [DOI] [PubMed] [Google Scholar]
- 62.Sauer G, Korner R, Hanisch A, Ries A, Nigg EA, Sillje HH. Proteome analysis of the human mitotic spindle. Mol. Cell. Proteomics. 2005;4:35–43. doi: 10.1074/mcp.M400158-MCP200. [DOI] [PubMed] [Google Scholar]
Associated Data
This section collects any data citations, data availability statements, or supplementary materials included in this article.
Supplementary Materials
Figures of evaluation of the filtering efficiency using Pearson’s correlation and spectral angle approaches; representative diagram of the distribution of MS BLAST hits obtained in searches with the raw and filtered queries; output of the MASCOT search of LC-MS/MS run of in-gel digest of a silver-stained spot before and after EagleEye filtering; tables characterizing EagleEye filtering efficiency of 10 silver-stained spots of plant proteins. This material is available free of charge via the Internet at http://pubs.acs.org.