Abstract
To test the hypothesis that the abnormal ventricular geometry in failing hearts may be accounted for by regionally selective remodeling of myocardial laminae or sheets, we investigated remodeling of the transmural architecture in chronic volume overload induced by an aortocaval shunt. We determined three-dimensional finite deformation at apical and basal sites in left ventricular anterior wall of six dogs with the use of biplane cineradiography of implanted markers. Myocardial strains at end diastole were measured at a failing state referred to control to describe remodeling of myofibers and sheet structures over time. After 9 ± 2 wk (means ± SE) of volume overload, the myocardial volume within the marker sets increased by >20%. At 2 wk, the basal site had myofiber elongation (0.099 ± 0.030; P < 0.05), whereas the apical site did not [P = not significant (NS)]. Sheet shear at the basal site increased progressively toward the final study (0.040 ± 0.003 at 2 wk and 0.054 ± 0.021 at final; both P < 0.05), which contributed to a significant increase in wall thickness at the final study (0.181 ± 0.047; P < 0.05), whereas the apical site did not (P = NS). We conclude that the remodeling of the transmural architecture is regionally heterogeneous in chronic volume overload. The early differences in fiber elongation seem most likely due to a regional gradient in diastolic wall stress, whereas the late differences in wall thickness are most likely related to regional differences in the laminar architecture of the wall. These results suggest that the temporal progression of ventricular remodeling may be anatomically designed at the level of regional laminar architecture.
Keywords: heart failure, fiber, myocardial lamina, finite deformation
There has been a growing interest in the abnormal ventricular geometry resulting from ventricular remodeling as a potential culprit of progressive cardiac dysfunction in chronic heart failure (5, 14). The geometry of the left ventricle (LV) is ellipsoidal in normal hearts, but it becomes spherical as the heart dilates and fails. To obtain a mechanistic understanding of the abnormal ventricular geometry during development of heart failure, it is important to elucidate the progression of ventricular remodeling at the level of microstructures of the wall, such as myofibers (26) and myocardial laminae, or sheets (15).
Chronic volume overload is one of the leading causes of ventricular remodeling and heart failure among patients with valvular regurgitation, congenital heart disease, and arteriovenous shunt. One of the most extensively studied experimental models of chronic volume overload is induced by creating an aortocaval shunt, which is associated with marked fluid retention, circulatory congestion (28), progressive LV dilatation, elevated LV end-diastolic pressures (LVEDP) (20), and eccentric hypertrophy, due to a proportional increase in myocyte length and diameter (10, 11, 17, 18, 22), and the increase in myofiber cross-sectional area accounts for 50% of the ventricular volume increase (6). The remodeling of the extracellular matrix in this model is characterized by an initial activation of matrix metalloproteinases with a reduction of collagen, and later recovery of normal collagen levels (4, 8). The net effect is no significant change in the collagen matrix and interstitium (24, 30), except perhaps an increase in collagen cross-linking (12, 13), which may account for an increase in diastolic stiffness (20).
During development of heart failure, the LV undergoes dynamic changes in geometry that are regionally and temporally heterogeneous. Early changes during the first 2–3 wk after the shunt creation are characterized by a progressive increase in end-diastolic basal dimensions, whereas apical dimensions are maintained (3). During this period, LVEDP progressively increases and reaches a plateau of ~20 mmHg (20). Late changes (6–9 wk) include progressive increases in both basal and apical dimensions (3), but no change in elevated LVEDP (20). The structural basis of these geometric alterations of the LV during development of heart failure is not well understood.
We hypothesized that these geometric alterations in heart failure may be accounted for by regionally selective remodeling of myocardial sheets (15, 26). Specifically, the early changes of LV geometry may be associated with selective remodeling of the sheet structure at the base because early changes are also known to accompany considerable tissue growth orthogonal to the myofiber direction (22). In addition, a progressive increase in the basal dimensions may be related to greater sheet remodeling at the base than the apex. To test these hypotheses, we determined myocardial three-dimensional (3-D) finite deformation at apical and basal sites in the LV anterior wall of dog hearts in vivo during development of volume overload hypertrophy induced by an aortocaval shunt. Transmural myocardial strains at end diastole were measured at a failing state referred to control to describe remodeling in myofiber and sheet structures over the course of chronic volume overload. This allowed us to study geometric changes at the level of myofibers and sheet structures and their significance in geometric remodeling of the failing heart.
MATERIALS AND METHODS
All animal studies were performed according to the National Institutes of Health guidelines for the care and use of laboratory animals in research. All protocols were approved by the Animal Subjects Committee of the University of California, San Diego, which is accredited by the American Association for Accreditation of Laboratory Animal Care.
Experimental protocol overview
Six adult mongrel dogs were instrumented with radiopaque beads under sterile conditions, and after 7–10 days of recovery, a control imaging study was performed. Volume-overload hypertrophy was then induced with the use of an aortocaval shunt, and bead imaging studies were repeated every week thereafter.
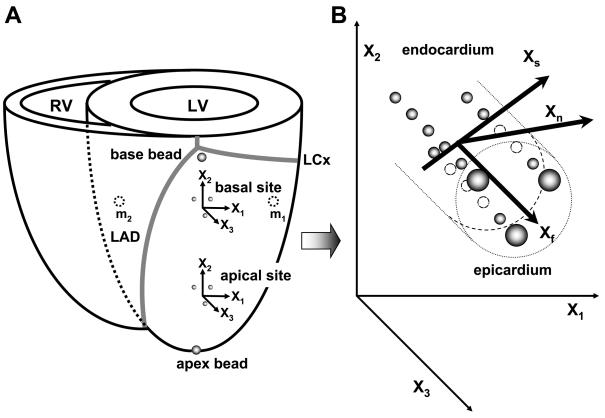
The dogs (21–25 kg) were anesthetized with intravenous thiopental (8–10 mg/kg), intubated, and mechanically ventilated with isoflurane (0.5–2.5%), nitrous oxide (3 l/min), and medical oxygen (3 l/min) to maintain a surgical plane of anesthesia. Under sterile conditions, the heart was exposed through a left thoracotomy at the fourth intercostal space. The surface ECG was recorded throughout the surgery. To provide end points for a LV long axis, 2-mm-diameter gold beads were sutured to the apical dimple (apex bead, Fig. 1A) and on the epicardium at the bifurcation of the left anterior descending and left circumflex coronary arteries (base bead, Fig. 1A). Apex-base length was defined as the distance between the apex and the base beads. To measure 3-D myocardial deformation in each heart, two transmural marker arrays or “bead sets” were placed as described previously (1, 29), approximately one-fourth (basal site) and three-fourth (apical site) of the distance from base to apex measured along the LV long axis within the LV anterior free wall (Fig. 1A). Each bead set consisted of three transmural columns of four to six 0.8-mm-diameter gold beads and a 1.7-mm-diameter surface gold bead above each column. The local epicardial tangent plane defined by the three epicardial surface beads and the LV long axis were used to define a local cardiac coordinate system aligned with the circumferential, longitudinal and radial axes of the LV wall (21). To measure LV diameter in the short axis, two intramyocardial markers were implanted at the level of the basal bead set in the septum and the LV lateral wall (m1 and m2, Fig. 1A). Basal diameter was defined as the distance between m1 and m2. Through a stab wound in the apex, a precalibrated micromanometer (model P6, Konigsberg Instruments; Pasadena, CA) was inserted to monitor LV pressure. A 9-Fr silicone catheter (IntiSilf, Access Technologies; Skokie, IL) was inserted into the left atrium to monitor left atrial pressure, which was used in every imaging study to correct for baseline drifting of the LV micromanometer. The chest was closed, and the animals were allowed to recover for 7–10 days.
Fig. 1.
A: schematic representation of the heart. LV, left ventricle; RV, right ventricle; X1, circumferential axis; X2, longitudinal axis; X3, radial axis; LAD, left anterior descending coronary artery; LCx, left circumflex coronary artery; and m1, m2: intramyocardial markers implanted at the level of the basal bead set in the LV lateral wall (m1) and the septum (m2). B: schematic representation of local fiber-sheet axes. Xf, fiber axis; Xs, sheet axis; and Xn, axis oriented normal to the sheet plane. The Xf, Xs, and Xn axes present a Cartesian system.
Control imaging studies were then performed for each animal. Under sedation with intravenous administration of propofol (5.5–7.0 mg/kg), the dogs were suspended in a sling in a biplane X-ray system (16). The animals were positioned so that all beads were separately visible in both anteroposterior and lateral views of the X-ray system. Synchronous biplane cineradiographic images (125 frames/s) of the bead markers were digitally acquired, as described previously (1). Cineradiographic data were obtained for at least one full respiratory cycle, and data used in the analysis were taken near end expiration to minimize the effects from respiratory variation.
After the control study, an aortocaval shunt was created. Through an abdominal incision, the aorta and inferior vena cava were exposed below the renal arteries, and a 1.0–1.2 cm side-to-side anastomosis was constructed (22, 28) under general anesthesia described above. The abdomen was closed, and intravenous fluid and antibiotics were administered as needed. Patency of the shunt was evidenced by an audible murmur throughout the study.
After the shunt creation, imaging studies described above were repeated every week to assess remodeling of cardiac tissue in a working, functional heart. The dogs were followed for 9 ± 2 wk after construction of the shunt (see results). By 2 wk of volume overload, the heart rate increased and the mean left atrial pressure was usually elevated to at least 15 mmHg. After the final imaging study, the animal was intubated, anesthesized, and mechanically ventilated as described above. To fix each heart in end-diastolic configuration in a controlled manner at a known LVEDP, a median sternotomy was performed to expose the heart, and another imaging study was conducted at the end expiration with LVEDP adjusted by phlebotomy to match the LVEDP in the control study. The animal was then euthanized with pentobarbital sodium following median sternotomy, and the heart was perfusion fixed with 2.5% buffered glutaraldehyde at the LVEDP in the control study (31). Because the heart was fixed at the same LVEDP, fiber, and sheet angles in the fixed hearts were assumed to represent the fiber-sheet structure in the end-diastolic reference configuration of the final study in vivo matched to the LVEDP of the control study (1, 2, 7, 27).
Histology
To avoid the distortional effects of dehydration and embedding, histological measurements were obtained using freshly fixed heart tissue (1, 2, 7, 27). In the transmural block of tissue within the implanted bead set, the mean fiber (α) and sheet angles (β) were determined from epicardium to endocardium at every 1-mm-thick section sliced parallel to the epicardial tangent plane, as described previously (1). Briefly, A transmural rectangular block of tissue in the implanted bead set was carefully removed from the ventricular wall, with the edges of the block cut parallel to the local circumferential, longitudinal, and radial axes of the LV as determined from the same epicardial markers used for the strain analysis. The transmural thickness of the block was measured, and the block was sliced into 1-mm-thick sections parallel to the epicardial tangent plane, forming a series from the epicardium to the endocardium to measure α across the LV wall. α was determined under a dissection microscope with reference to the positive circumferential axis. α was calculated at each transmural depth as described previously (7). Each 1-mm-slice tissue was then embedded with Tissue-Tek OCT compound (Sakura Finetek; Torrance, CA) and quickly frozen in a 2-methybutane bath cooled with dry ice. Multiple serial thin sections (5 μm) perpendicular to the mean fiber direction were made from each slice tissue, transferred to a glass slide, and allowed to desiccate for 10 min. Digital images of the tissue section were acquired at low-power magnification (×20), using a digital camera (Coolpix 990, Nikon; Melville, NY) mounted on a light microscope (Optiphot-2, Nikon). The images were transferred to a Windows-based computer with image processing software (Image J version 1.30 g, NIH). Myocardial laminae, or sheets, were directly visible with no further enhancement of the digital montage. β was measured with reference to the positive radial axis, as reported previously (7). Angle measurements were made for all visible cleavage planes in 3–9 sections to achieve 100~300 measurements per slice tissue, and β was calculated in each 1-mm slice tissue. This process was repeated from the epicardial slice to the endocardial slice to yield transmural distribution of mean sheet angles.
Finite strain analysis
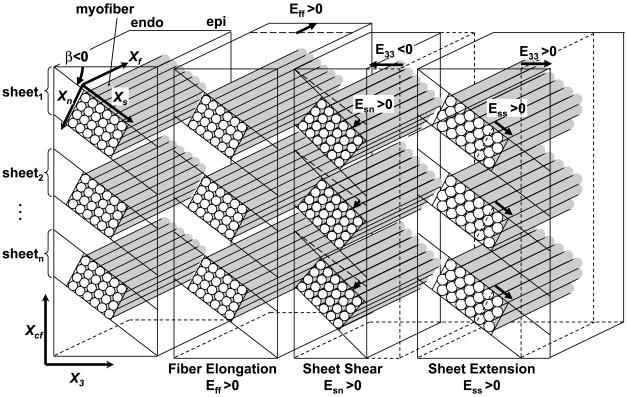
The digital images obtained from the X-ray image intensifiers were spherically corrected to reconstruct the 3-D coordinates of the gold bead markers in each frame (1). Continuous, nonhomogeneous transmural distributions of 3-D finite strains were computed as described previously (1). Six independent finite strains [circumferential (E11), longitudinal (E22), and radial (E33) strains, circumferential-longitudinal shear (E12), longitudinal-radial shear (E23), and circumferential-radial sheer (E13)] were computed in the local cardiac coordinate system of circumferential, longitudinal, and radial axes (X1, X2, X3), which were subsequently used to compute another set of six finite strains [fiber strain (Eff), sheet strain (Ess), strain normal to the sheet plane (Enn), fiber-sheet shear (Efs), sheet shear (Esn), and fiber-normal shear (Efn)] in the local fiber-sheet coordinate system (Xf, Xs, Xn) through an orthogonal transformation to convert the strain tensor using the values of α and β at each depth (7). The local fiber-sheet coordinate system defines the myofiber axis (Xf), the sheet axis (Xs) that lies within the sheet plane and is perpendicular to Xf, and the orthogonal Xn axis oriented normal to the sheet plane. In layers where two separate sheet populations were present (see results), the mode of the dominant sheet population was used to calculate sheet strains. The fiber and sheet angles at the control, 2-wk, and final studies were calculated from deformation data with the end-diastolic frame of the respective study as a deformed configuration and the end-diastolic frame of the final study with matched LVEDP as the reference state, using the formula described previously (27). In each set of finite strains, three normal strain components reflect myocardial stretch or shortening along each axis, and three shear strains represent angle changes between pairs of the initially orthogonal coordinate axes. Examples of fiber-sheet remodeling strains in a simple ventricular wall model with radial laminae are schematically shown in Fig. 2 (7, 27). Remodeling strains were calculated with the end diastole of the control study as the reference configuration and the end diastole of the 2-wk and final studies as the deformed state. Remodeling strains describe myocardial deformation over time with respect to an undeformed reference configuration at the time of the control study (19, 27).
Fig. 2.
Schematic representation of fiber-sheet remodeling strains. Each cylinder represents a myofiber. Myofibers are organized into laminar “sheets,” which are approximately four cells thick and roughly stacked from apex to base (15). Sheet angle (β) is measured with reference to the positive X3, with a positive angle defined as rotation toward the positive cross-fiber axis (Xcf). Therefore, the sheet angle is negative in this diagram (β < 0). Positive Eff, Esn, and Ess represent fiber elongation, sheet shear, and sheet extension, respectively. Because the sheet angle is negative (β < 0), a positive sheet shear (Esn > 0) is associated with reduction in radial remodeling strain or wall thinning (E33 < 0). Sheet extension (Ess > 0) may be accounted for by myofiber rearrangement within the sheet plane, or interdigitation, in addition to an increase in myocyte diameter (7), and is associated with increase in radial remodeling strain, or wall thickening (E33 > 0). Endo, endocardium; epi, epicardium.
End diastole was defined at the time of the peak of the ECG R-wave. Remodeling strains were calculated at every 10% depth from the epicardial surface to the deepest bead in every study. Because previous studies have shown that myofiber and cross-fiber remodeling strains in chronic volume overload are transmurally uniform (22), remodeling strains are presented at transmural averages (10% to 90% wall depth).
Statistical analysis
Values are means ± SE unless otherwise specified. A paired t-test was used to compare hemodynamic parameters and remodeling strains. Two-factor repeated-measures ANOVA was used for the transmural distributions of the fiber and sheet orientation, with respect to the effects of volume overload hypertrophy and wall depth. Statistics were performed using SigmaStat 3.0 (SPSS; Chicago, IL). Statistical significance was accepted at P < 0.05.
RESULTS
To compare early and late changes in ventricular geometry associated with chronic volume overload, remodeling data were presented at 2 wk after creation of the shunt and at the final study. By the time of the final study, all dogs (n = 6) developed clinical signs of heart failure, including ascites, edema of extremities, pulmonary congestion, elevated LVEDP, and increased LV volume estimated from the apex-base length and basal diameter.
Hemodynamic and geometric parameters
Hemodynamic parameters are summarized in Table 1. The apical and basal measurement sites were located 68 ± 4% and 24 ± 2%, respectively, of the distance from base to apex along the LV long axis, in a region of the anterior LV free wall 1~2 cm septal of the anterolateral papillary muscle. Mean wall thickness at both measurement sites was 11 ± 1 mm, and the deepest bead at the apical and basal sites was located at 97 ± 3 and 92 ± 5% wall depth from the epicardial surface, respectively. The dogs were followed for 9 ± 2 wk after construction of the aortocaval shunt, and over this period of time there was no significant increase in body weight [22.3 ± 0.6 vs. 22.5 ± 0.8 kg, P = not significant (NS)]. However, volume changes calculated within the bead sets indicated a 21 and 24% increase in the myocardial tissue volume at the apical and basal sites, respectively. At the final study, heart weight was 280 ± 31 g, LV weight was 171 ± 18 g, and the ratio of LV weight (g) to body weight (kg) (LV/BW) was 7.7 ± 0.9 g/kg, which is substantially greater than the normal canine LV/BW ratio (4.6 ± 0.7 g/kg; n = 38) measured previously in our laboratory (22).
Table 1.
Hemodynamic parameters
| Control | 2 Wk | Final | |
|---|---|---|---|
| Heart rate, beats/min | 105±9 | 115±6 | 130±12* |
| LVEDP, mmHg | 5±2 | 19±5* | 21±4* |
| LVPmax, mmHg | 113±7 | 112±4 | 117±5 |
| dP/dtmax, mmHg/s | 2,476±203 | 2,237±178 | 2,330±216 |
| dP/dtmin, mmHg/s | −2,466±190 | −1,869±108* | −2,076±166* |
| Apex-base length, mm | 76±2 | 77±2 | 81±3 |
| Basal diameter, mm | 45±2 | 49±2* | 54±4*† |
Values are means ± SE; n = 6 dogs. LVEDP, left ventricular (LV) end-diastolic pressure; LVPmax, maximum LV pressure; dP/dtmax and dP/dtmin, peak positive and negative developed pressure over time, respectively; apex-base length, the distance between the apex and the base beads; basal diameter, the distance between the two intramyocardial markers, m1 and m2.
P < 0.05 vs. control;
P < 0.05 vs. 2 wk.
Transmural fiber and sheet angles
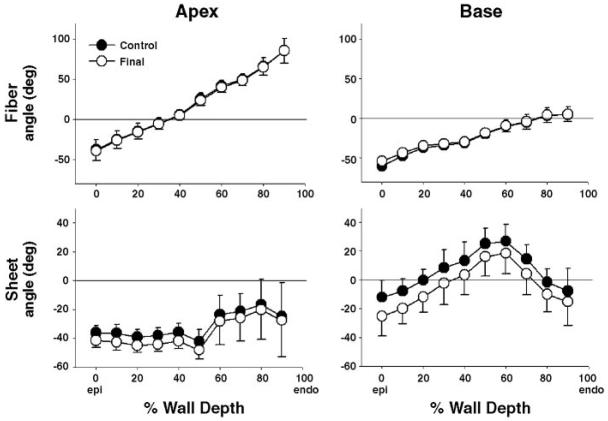
The fiber and sheet angles at the time of the control study and the final study are shown in Fig. 3. The fiber and sheet angles at the control study were calculated from the deformation data and the fiber and sheet angles at the final study, as described above. Both fiber and sheet angles changed from the control to the final study, but the neither change was statistically signifi-cant (P = NS). The change in fiber angles from the control to the final study was very small (<2°), whereas the change in sheet angles was −5.1 ± 2.8° and −10.1 ± 4.2° at apical and basal sites, respectively (transmural average, 0–90% wall depth).
Fig. 3.
Transmural fiber and sheet angles. Values are means ± SE (n = 6). Fiber angles were transmurally linear in both apex and base sites, however, regionally variable. Sheet angles were transmurally and regionally variable in both sites. Neither fiber nor sheet angles significantly changed from the control to the final study (P = NS).
Although the fiber angles were almost linear across the wall in both the apical and basal sites, regional variations were noted. The mean fiber angles in the apical site ranged transmurally from −40° to +90° with the circumferential fiber direction at 30~40% wall depth, whereas the basal site showed transmural fiber angles ranging from −60° to +10° with the circumferential fiber direction at 70~80% wall depth in the basal site. The sheet angles were heterogeneous both regionally and transmurally. In the apical site, the mean sheet angles were predominantly negative with relatively smaller variations across the wall (−40°~−20°). In the basal site, however, the mean sheet angles were negative in the outer-third wall, abruptly became positive in the mid-third wall and returned to negative in the inner third wall (Fig. 3). In transition between negative and positive sheet angles, two separate sheet populations usually coexisted (1), but one population was always more dominant than the other. Therefore, the mode of the dominant sheet population was assumed to represent the sheet angle in respective layers and was used to calculate sheet-remodeling strains.
Remodeling of fiber and sheet structures
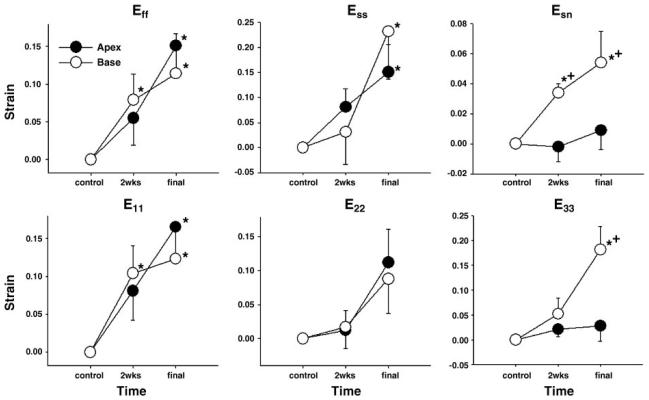
Myofiber and sheet structures showed temporally and regionally heterogeneous remodeling over time. Fiber remodeling strain (Eff) at the apical site was not different from control at 2 wk (0.055 ± 0.036, P = NS), but substantial myofiber elongation was observed at the final study (0.151 ± 0.041, P < 0.05) (Fig. 4). In contrast, Eff at the basal site indicated progressive myofiber elongation throughout the study period (0.099 ± 0.030 at 2 wk and 0.114 ± 0.053 at final, both P < 0.05). A similar pattern was observed in E11, which implies that an increase in myofiber length is translated to circumferential stretch and hence an increase in cross-sectional diameter of the LV. Although E22 increased in both basal and apical sites, neither increase was statistically significant (P = NS). Ess did not show significant remodeling at 2 wk in either the basal (0.053 ± 0.069, P = NS) or the apical sites (0.081 ± 0.036, P = NS), but substantially increased in both sites by the final study (0.232 ± 0.095 and 0.151 ± 0.055, respectively; both P < 0.05). Esn at the basal site increased progressively toward the final study (0.040 ± 0.003 at 2 wk and 0.054 ± 0.021 at final, both P < 0.05). Esn at the apical site slightly decreased at 2 wk (−0.002 ± 0.010), and increased by the final study (0.009 ± 0.013), but both changes were not statistically significant (P = NS). Radial E33, or wall thickening, was not apparent at 2 wk in either apex (0.021 ± 0.014; P = NS) or base (0.036 ± 0.033; P = NS), and significantly increased only in base at the final study (0.181 ± 0.047; P < 0.05) but not in apex (0.028 ± 0.031; P = NS). Both Esn and E33 at the basal site were significantly greater than those of the apical sites at the final study (P < 0.05).
Fig. 4.
Time-dependent remodeling of myofiber and sheet structures. Values are means ± SE (n = 6). E11, circumferential strain; E22, longitudinal strain; and E33, radial strain. *P < 0.05 vs. 0; +P < 0.05 vs. apex.
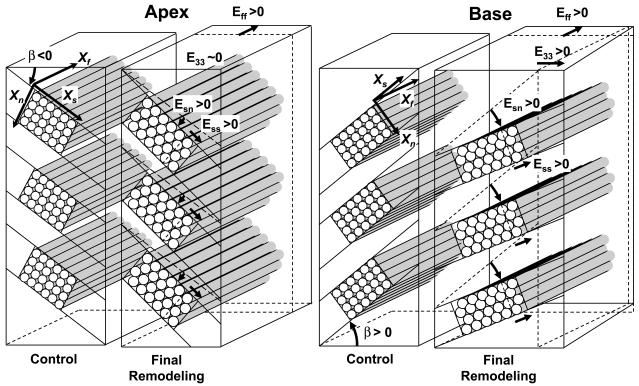
These remodeling changes in fiber and sheet structures at the final study are schematically shown in Fig. 5 to visually illustrate the important relationship between the initial sheet angle and the direction of the remodeling. At the apical site, because the initial sheet angle was predominantly negative (β < 0, Fig. 3), a positive remodeling sheet shear (Esn > 0) is associated with a decrease in E33, or wall thinning (Fig. 5). However, a significant remodeling sheet extension (Ess > 0) occurs at the same time, which is associated with an increase in E33, or wall thickening. The net effect is no significant change in E33 or wall thickness (E33 ~ 0). At the basal site, in contrast, the initial sheet angle is predominantly positive (β > 0, Fig. 3), therefore a positive remodeling sheet shear (Esn > 0) is associated with wall thickening (E33 > 0). Because remodeling sheet extension is also associated with increase in E33, the net effect is significant increase in wall thickness (E33 > 0, Fig. 4). There was no significant remodeling in Enn, Efs, or Efn over time (all P = NS).
Fig. 5.
Schematic account of fiber-sheet remodeling from Fig. 4. Apex: because the initial sheet angle is predominantly negative (β < 0), a positive sheet shear (Esn > 0) is associated with reduction in radial strain (E33 < 0), or wall thinning. Sheet extension (Ess > 0) is associated with increase in radial strain (E33 > 0), or wall thickening. The net effect is no change in wall thickness (E33 ~ 0). Base: initial sheet angle is predominantly positive (β > 0); therefore, a positive sheet shear (Esn > 0) is associated with increase in radial strain (E33 > 0), or wall thickening. Because sheet extension is also associated with increase in radial strain, the net effect is significant increase in wall thickness (E33 > 0).
DISCUSSION
The present study was designed to address the role of myofiber and sheet structures in the abnormal ventricular geometry during development of heart failure due to chronic volume overload. Our results indicate regionally heterogeneous remodeling of the ventricular wall. The key experimental findings are a marked regional variation in fiber elongation at an early phase, and in wall thickening after many weeks of volume overload (Figs. 3 and 4). The early differences in fiber elongation seem most likely due to a regional gradient in diastolic wall stress, whereas the late differences in wall thickness are most likely related to regional differences in the radially oriented laminar architecture.
Regional remodeling and diastolic wall stress
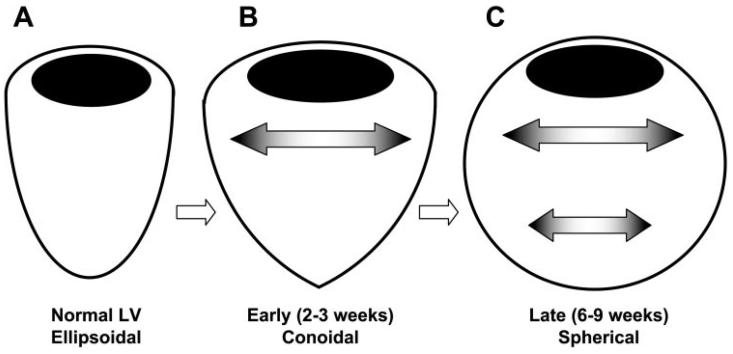
Although the stimulus for chronic volume overload hypertrophy, including changes in diastolic and systolic stress or strain, appears to be transmurally constant (22), the rate of LV dilation is regionally variable. Our result that the increases in myofiber and circumferential length occurred earlier at the basal site than the apical site (Fig. 4) supports the finding by Badke and Covell (3) that LV dimension increases earlier in the basal than apical site in chronic volume overload (3), implying that the LV assumes a conoidal geometry in transition from an ellipsoidal geometry of a normal heart to a spherical geometry of a failing heart (Fig. 6). In addition to myofiber elongation, sheet shear remodeling was also significantly greater at the base than the apex (Fig. 4). These findings indicate that the basal site is subject to a greater stimulus of remodeling over time than the apical site, and a potential source of such a regionally differential stimulus is the ventricular wall stress. The base has the greater cross-sectional radius of curvature, and therefore, the higher wall stress than the apex (Laplace's law). Therefore, it could be speculated that the diastolic wall stress of the respective region is one of the primary determinants of regional ventricular remodeling at the level of myofiber and sheet structures (Fig. 6). However, the present study does not provide data to support the speculation, and further study is required.
Fig. 6.
Time-dependent changes in LV geometry in chronic volume overload. A: normal LV geometry is ellipsoidal. B: during the early period (2–3 wk) of chronic volume overload, LV geometry becomes conoidal due to increases in basal dimensions. C: LV geometry in the late period (6–9 wk) becomes spherical due to increases in both apical and basal dimensions.
Regional remodeling and laminar architecture
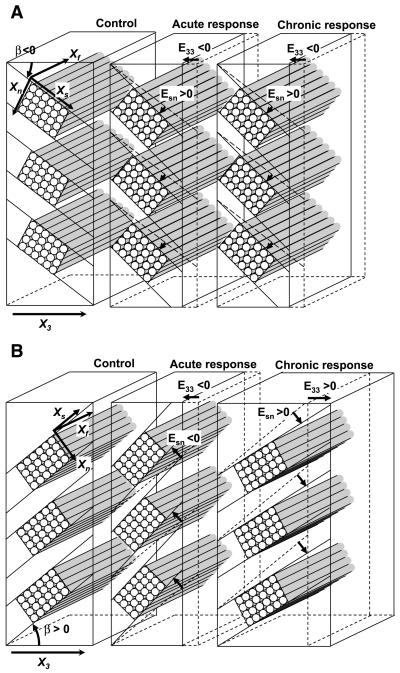
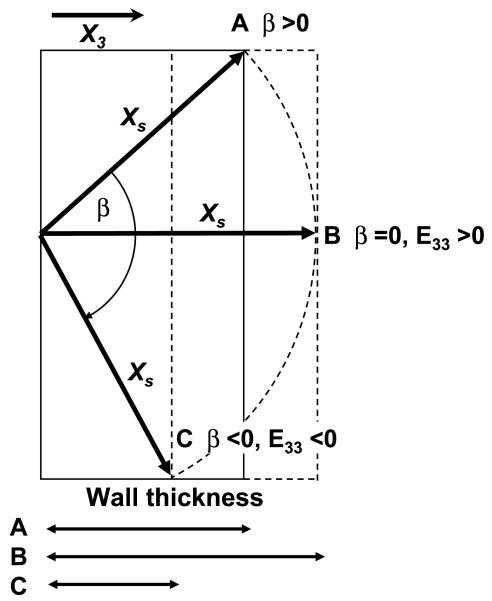
Although the laminar architecture of the myocardium has been recognized for more than 60 yr (9), Spotnitz et al. (25) were the first to point out that it undergoes dynamic structural changes in response to acute changes in ventricular volume. Our results suggest that the laminar architecture also experiences a marked structural remodeling in chronic volume load; however, the response to volume load in acute and chronic settings appears to be distinctively different. Acute volume loading progressively increases the magnitude of end-diastolic sheet angles, making the sheets more oblique to the radial direction (Fig. 7, A and B) (27). Whether the initial sheet angle is positive (β > 0) or negative (β < 0), sheet shear occurs in the direction of wall thinning (E33 < 0). Sheet shear is positive (Esn > 0) when the initial sheet angle is negative (β < 0) (Fig. 7A), whereas sheet shear is negative (Esn <0) when the initial sheet angle is positive (β > 0) (Fig. 7B). In the present study, we found that chronic volume loading induced positive sheet shear remodeling (Esn > 0) regardless of the initial sheet angle, and this is consistent with the transmurally uniform decrease in sheet angles over the study period at both measurement sites (Fig. 3). When the initial sheet angle is negative (β < 0), a positive sheet shear occurs in the direction to decrease wall thickness (E33 < 0) (Fig. 7A). Conversely, when the initial sheet angle is positive (β > 0), a positive sheet shear occurs in the direction to increase wall thickness (E33 > 0) (Fig. 7B). Therefore, the initial sheet angle appears to determine the direction of radial remodeling, which suggests that the temporal progression of ventricular remodeling may be anatomically designed at the sheet level (Fig. 8). A myocardial wall with a positive initial sheet angle thickens first and then thins, whereas a region with a negative initial sheet angle simply thins over time. A positive sheet angle may provide a reserve to enable temporary adaptive hypertrophy. Over time, the myocardial wall of any parts will eventually thin, resulting in a phenotype of dilated cardiomyopathy. It would be interesting to speculate that all sheet angles will eventually become negative and radially oblique in end-stage heart failure. At that point, due to a large obliquity of the sheet angle to the radial axis, sheet extension cannot provide an effective contribution to systolic wall thickening.
Fig. 7.
Comparison of Esn in acute vs. chronic volume loading. A: negative sheet angle (β < 0): In both acute and chronic responses to volume loading, sheet shear remodeling occurs in the positive direction (Esn > 0), which is associated with a decrease in radial remodeling strain, or wall thinning (E33 < 0). B: positive sheet angle (β > 0): In acute volume loading, similar to the case when the sheet angle is negative, sheet shear remodeling occurs in the negative direction (Esn < 0), which is associated with wall thinning (E33 < 0). In contrast, in chronic volume loading, sheet shear remodeling occurs in the positive direction (Esn > 0), which is associated with an increase in radial remodeling strain, or wall thickening (E33 < 0). Data for acute volume loading are based on Takayama et al. (27). Only sheet shear changes are represented in this diagram.
Fig. 8.
Sheet angle change and radial remodeling. This diagram illustrates the relationship between the initial sheet angle and radial remodeling in a case of positive initial sheet angle. As the sheet angle decreases from positive (A) to zero (B), radial remodeling increases and the wall thickens (E33 > 0). When the sheet angle becomes negative (C), a decrease in the sheet angle is associated with a decrease in radial remodeling and the wall thins (E33 < 0). Only angle changes are represented in this diagram.
Limitations
The major limitation of the present study is that we measured the fiber and sheet angles at only one configuration in each animal in the fixed heart and calculated angle changes based on deformation data. Although the equations transforming strains from cardiac to fiber and sheet coordinates are exact (27), errors in measurement of strains (the spatial resolution of the biplane X-ray system is ~0.02 mm) or transposing the anatomic reference system from microscopic measurements to the cardiac coordinate system in vivo may have been a source of variation. In addition, we assumed a structural model for the myocardium that is based on the average fiber angle and the mode of the dominant sheet population, and we did not take into account the dispersion of both fiber and sheet direction at each site. Our data describe remodeling of myofibers and sheet structures at the two sites in the LV anterior wall in 10–90% wall depth. Regional variations should be taken into consideration when these results are extrapolated to other regions of the LV, such as the lateral posterior wall and the septum.
In conclusion, we demonstrate that the remodeling of the transmural architecture is regionally heterogeneous in chronic volume overload. The more pronounced remodeling in the basal than apical regions suggests that one of the primary stimuli for the remodeling is diastolic wall stress. The initial sheet angle determines the direction of radial remodeling. These results suggest that the temporal progression of ventricular remodeling may be anatomically designed at the regional laminar architecture.
ACKNOWLEDGMENTS
We thank Rish Pavelec and Rachel Alexander for excellent managerial and surgical assistance.
GRANTS
This work was supported by National Heart, Lung, and Blood Institute Grants HL-32583 (to J. W. Covell). H. Ashikaga is a recipient of the American Heart Association Postdoctoral Fellowship (Western States Affiliate).
REFERENCES
- 1.Ashikaga H, Criscione JC, Omens JH, Covell JW, Ingels NB., Jr. Transmural left ventricular mechanics underlying torsional recoil during relaxation. Am J Physiol Heart Circ Physiol. 2004;286:H640–H647. doi: 10.1152/ajpheart.00575.2003. [DOI] [PMC free article] [PubMed] [Google Scholar]
- 2.Ashikaga H, Omens JH, Ingels NB, Jr, Covell JW. Transmural mechanics at a left ventricular epicardial pacing site. Am J Physiol Heart Circ Physiol. 2004;286:H2401–H2407. doi: 10.1152/ajpheart.01013.2003. [DOI] [PMC free article] [PubMed] [Google Scholar]
- 3.Badke FR, Covell JW. Early changes in left ventricular regional dimensions and function during chronic volume overloading in the conscious dog. Circ Res. 1979;45:420–428. doi: 10.1161/01.res.45.3.420. [DOI] [PubMed] [Google Scholar]
- 4.Brower GL, Chancey AL, Thanigaraj S, Matsubara BB, Janicki JS. Cause and effect relationship between myocardial mast cell number and matrix metalloproteinase activity. Am J Physiol Heart Circ Physiol. 2002;283:H518–H525. doi: 10.1152/ajpheart.00218.2000. [DOI] [PubMed] [Google Scholar]
- 5.Buckberg GD. National Heart, Lung and Blood Institute Workshop. Bethesda, MD: 2002. Form and function: new views on development, diseases and therapies for the heart. [Google Scholar]
- 6.Chen Y, Torry RJ, Baumbach GL, Tomanek RJ. Proportional arteriolar growth accompanies cardiac hypertrophy induced by volume overload. Am J Physiol Heart Circ Physiol. 1994;267:H2132–H2137. doi: 10.1152/ajpheart.1994.267.6.H2132. [DOI] [PubMed] [Google Scholar]
- 7.Costa KD, Takayama Y, McCulloch AD, Covell JW. Laminar fiber architecture and three-dimensional systolic mechanics in canine ventricular myocardium. Am J Physiol Heart Circ Physiol. 1999;276:H595–H607. doi: 10.1152/ajpheart.1999.276.2.H595. [DOI] [PubMed] [Google Scholar]
- 8.Dolgilevich SM, Siri FM, Atlas SA, Eng C. Changes in collagenase and collagen gene expression after induction of aortocaval fistula in rats. Am J Physiol Heart Circ Physiol. 2001;281:H207–H214. doi: 10.1152/ajpheart.2001.281.1.H207. [DOI] [PubMed] [Google Scholar]
- 9.Feneis H. Das Gefuge des Herzmuskels bei Systole und Diastole. Morphologisches Jahrbuch. 1943;89:371. [Google Scholar]
- 10.Gerdes AM. Cardiac myocyte remodeling in hypertrophy and progression to failure. J Card Fail. 2002;8:S264–S268. doi: 10.1054/jcaf.2002.129280. [DOI] [PubMed] [Google Scholar]
- 11.Gerdes AM, Campbell SE, Hilbelink DR. Structural remodeling of cardiac myocytes in rats with arteriovenous fistulas. Lab Invest. 1988;59:857–861. [PubMed] [Google Scholar]
- 12.Herrmann KL, McCulloch AD, Omens JH. Glycated collagen cross-linking alters cardiac mechanics in volume-overload hypertrophy. Am J Physiol Heart Circ Physiol. 2003;284:H1277–H1284. doi: 10.1152/ajpheart.00168.2002. [DOI] [PMC free article] [PubMed] [Google Scholar]
- 13.Iimoto DS, Covell JW, Harper E. Increase in cross-linking of type I and type III collagens associated with volume-overload hypertrophy. Circ Res. 1988;63:399–408. doi: 10.1161/01.res.63.2.399. [DOI] [PubMed] [Google Scholar]
- 14.Joyce D, Loebe M, Noon GP, McRee S, Southard R, Thompson L, Skrabal C, Youker K, Torre-Amione G. Revascularization and ventricular restoration in patients with ischemic heart failure: the STICH trial. Curr Opin Cardiol. 2003;18:454–457. doi: 10.1097/00001573-200311000-00006. [DOI] [PubMed] [Google Scholar]
- 15.LeGrice IJ, Smaill BH, Chai LZ, Edgar SG, Gavin JB, Hunter PJ. Laminar structure of the heart: ventricular myocyte arrangement and connective tissue architecture in the dog. Am J Physiol Heart Circ Physiol. 1995;269:H571–H582. doi: 10.1152/ajpheart.1995.269.2.H571. [DOI] [PubMed] [Google Scholar]
- 16.LeGrice IJ, Takayama Y, Holmes JW, Covell JW. Impaired subendocardial function in tachycardia-induced cardiac failure. Am J Physiol Heart Circ Physiol. 1995;268:H1788–H1794. doi: 10.1152/ajpheart.1995.268.5.H1788. [DOI] [PubMed] [Google Scholar]
- 17.Liu Z, Hilbelink DR, Crockett WB, Gerdes AM. Regional changes in hemodynamics and cardiac myocyte size in rats with aortocaval fistulas. 1. Developing and established hypertrophy. Circ Res. 1991;69:52–58. doi: 10.1161/01.res.69.1.52. [DOI] [PubMed] [Google Scholar]
- 18.Liu Z, Hilbelink DR, Gerdes AM. Regional changes in hemodynamics and cardiac myocyte size in rats with aortocaval fistulas. 2. Long-term effects. Circ Res. 1991;69:59–65. doi: 10.1161/01.res.69.1.59. [DOI] [PubMed] [Google Scholar]
- 19.Mazhari R, Omens JH, Covell JW, McCulloch AD. Structural basis of regional dysfunction in acutely ischemic myocardium. Cardiovasc Res. 2000;47:284–293. doi: 10.1016/s0008-6363(00)00089-4. [DOI] [PubMed] [Google Scholar]
- 20.McCullagh WH, Covell JW, Ross J., Jr Left ventricular dilatation and diastolic compliance changes during chronic volume overloading. Circulation. 1972;45:943–951. doi: 10.1161/01.cir.45.5.943. [DOI] [PubMed] [Google Scholar]
- 21.Meier GD, Ziskin MC, Santamore WP, Bove AA. Kinematics of the beating heart. IEEE Trans Biomed Eng. 1980;27:319–329. doi: 10.1109/TBME.1980.326740. [DOI] [PubMed] [Google Scholar]
- 22.Omens JH, Covell JW. Transmural distribution of myocardial tissue growth induced by volume-overload hypertrophy in the dog. Circulation. 1991;84:1235–1245. doi: 10.1161/01.cir.84.3.1235. [DOI] [PubMed] [Google Scholar]
- 23.Papadimitriou JM, Hopkins BE, Taylor RR. Regression of left ventricular dilation and hypertrophy after removal of volume overload. Morphological and ultrastructural study. Circ Res. 1974;35:127–135. doi: 10.1161/01.res.35.1.127. [DOI] [PubMed] [Google Scholar]
- 24.Salzmann JL, Michel JB, Bruneval P, Ossondo Nlom M, Barres DR, Camilleri JP. Automated image analysis of myocardial collagen pattern in pressure and volume overload in rat cardiac hypertrophy. Anal Quant Cytol Histol. 1986;8:326–332. [PubMed] [Google Scholar]
- 25.Spotnitz HM, Spotnitz WD, Cottrell TS, Spiro D, Sonnenblick EH. Cellular basis for volume related wall thickness changes in the rat left ventricle. J Mol Cell Cardiol. 1974;6:317–331. doi: 10.1016/0022-2828(74)90074-1. [DOI] [PubMed] [Google Scholar]
- 26.Streeter DD, Jr, Spotnitz HM, Patel DP, Ross J, Jr, Sonnenblick EH. Fiber orientation in the canine left ventricle during diastole and systole. Circ Res. 1969;24:339–347. doi: 10.1161/01.res.24.3.339. [DOI] [PubMed] [Google Scholar]
- 27.Takayama Y, Costa KD, Covell JW. Contribution of laminar myofiber architecture to load-dependent changes in mechanics of LV myocardium. Am J Physiol Heart Circ Physiol. 2002;282:H1510–H1520. doi: 10.1152/ajpheart.00261.2001. [DOI] [PubMed] [Google Scholar]
- 28.Taylor RR, Covell JW, Ross JJ. Left ventricular function in experimental aorto-caval fistula with circulatory congestion and fluid retention. J Clin Invest. 1968;47:1333–1342. doi: 10.1172/JCI105825. [DOI] [PMC free article] [PubMed] [Google Scholar]
- 29.Waldman LK, Fung YC, Covell JW. Transmural myocardial deformation in the canine left ventricle. Normal in vivo three-dimensional finite strains. Circ Res. 1985;57:152–163. doi: 10.1161/01.res.57.1.152. [DOI] [PubMed] [Google Scholar]
- 30.Weber KT, Pick R, Silver MA, Moe GW, Janicki JS, Zucker IH, Armstrong PW. Fibrillar collagen and remodeling of dilated canine left ventricle. Circulation. 1990;82:1387–1401. doi: 10.1161/01.cir.82.4.1387. [DOI] [PubMed] [Google Scholar]
- 31.Yoran C, Covell JW, Ross J., Jr Rapid fixation of the left ventricle: continuous angiographic and dynamic recordings. J Appl Physiol. 1973;35:155–157. doi: 10.1152/jappl.1973.35.1.155. [DOI] [PubMed] [Google Scholar]


