Abstract
Interferons (IFNs) are widely used in therapy for viral, neoplastic and inflammatory disorders, but clinical response varies among patients. The biological basis for variable clinical response is not known. We determined the primary molecular response to IFN-beta (IFN-β) injections in 35 treatment-naïve multiple sclerosis (MS) patients using a customized cDNA macroarray with 186 interferon-stimulated genes (ISGs). Our results revealed striking inter-individual heterogeneity, both in the magnitude as well as the nature of the primary molecular response to IFN-β injections. Despite marked between-subject variability in the molecular response, responses within individual subjects were stable over a six-month interval. Our data suggest that clinical response to IFN-β therapy for MS differs among patients because of qualitative rather than quantitative variability in the primary molecular response to the drug.
Keywords: Interferon-β, inflammatory, multiple sclerosis
Introduction
Gene expression analysis is considered highly promising for the identification of biomarkers for predictive management of disease. It is hoped that specific patterns of gene expression can be used to characterize different types of disease or response to therapy.
Multiple Sclerosis (MS) is an inflammatory neurodegenerative disease of unknown etiology. Biochemical tests for response to treatment are entirely lacking. Recombinant IFN-β was found efficacious based on empirical clinical trials.1 The trials were not based on detailed understanding of MS pathogenesis, or of the likely mechanisms of action exerted by IFN-β. Nevertheless, IFN-β was shown to reduce relapses, new MRI lesions, and disability progression, and is now standard therapy for patients with relapsing remitting MS. Despite worldwide use of IFN-β for MS, molecular mechanisms related to clinical benefits and toxicity are not known.
Gene expression studies in MS using microarrays have identified potential biomarkers of IFN-β response, but none of these have been validated across studies.2 A major problem with studies on gene expression in this field has been an inability to compare results because of variations in time of blood draw after injection with IFN-β, different doses, routes of administration, preparations of recombinant IFN-β, and variations in MS disease activity, severity, and duration.3–7
Biological effects of IFNs are initiated by transcriptional induction of interferon-stimulated genes (ISGs).8,9 High-density microarrays have been used to identify genes induced by IFNs.10–12 We selected 162 IFN-β-inducible genes for evaluation, using ex-vivo blood samples of treatment-naïve MS patients before and after injection with IFN-β. We developed a customized cDNA macroarray assay for detecting ISG expression which is reproducible, convenient, sensitive and quantitative.13
We propose the hypothesis that the primary molecular responses to IFN-β injections mediate beneficial and deleterious clinical responses to treatment in MS patients. Variability in clinical response and side effects suggests that there will be differences in ISG expression between individuals. Our hypothesis would be testable only if individuals demonstrated stable ISG signatures over time. Preliminary studies have documented individual variability in the expression of ISGs, but no prior studies have examined the stability of this response.14,15 We reasoned that relating patterns of ISG induction to therapeutic response could lead to biomarkers for the therapeutic response, and might also provide insight into MS pathogenesis.
Here, we report optimization of a macroarray assay for longitudinal studies of ISG induction in ex-vivo blood samples from treatment-naïve MS patients before and after IFN-β injections using a standard dose, route and IFN-β preparation. We developed a novel bioinformatics methodology for data analysis and compared individual ISG responses at the first injection and after 6 months of treatment. We found marked differences in the number of ISGs induced, in their identity and in the magnitude of induction. However, ISG expression signatures were stable over six months of weekly injections for the large majority of patients. Some patients showed identifiable causes for ISG expression inconsistency, including intercurrent viral infection, or neutralizing IFN antibodies. Our results establish conditions for identifying biomarkers of the clinical response to IFN-β in MS. We also propose an overall strategy for monitoring expression signatures in response to transcriptional regulatory therapies for poorly-understood chronic disorders.
Materials and Methods
Sample Collection and Patient Information
The study was approved by the Institutional Review Board of the Cleveland Clinic and written informed consent was obtained from all individuals enrolled in the study. Thirty-five patients with relapsing remitting MS (RRMS) or clinically isolated syndromes (CIS, the first clinical episode of RR-MS) who were naïve to treatment were analyzed at the time of their first IFN-β injection and after six months of weekly injections. For ISG analysis, blood (20 ml) was collected directly into PAXgene™ tubes according to manufacturer’s instructions 12 h before, and 12 h after an intramuscular injection of 6 million IU of recombinant IFN-β-1a (Avonex) at first injection (baseline) and after six months of treatment with IFN-β. Patients had gadolinium enhanced MRI brain scans at baseline and after six months. Expanded Disability Status Scale, Multiple Sclerosis Functional Composite, cell count, differential and liver enzymes was done at baseline and six months. Neutralizing antibody analysis was done at 6 months. The research nurse also collected information on relapses, viral infections and adverse events known to be associated with IFN-β therapy. Patients were asked to rate the presence and severity of flu-like symptoms, muscle aches, chills, fatigue, headache and loss of strength on a 11 point Likert scale, ranging from 0 (no side effect at all) to 10 (worst you can imagine) via structured telephone interview 2–3 days after the baseline, 3 month, and 6 month injections.
Patient characteristics are shown in Table 1. The subjects averaged 37 years of age, 85% were Caucasians, females comprised 65% of the group, 78% had RR-MS, and 22% had CIS together with multiple MRI brain lesions.
TABLE 1.
Patient Characteristics
| Number of subjects | 35 |
| Females/Males | 23/12 |
| Whites/Blacks | 30/5 |
| Mean age, Male/Female | 34/38 |
| MS type, RR/CIS | 27/8 |
| Mean baseline EDSS (±SD) | 2.0 ± 0.9 |
| Mean baseline MSFC (±SD) | 0.2 ± 0.4 |
RR-Relapsing-Remitting; CIS-Clinically Isolated Syndrome; EDSS-Expanded Disability Status Scale; MSFC-Multiple Sclerosis Function Composite.
RNA Isolation
RNA was extracted ex-vivo from blood using PAXgene™ RNA blood extraction kit (PreAnalytix, Switzerland) as per the manufacturer’s instructions and concentrated by ethanol precipitation. RNA quality and quantity was assessed by spectrophotometry (absorbance ratios of 280/260 nm) and additional visualization by agarose gel electrophoresis. RNA samples were stored at −80°C.
Gene Expression using Macroarray
The detailed methodology for cDNA macroarray analysis has been described elsewhere. 13 Genes on the custom array comprised 186 human cDNAs that were primarily selected from the Unigene database. A list of the names of all genes on the macroarray with GenBank accession numbers is shown in Table 2.
TABLE 2.
List of Genes on the Macroarray
| Gene | Accession No. | Gene | Accession No. | Gene | Accession No. | Gene | Accession No. |
|---|---|---|---|---|---|---|---|
| 2–5OAS | NM_002534 | G1P3 | NM_002038 | IP-10 | X02530 | PDK2 | NM_002611 |
| a1-AT | K01396 | Gadd45 | M60974 | IRF4 | U52682 | PGK | V00572 |
| ADAM17 | U69611 | GATA 3 | X58072 | IRF1 | L05072 | PI3K | NM_006219 |
| Adaptin | AF068706 | GBP2 | M55543 | IRF2 | X15949 | PIAS | AF077954 |
| Akt-1 | NM_005163 | Gran B | M17016 | IRF7 | U73036 | PIAS1 | AF077951 |
| Akt-2 | M77198 | HLADP | M83664 | ISG15-L | M13755 | Pig7 | AF010312 |
| APOL3 | AA971543 | HLADRA | J00194 | ISG20 | NM_002201 | PKR | NM_002759 |
| ATF 2 | X15875 | HLAE | X56841 | ISGF3g | M87503 | plectin | U53204 |
| Bad | U66879 | Hou | U32849 | JUN | J04111 | PLSCR1 | AF098642 |
| Bax | U19559 | HPAST | AF00144 | L1CAM | M74387 | PSMB9 | X66401 |
| Bcl-2 | M14745 | Hsf1 | M64673 | L-Selectin | M25280 | Raf | X03484 |
| BST2 | D28137 | Hsp90 | X15183 | MAP2K3 | NM_002756 | RCNI | D42073 |
| C1-INH | NM_000062 | IDO | NM_002164 | MAP2K4 | L36870 | RGS2 | NM_002923 |
| C1orf29 | NM_006820 | IFI16 | M63838 | MAP3K11 | NM_002419 | RHO GDP | L20688 |
| C1r | NM_001733 | IFI-17 | J04164 | MAP3K14 | NM_003954 | Ribonuc | NM_003141 |
| C1S | J04080 | IFI35 | U72882 | MAP3K3 | U78876 | RIG-1 | AF038963 |
| Caspase 1 | M87507 | IFI44 | D28915 | MAP3K4 | NM_005922 | SERPIN | NM_000295 |
| Caspase 7 | U67319 | IFI-44 | D28915 | MAP3K7 | NM_003188 | Smad1 | U59423 |
| Caspase 9 | U60521 | IFI60 | AF083470 | MAP4K1 | NM_007181 | SNN | NM_003498 |
| CBFA | NM_004349 | IFIT1 | M24594 | MAPK13 | AF004709 | SOCS-1 | N91935 |
| CCR1 | L09230 | IFIT2 | NM_001547 | MAPK7 | NM_002749 | SOCS2 | AF020590 |
| CCR5 | U54994 | IFIT4 | NM_001549 | Met-onco | NM_000245 | SSA1 | NM_003141 |
| CD14 | NM_000591 | IFIT5 | NM_012420 | MIP-1b | NM_002984 | STAT1 | M97935 |
| CD3e | NM_012099 | IFITM2 | NM_006435 | MMP-1 | M13509 | STAT2 | M97934 |
| CEACAM | NM_001712 | IFITM3 | X57352 | MMP-9 | NM_004994 | STAT4 | L78440 |
| c-fos | NM_005252 | IFN-17 | M13755 | MT1H | NM_005951 | STAT5A | L41142 |
| c-myc | L00058 | IFN-9/27 | J04164 | MT1X | NM_005952 | TAP1 | X57522 |
| Collagen | J03464 | IFNAR1 | J03171 | MT2A | NM_005953 | TFEC | NM_012252 |
| COMT | M58525 | IFNAR2 | L42243 | MX1 | M33882 | TGFbR2 | D50683 |
| CREB | NM_004379 | IFNGR1 | J03143 | MX2 | M30818 | TGFbR3 | L07594 |
| CXCL11 | NM_005409 | IFNGR2 | U05875 | NF-IL-6 | X52560 | TIMP-1 | M59906 |
| CXCR4 | AF005058 | IkBa | M69043 | NFkB | M58603 | TNF-a | X01394 |
| CYB56 | NM_007022 | IL15 | U14407 | NMI | Y00664 | TNFAIP6 | NM_007115 |
| Cyp19 | M28420 | IL18 BP | AB019504 | NT5e | X55740 | TOR1B | NM_014506 |
| DDX17 | U59321 | IL1RN | NM_000577 | OASL | NM_003733 | TRAIL | U37518 |
| Def-a3 | NM_005217 | IL2 | NM_000586 | P4HA1 | M24486 | UBE2L6 | NM_004223 |
| Destrin | S65738 | IL2Rg | NM_000206 | p53 | M14694 | USP18 | NM_017414 |
| Elastase 2 | M34379 | IL6 | X04602 | p57Kip2 | U22398 | VegFC | U43142 |
| F-actin | U56637 | IL8Rb | NM_001557 | p70 K | M60724 | Viperin | AF026941 |
| Fas-L | U08137 | iNOS | U20141 | PAI-1 | M16006 | WARS | X62570 |
| FK506 | AF038847 | Int-6 | U62962 | PDGF-a | X06374 | ||
| FLJ20035 | AK000042 | integ-b-6 | NM_000888 | PDK1 | Y15056 |
Genes on the cDNA macroarray were originally identified from microarray analysis of fibrosarcoma, epithelial or endothelial cell lines treated with IFN-β.10,11,13 All the genes comprised known ISGs and genes of potential interest and included genes involved in IFN signaling, cytokine production, antiviral, antiproliferative, and immunomodulatory functions.
The protocol for spotting DNA on the membrane, probe labeling and hybridization was as reported earlier with local modifications. 13 Five μg of total RNA isolated ex-vivo from blood was used for generating radiolabeled cDNA probes by reverse transcription with Superscript II in the presence of 32PdCTP (Invitrogen, Carlsbad, CA). Residual RNA was hydrolyzed by alkaline treatment at 70°C for 20 min after which cDNA was purified using G50 columns (GE Healthcare, Buckinghamshire, UK). Preparation of macroarrays and hybridization of radioactive cDNA were conducted as described previously.13 Probes were hybridized overnight to macroarray membranes in 10 ml of hybridization buffer, followed by wash with low and high stringency buffers and exposure to intensifying phosphor screens for two days and scanning by StormImager (Molecular Dynamics, Sunnyvale, CA). Radioactivity bound to the membrane was quantitated, and used to calculate induction ratios (IR) of the ISGs as shown below.
To minimize variability, each patient’s samples at baseline (0 months) and 6 months were processed in a single batch experiment (total of 4 membranes). A detailed laboratory protocol for the macroarray method is available on request.
Statistical Analysis
The heatmaps were generated from complete linkage hierarchical cluster analyses. The Euclidean distance metric d used in the cluster analyses is,
When clustering the subjects, dij is computed based on the data profiles of all the ISG genes between subjects i and j, whereas when clustering the genes, dij is computed based on the data profiles across all subjects between genes i and j. Pearson correlation between baseline and six months ISG fold-induction intensity was computed for 35 patients.
Results and Discussion
The molecular response to interferon-β in 35 treatment-naïve MS patients was studied at baseline (initial injection) and 6 months with standardized dose, route, and preparation of IFN-β as well as the time elapsed between IFN injection and blood draw. A customized cDNA macroarray assay was used for assessment of ISGs expression signatures.
Optimization of Macroarray Assay
Selection of Timing of Phlebotomy before and after Injection with IFN-β
ISGs are subject to differential transcriptional and post-transcriptional control resulting in differences in rates of mRNA accumulation and decay.16 We selected the 12 h post-injection time point for collection of blood based on an earlier kinetic microarray study which demonstrated that the 12 h time point captured peak induction of the largest number of ISGs involved in the primary response to IFN-β.4
Background Correction and GAPDH Normalization for IR
The IR was defined as the signal from ISG normalized to the GAPDH signal of the post-injection membrane divided by the normalized hybridization signal for the same ISG determined from the pre-injection membrane. The induction ratio (IR) of the ISGs was computed using calibrated data as follows: In consideration of the uniformly higher hybridization signal for GAPDH and for empty unspotted background wells on post-IFN membranes, a data imputation rule was applied. For a given membrane, mean plus 2 standard deviations (SDs) of the unspotted wells from the membrane was computed. Any ISGs or GAPDH on the membrane whose intensity values fell below the mean + 2 SD background threshold were replaced with the threshold value. There are four GAPDH triplicate wells on the membrane, and median GAPDH intensity was used in the normalization. Following this calibration, IR of the ISGs was computed as shown below:
Where both post- and pre- injection values were imputed, the IR ratio was set to 1.
Calibration Detection Algorithm
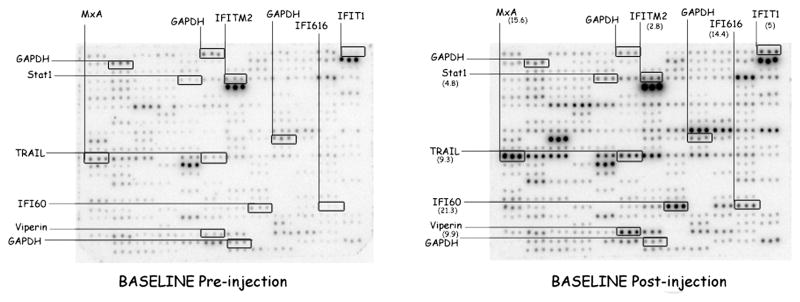
ISG cDNAs were spotted on macroarray membrane in triplicate. Spots were occasionally omitted, resulting in outlying data sets (Fig. 1 left panel middle spot on the last set of triplicate spots on horizontal row 10; middle spot in the fourth set of triplicate on horizontal row 8). Although membranes were spotted in sets of eight, missing spots could be observed at positions spotted correctly on companion membranes, indicating there was no systematic malfunction of specific pin in the replicator.
Figure 1.
Digitized image of a macroarray experiment containing selected ISGs. RNA was isolated ex-vivo from whole blood of a patient 12 h before and 12 h after IFN-β injection. Each nylon filter was spotted in triplicate with DNA amplified from IMAGE clones representing 186 ISGs. RNA was isolated from whole blood, reverse-transcribed using radiolabel and hybridized to the membranes. All membranes after wash were exposed on StormImager (Molecular Dynamics, Sunnyvale, CA) screen for 48 h and the radioactivity bound to the membrane was quantitated. For the purpose of illustration, 8 induced genes (from a total of 162 genes) and the housekeeping gene glyceraldehyde-3-phosphate dehydrogenase (GAPDH) which is spotted on four different locations on the membrane are highlighted. The induction ratios (IR) are shown within parenthesis on the right panel. The left panel shows a pre-injection macroarray and on the right is the post-injection macroarray.
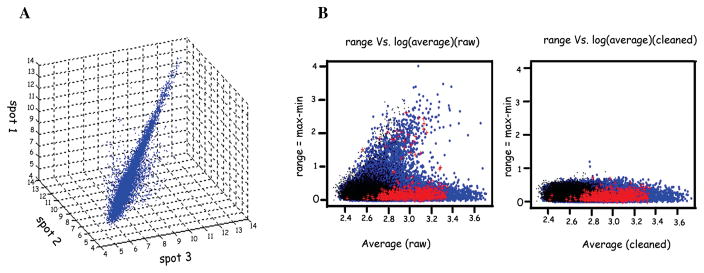
The quantitated intensity data are shown in a 3D scatter plot with each coordinate corresponding to one of the three measurements from the triplicate (Fig. 2A). The figure shows that there are two different data patterns. The vast majority of the data locate on the axis that goes from the lower-left corner to the upper-right corner and a small proportion of data locate outside the main data pattern. These two patterns are related to two different sources of measurement variations: one is the biological variation in ISG expression, and the other derives from the measurement process.
Figure 2.
Quantitation of intensity data after correction. (A) A 3D scatter plot with each coordinate corresponding to one of the three measurements from the triplicate spot for each cDNA on the macroarray. (B) Correction of data using the multivariate outlier detection algorithm. The left panel shows the triplicate data spots for all the genes plotted prior to correction and the right panel shows the corrected data after application of the algorithm.
To take advantage of the triplicate design to reduce measurement error, the multivariate outlier detection algorithm was applied.17 Robust distance (RD) was determined using the formula below,
where (μ̂, Σ̂) are the minimum covariance determinant estimates (MCD) of the location and scatter computed with the FAST-MCD algorithm.18 Here, RD follows a χ2 distribution with d.f. = 3. The blue dots in Figure 2B represent the data from the ISG that required calibration. For those ISG’s, the average signals are calculated only based on the two stable measurements.
Comparison of the measurement error (max–min) versus the average measurement of calibrated data (Fig. 2B, right panel) and original data (lleft panel) shows clearly that the proposed calibration algorithm is effective in reducing measurement error.
Assay Precision Supports Defining Gene Induction as an Induction Ratio ≥ 2
Blood was collected from four healthy controls at a 24-h interval and RNA was isolated from whole blood. Radiolabeled cDNA probes were generated and hybridized to the genes on macroarray membranes. ISG expression was analyzed after normalization to GAPDH (data not shown). The induction ratio (IR) was defined as the signal from the ISG normalized to the GAPDH signal from the 24-h phlebotomy divided by normalized hybridization signal for the same ISG determined from baseline (0 h) phlebotomy.
The average IR for the four healthy controls clustered around 1 and no ISG showed statistical evidence of IR different from 1. Hence, for the differential expression analysis in MS patients before and after injection with IFN-β, the fold change parameter for significance was set at 2-fold.
Post-injection ISG Expression Patterns in MS Patients
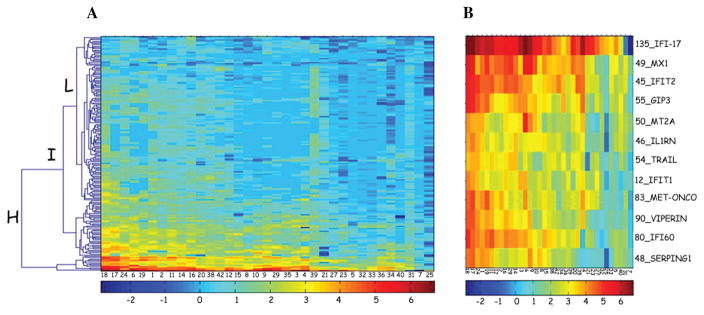
A representative experiment of a macroarray for ISGs at baseline pre-injection and post-injection of IFN-β is shown in Figure 1. For each patient, baseline ISGs (>2 fold induced) were visualized using hierarchical cluster analysis (Fig. 3A). Patient 7 and 25 each of whom had symptoms of viral upper respiratory infection at the baseline time point, showed near maximal ISG expression in the pre-injection sample and did not demonstrate ISG induction at this time point.
Figure 3.
ISG expression patterns in MS patients. (A) The figure shows a heat map of the ISG fold-induction intensity for 35 patients at baseline. Patients are represented by columns and genes across the rows. The colors range from low induction ratios in blue, to high induction ratios in red. As is evident, the 35 subjects range from high ISG inducers on the left, to low ISG inducers on the right. The heat map illustrates qualitative and quantitative variability in ISG induction across the 35 patients. The ISGs induced in the patients blood after IFN-β injection at baseline can be clustered into three groups as high expression (H), intermediate expression (I) and low expression (L) cluster. (B) Expanded view of the high expression cluster shown in the heat map in Figure 3A.
The ISGs induced in the patients’ blood after IFN-β injection at baseline can be clustered into three groups – high expression, intermediate expression and low expression cluster. The high expression cluster consisted of 12 universally expressed ISGs which were upregulated in almost all patients as shown in Figure 3B and the mean induction ratio averaged from 6 to 41-fold (Table 3). These ISGs included antiviral ISGs like MX1, viperin, IFIT1 and IFIT2; anti-apoptotic genes G1P3 and met-oncogene; immuno-regulatory genes like TRAIL, MT2A, C1-INH, IFI-17, IL1RN and anti-proliferative gene, IFI-60. The intermediate expression cluster comprised of 44 ISGs and the rest belonged to the low expression cluster.
TABLE 3.
High Expression Cluster of 12 Universally Expressed ISGs in 35 Patients
| Gene | % IR > 2.0 | Mean IR | Std Dev | Min | Max |
|---|---|---|---|---|---|
| IFI-17 | 94.3 | 41.0 | 28.1 | 0.1 | 103.0 |
| MX1 | 97.1 | 17.8 | 12.5 | 1.5 | 52.6 |
| IFIT2 | 94.3 | 15.2 | 9.8 | 1.5 | 37.4 |
| G1P3 | 94.3 | 11.6 | 8.8 | 1.4 | 39.8 |
| IFI60 | 85.7 | 10.7 | 7.9 | 1.1 | 35.8 |
| Met-onco | 91.4 | 8.8 | 7.0 | 0.9 | 29.3 |
| MT2A | 91.4 | 8.0 | 6.8 | 0.8 | 36.8 |
| Viperin | 91.4 | 7.8 | 6.1 | 1.2 | 24.5 |
| C1-INH | 80.0 | 7.2 | 5.8 | 0.5 | 23.4 |
| IL1RN | 97.1 | 6.8 | 4.0 | 0.6 | 18.8 |
| IFIT1 | 91.4 | 6.7 | 4.3 | 0.9 | 19.6 |
| TRAIL | 88.6 | 6.5 | 3.8 | 0.7 | 14.3 |
IR-Induction Ratio
We assessed the potential for correlations of the mean of the top 12 ISG ratios at baseline to age, gender, race, disease severity (Expanded disability status scale) and type of MS (relapsing-remitting; clinically isolated syndrome). No demographic or disease-related attributes were correlated to the mean fold induction of the top 12 induced ISG expression. Further analysis is in progress to correlate individual gene expression to clinical disease attributes.
Heterogeneity in IFN-β-induced Gene Expression between Patients at Baseline
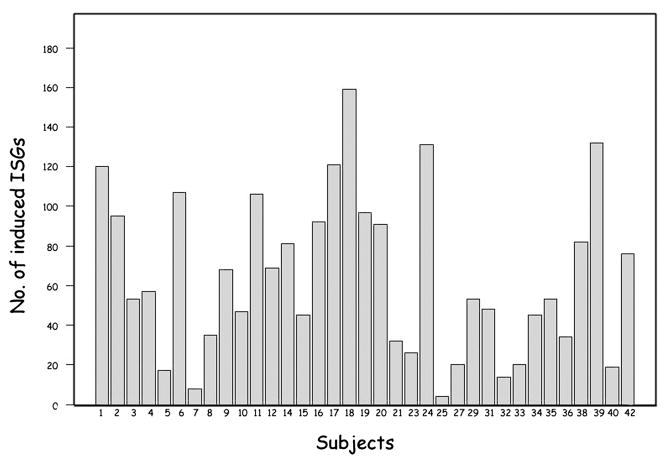
The number of induced ISGs (>2 fold) varied among patients (Fig. 4). The number of upregulated ISGs ranged from 4 to 159 with more than 80% of patients showing induction of more than 20 ISGs. Patient 7 and 25 showed the least ISG induction due to high pre-injection ISG expression. The number of induced ISGs and the specific genes induced varied among patients (Figs. 3 and 4).
Figure 4.
Inter-individual variation in the number of ISGs induced in MS patients. The histogram shows the number of ISGs with >2-fold induction at baseline for all 35 patients. The subject ID is shown on the x-axis and the number of induced genes is shown on the y-axis.
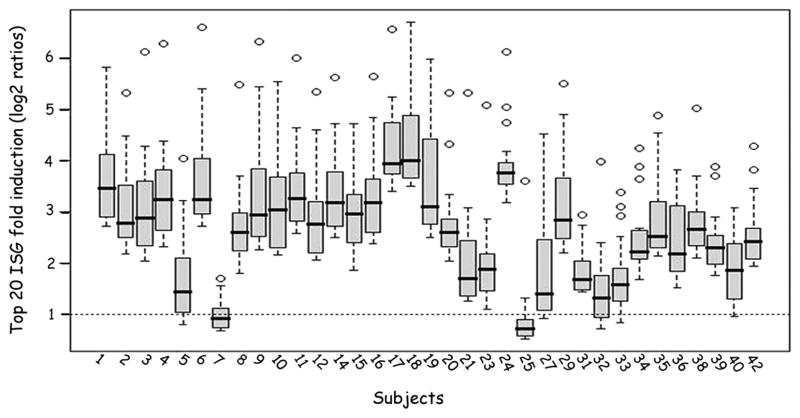
The magnitude of induction of individual ISGs also varied among patients as shown by analysis of the fold-induction of the top 20 ISGs at baseline (Fig. 5).
Figure 5.
Quantitative variability across patients in the magnitude of ISG induction. The figure illustrates the fold-induction of top 20 ISGs for all 35 patients at baseline. This figure shows box and whisker plots for each of the 35 subjects and represents the fold-induction on a log scale for the top 20 genes induced in each subject. All but two subjects (7 and 25) induced numerous genes, but with considerable variability across the subject pool. The figure illustrates the quantitative variability across patients in the magnitude of ISG induction.
Stability of ISG Expression Signatures Over Time
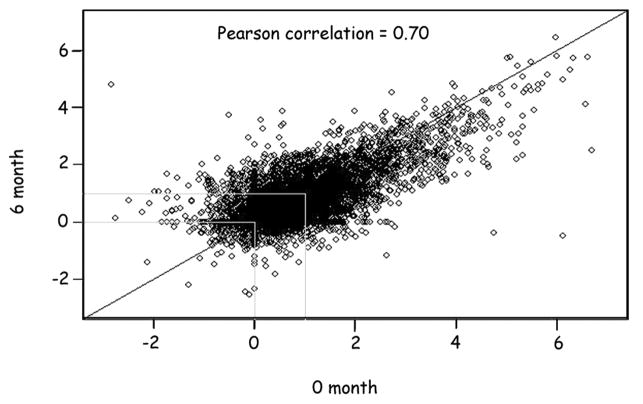
The molecular response to IFN-β injections at six months is shown in comparison to baseline by scatter plot in Figure 6. The patients demonstrated stability of ISG expression signature over time, defined as a strong correlation between ISG fold-induction at six months compared with baseline. The Pearson correlation coefficients for all the 35 patients was >0.7 (Fig. 6).
Figure 6.
Stability of ISG expression. The scatter plot shows the fold-induction for individual genes on the macroarray at baseline (x-axis) and at 6 months (y-axis) for all 35 subjects. The Pearson correlation coefficient was = 0.70.
Conclusion
This report provides the first detailed characterization of the primary molecular response to IFN injections in treatment-naïve MS patients. The molecular signatures of ISG expression detected ex-vivo in blood samples from treatment-naïve MS patients after injections with IFN-β at baseline and six months varied considerably between individuals. Similar observations were also reported in a recent gene expression study of nine MS patients.19 We also observed that the ISG response was remarkably stable within individuals over time. The stability of the individual molecular signatures in these patients will enable the identification of molecular biomarkers of the therapeutic response to IFN-β.
During the study, novel methodologies for cDNA macroarray, data analysis and bioinformatics were developed, and could be useful for studies addressing the identification of molecular biomarkers for therapeutic response, in cases where therapeutic agents regulate mRNA accumulation. Our findings suggest that differential clinical responses among patients will be related to variability in the primary molecular responses to IFN-β injections. Analysis of ISG expression in relation to treatment failure and side effects will be required to address our underlying hypothesis. The results to date suggest that this analysis will be feasible.
Acknowledgments
We thank Ian Kerr (Cancer Research, UK) and George Stark (Molecular Genetics, Cleveland Clinic, Cleveland) for their valuable advice, and helpful discussions in starting this project. Special thanks to John Barnard, Swathi Chakraborthy and Minnie Chacko at Quantitative Health Sciences, Cleveland Clinic for help in setting up the database, Parianne Fatica, Dianne Ivancic and Cynthia Schwanger at Mellen Center for Multiple Sclerosis, Cleveland Clinic for sample collection.
This research is supported by NIH/NINDS (P50 NS38667, RMR, Program Project PI; Project #4 leader Richard A. Rudick with Richard M. Ransohoff, co-investigator). The procurement of patient samples was supported in part by the National Institutes of Health, National Center for Research Resources, General Clinical Research Center Grant MO1 RR-018390.
Footnotes
Conflicts of Interest
The authors declare no conflicts of interest.
References
- 1.Ann MR, et al. Drug Insight: interferon treatment in multiple sclerosis. Nat Clin Pract Neurol. 2006;2:34–44. doi: 10.1038/ncpneuro0088. [DOI] [PubMed] [Google Scholar]
- 2.Goertsches R, et al. MS therapy research applying genome-wide RNA profiling of peripheral blood. Int MS J. 2007;14:98–107. [PubMed] [Google Scholar]
- 3.Sturzebecher S, et al. Expression profiling identifies responder and non-responder phenotypes to interferon-beta in multiple sclerosis. Brain. 2003;126:1419–1429. doi: 10.1093/brain/awg147. [DOI] [PubMed] [Google Scholar]
- 4.Weinstock-Guttman B, et al. Genomic effects of IFN-beta in multiple sclerosis patients. J Immunol. 2003;171:2694–2702. doi: 10.4049/jimmunol.171.5.2694. [DOI] [PubMed] [Google Scholar]
- 5.Wandinger KP, et al. Complex immunomodulatory effects of interferon-beta in multiple sclerosis include the upregulation of T helper 1-associated marker genes. Ann Neurol. 2001;50:349–357. doi: 10.1002/ana.1096. [DOI] [PubMed] [Google Scholar]
- 6.Achiron A, et al. Peripheral blood gene expression signature mirrors central nervous system disease: the model of multiple sclerosis. Autoimmun Rev. 2006;5:517–522. doi: 10.1016/j.autrev.2006.02.009. [DOI] [PubMed] [Google Scholar]
- 7.Santos R, et al. Dynamics of interferon-beta modulated mRNA biomarkers in multiple sclerosis patients with anti-interferon-beta neutralizing antibodies. J Neuroimmunol. 2006;176:125–133. doi: 10.1016/j.jneuroim.2006.03.019. [DOI] [PubMed] [Google Scholar]
- 8.Stark GR, et al. How cells respond to interferons. Annu Rev Biochem. 1998;67:227–264. doi: 10.1146/annurev.biochem.67.1.227. [DOI] [PubMed] [Google Scholar]
- 9.Borden EC, et al. Interferons at age 50: past, current and future impact on biomedicine. Nat Rev Drug Discov. 2007;6:975–990. doi: 10.1038/nrd2422. [DOI] [PMC free article] [PubMed] [Google Scholar]
- 10.Der SD, et al. Identification of genes differentially regulated by interferon alpha, beta, or gamma using oligonucleotide arrays. Proc Natl Acad Sci USA. 1998;95:15623–15628. doi: 10.1073/pnas.95.26.15623. [DOI] [PMC free article] [PubMed] [Google Scholar]
- 11.Miura A, et al. Differential responses of normal human coronary artery endothelial cells against multiple cytokines comparatively assessed by gene expression profiles. FEBS Lett. 2006;580:6871–6879. doi: 10.1016/j.febslet.2006.11.041. [DOI] [PubMed] [Google Scholar]
- 12.Rani MR, et al. Novel interferon-beta-induced gene expression in peripheral blood cells. J Leukoc Biol. 2007;82:1353–1360. doi: 10.1189/jlb.0507273. [DOI] [PubMed] [Google Scholar]
- 13.Schlaak JF, et al. Cell-type and donor-specific transcriptional responses to interferon-alpha. Use of customized gene arrays. J Biol Chem. 2002;277:49428–49437. doi: 10.1074/jbc.M205571200. [DOI] [PubMed] [Google Scholar]
- 14.Whitney AR, et al. Individuality and variation in gene expression patterns in human blood. Proc Natl Acad Sci USA. 2003;100:1896–1901. doi: 10.1073/pnas.252784499. [DOI] [PMC free article] [PubMed] [Google Scholar]
- 15.Hilkens CM, et al. Differential responses to interferon-a subtypes in human Tcells and dendritic cells. J Immunol. 2003 doi: 10.4049/jimmunol.171.10.5255. [DOI] [PubMed] [Google Scholar]
- 16.Friedman RL, et al. Transcriptional and post-transcriptional regulation of interferon-induced gene expression in human cells. Cell. 1984;38:745–755. doi: 10.1016/0092-8674(84)90270-8. [DOI] [PubMed] [Google Scholar]
- 17.Rousseeuw PJ, Leroy AM. Robust Regression and Outlier Detection. Wiley; New York: 1987. [Google Scholar]
- 18.Rousseeuw PJ, et al. A fast algorithm for the minimum covariance determinant estimator. Technometrics. 1999;41:212–223. [Google Scholar]
- 19.Reder AT, et al. IFN-â1b induces transient and variable gene expression in relapsing-remitting multiple sclerosis patients independent of neutralizing antibodies or changes in IFN receptor RNA expression. J Interferon Cytokine Res. 2008;25:317–331. doi: 10.1089/jir.2007.0131. [DOI] [PubMed] [Google Scholar]


