Abstract
Using the “bottom-up” approach and liquid chromatography in combination with mass spectrometry, the primary structure and sequence microheterogeneity of a plaque-specific anti-β-amyloid (1–17) monoclonal antibody (clone 6E10) was characterized. This study describes the extent of structural information directly attainable by a high performance LC- tandem mass spectrometric method in combination with both protein database searching and de novo sequence determination. Using trypsin and chymotrypsin for enzymatic digestion, 95% sequence coverage of the light chain and 82% sequence coverage of the heavy chain of the 6E10-antibody were obtained. The primary structure determination of a large number of peptides from the antibody variable regions was obtained through de novo interpretation of the data. In addition, N-terminal truncations of the heavy chain were identified as well as low levels of pyro-glutamic acid formation. Surprisingly, pronounced sequence microheterogeneities were determined for the CDR 2 region of the light chain, indicating that changes at the protein level derived from somatic hypermutation of the Ig VL genes in mature B-cells might contribute to unexpected structural diversity. Furthermore, the major glycoforms at the conserved heavy chain N-glycosylation site, Asn-292, were determined to be core fucosylated, biantennary, complex type structures containing zero to two galactose residues.
Introduction
The amyloid β-peptide (Aβ) has a central role in initiating neurodegeneration in Alzheimer’s disease (AD) and AD-related diseases (1,2), and has been an active target of a number of therapeutic approaches, including antibody immunotherapy. Therapeutically-active antibodies produced by active immunization with protofibrillar Aβ(1–42) and fibrillar preparations have been found first to reduce the amyloid burden and to improve cognitive functions in TgCRND8 transgenic mouse models of AD (3). The antibodies against Aβ in the immunized TgCRND8 mice recognize a short epitope sequence located at the N-terminus of Aβ (FRHDSGY), which has been identified by proteolytic epitope excision and high resolution mass spectrometry (FTICR- MS) (3). Unfortunately, an initial therapeutic trial of active immunization of AD patients with Aβ(1–42) was discontinued because a few patients developed significant meningo-encephalitic cellular inflammatory reactions (4). In spite of this initial drawback, Aβ-specific active as well as passive immunotherapy is presently developing as a promising therapeutic approach.
Recent advances in recombinant DNA and hybridoma technologies have enabled the production of a large number of recombinant proteins for experimental and clinical use. In the last years, an increasing number of therapeutic approaches have relied on monoclonal antibodies for treatment of both malignant (5,6) and autoimmune diseases (7,8). A mouse monoclonal antibody produced in hybridoma (clone 6E10) has been widely used in AD research. Terai and co-workers have used the 6E10 antibody to characterize the major β-amyloid species in senile plaques by affinity– MS and immunochemistry (9), while Maddalena et al. used protein chip technology to capture the Aβ-peptides in cerebrospinal fluid (CSF) with 6E10 followed by mass spectrometric characterization of the captured peptides (10). These results and the most recent clinical studies confirming the epitope specificity (ADPD Congress, March 14–17, 2007, Salzburg, Austria) emphasize the therapeutic potential of plaque-specific antibodies. Using epitope excision – mass spectrometry and alanine scanning mutagenesis, we have previously shown that the mouse monoclonal 6E10 antibody, directed against β-amyloid (1–17), recognizes the same short epitope (FRHDSGY) at the N-terminus of Aβ, as did the antibodies resulting from active immunization of transgenic mice with Aβ(1–42) (11,12). Therefore, it is our hypothesis that primary structure details of this plaque-specific antibody (6E10) will provide a better understanding of the antigen recognition process at the molecular level and contribute to the development of more effective vaccines.
Structural studies of immunologically important molecules, especially of antibody-antigen recognition structures, have greatly expanded with the development of analytical methods, including NMR, X-ray crystallography and mass spectrometry (MS) (13–15). Among these, affinity-based approaches, in conjunction with high resolution and high sensitivity mass spectrometric methods, are becoming increasingly effective for identification of antigens directly from biological material (16). The developments in soft ionization techniques (17,18) and mass analyzers greatly expanded the potential of mass spectrometry to analyze large biomolecules, such as antibodies, and this has become a major tool for the characterization of recombinant protein pharmaceuticals (19). Most recently, recombinant monoclonal antibodies have been analyzed by both “top-down” and “bottom-up” approaches in the determination of: (i) protein primary structure heterogeneities, (ii) verification of amino acid sequences predicted from the cDNA, and (iii) possible post-translational modifications such as glycosylation, oxidation, deamidation, C-terminal truncation and formation of pyro-Glu at the N-terminus.
In the absence of crystal structure data, the complete characterization of the primary structure of monoclonal antibodies produced in hybridomas, for which no cDNA information is available, represents a considerable challenge, resulting primarily from the complexity of the immune system. IgG antibodies are tetrameric molecules (~150 kDa), composed of two identical heavy (gamma) and two light (kappa or lambda) chains. The tertiary structure is stabilized by intra- and inter-chain disulfide bridges. The complementary determining regions (CDRs), three on each chain, are located in the hypervariable region and are critical for the strength and specificity of antigen recognition (20,21). The DNA encoding the antigen combining portion of an antibody is assembled by gene rearrangement during the early phase of B lymphocyte development and includes the fusion of gene segments encoding for variable (V), diversity (D), and joining (J) domains (22). The combinatorial diversity resulting from the joining of V-D-J segments is expanded by imprecisions at the recombination sites, which may arise from insertions or deletions of non– templated nucleotides. During B cell affinity maturation, somatic hypermutations (SHMs) and class switch recombination (CSR), both occurring in the rearranged DNA of the Ig genes and targeted by an enzyme called activation induced deaminase (AID), account for additional diversity to provide antibodies with the highest affinity for a specific antigen (23). As a result, it is difficult to characterize the protein sequence of a full-length antibody based only on peptide mapping and information available in protein databases.
Recently, Pham et al. reported the first de novo sequence analysis of a full length monoclonal antibody (for which the cDNA was not available) with neutralizing activity against the OX40L ligand, a member of the tumor necrosis factor superfamily involved in T-cell activation (24,25). In these studies, they used a combination of proteolytic and chemical digestions, Edman degradation, and mass spectrometry (26). However, a substantial portion of the data was derived from Edman sequence analysis, while mass spectrometry was rather inefficient in providing unambiguous structural information about the antigen binding regions.
In the present study, we characterize the primary structure of the 6E10 mouse antibody using predominantly liquid chromatography in combination with tandem mass spectrometry. Within the amino acid sequences characterized, N-terminal truncation of the heavy chain and a low extent of pyro-glutamic acid formation were determined. Unexpected microheterogeneities in the CDR2 region of the light chain have been observed by MS/MS, suggesting that they may originate from somatic hypermutations in the V gene of the light chain upon fusion of the B-cell with the myeloma cell. A large part of the variable regions was determined by de novo MS/MS analysis.
Materials and Methods
Materials
Mouse anti-β-amyloid monoclonal antibody (mAb1560, clone 6E10) was purchased from Millipore (Billerica, MA). Dithiothreitol, iodoacetamide, ammonium bicarbonate, and 96% formic acid were purchased from Sigma-Aldrich (St. Louis, MO). Sequencing grade-modified porcine trypsin was obtained from Promega (Madison, WI) and sequencing grade bovine α-chymotrypsin was obtained from Roche (Penzberg, Germany). NuPage 4 – 12 % Bis-Tris pre-cast gels, sample and running buffers and Coomasie SimplyBlue were from Invitrogen (Carlsbad, CA). Acetonitrile was purchased from Caledon Laboratories, Ltd. (Georgetown, Ontario). Purified water (17.8 MΩ) was obtained from an in-house Hydro Picopure 2 system. All sequencing-grade reagents used for Edman sequencing were purchased from Applied Biosystems (Darmstadt, Germany). All chemicals were used without further purification unless otherwise specified.
Methods
SDS-PAGE
Reduced and alkylated 6E10 antibody was separated on 4–12% Bis-Tris pre-cast gels as follows: 40 µL of the antibody stock solution (1 µg/µL in PBS buffer) were incubated for one hour at 90° C with 20 µL sample buffer containing 100 mM dithiothreitol (DTT). A solution of iodoacetamide (IAA) in water was then added to the mixture at a molar ratio of DTT/IAA 1:3 and the reaction was continued for an additional hour at room temperature. The reduced and alkylated antibody was loaded onto the gel (approximately 10 µg/lane) and the heavy and light chains were separated. Electrophoresis was performed at 200V and a maximum of 60mA, for one hour. The bands were stained over night with Coomasie Simply Blue solution.
In-gel digestion
The protein bands corresponding to antibody heavy and light chains were manually cut and digested with trypsin for 8 hours at 37° C in an automated fashion with a Progest robotic digester (Genomic Solutions). In-gel digestion with α-chymotrypsin was performed manually using an enzyme to substrate ration of 1:30, based on the initial amount of reduced and alkylated antibody. Samples were lyophilized to dryness and resuspended in 0.1% formic acid.
Mass Spectrometry
LC/MS analyses were performed using a Waters Q-Tof Premier mass spectrometer equipped with a nanoAcquity UPLC system (Waters, Milford, MA). Separations were performed on a 100 µm × 100 mm, Atlantis 3 µm dC18 column (Waters, nanoAcquity), using a flow rate of 300 nL/min. A C18 trapping column (180 µm × 20 mm) with a 5 µm particle size (Waters, nanoAcquity) was positioned in-line of the analytical column. Briefly, a 2 µl aliquot of the digest sample was injected, trapped onto the column, and peptides were eluted using a linear gradient of 98% solvent A (0.1% formic acid in water (v/v)) and 2% solvent B (0.1% formic acid in acetonitrile (v/v)) to 40% solvent B over 60 minutes. Mass spectrometer settings for the MS analyses were: capillary voltage, 3.2 kV; cone voltage, 33 V; collision energy, 8.0 V; and source temperature, 80° C. The mass spectra were acquired over the mass range 200 – 2000 Da. MS/MS data were acquired in the data dependent mode, using collision energies based on mass and charge state of the candidate ions. An external lock mass using a separate reference sprayer (LockSpray) and a solution of Glu-Fibrinogen peptide (300 fmol/µL) in water/acetonitrile 80:20 (v/v) and 0.1% formic acid, with a mass of 785.8496 (2+), was used for calibration. Data analyses were performed using using MassLynx 4.0 software (Waters, Milford, MA).
Database search
Prior to database searching, data were processed (including ions with S/N ratio greater than 3) using Mascot Distiller software (Matrix Science, UK) and saved as an *.mgf file. These data were searched against the NCBInr protein data base by means of the Mascot MS/MS Ion Search engine, using a precursor tolerance of 0.2 Da and a MS/MS tolerance of 0.1 Da. The sequences determined from the MS/MS data obtained for the identified peptides were validated manually.
N-terminal Edman Sequencing
Following SDS-PAGE separation of 20 µg of the reduced and alkylated antibody, the heavy and light chains were electroblotted (45 min, 250 mA) onto a Problott polyvinylidene difluoride (PVDF) membrane (Applied Biosystems) in CAPS buffer (10 mM, pH 11) containing 20% methanol with 10 mM thioglycolic acid. The membrane was washed with water for 15 minutes followed by washing with methanol for 5–10 seconds and then it was incubated with the staining solution (0.1% Coomassie Brilliant Blue R-250 in 40% methanol in water) until the bands became visible. The membrane was then destained in destaining solution (50% methanol in water, freshly prepared before use) until the background stain had decreased and the bands were clearly visible. The membrane was allowed to air-dry after which the bands of interest were cut, fully destained, and kept at 4°C in Eppendorf tubes until use. For Edman sequencing, the PVDF membranes were wetted with 100% methanol and loaded into the sequencing cartridge. Automated amino acid sequence analysis was performed using an Applied Biosystems Model 494 Procise Sequencer attached to a Model 140C Microgradient System and a 785A Programmable Absorbance Detector. All solvents and reagents used were of sequencing grade purity (Applied Biosystems). Sequencing was performed using the standard pulsed liquid method, and data were analyzed with Model 610A Data Analysis software.
Results
Primary structure determination of the 6E10 heavy chain
In order to ascertain the amino acid sequence of the 6E10 monoclonal antibody, the heavy and the light chains were separated by SDS-PAGE following in-solution reduction and alkylation. In addition to the heavy and light chain bands, with an apparent molecular weight of 50 kDa and 25 kDa, respectively, a less intense band was observed at 75 kDa which was identified as albumin. Tryptic and chymotryptic digests of the heavy and light chains were analyzed separately by LC/MS/MS on a QTof- Premier mass spectrometer.
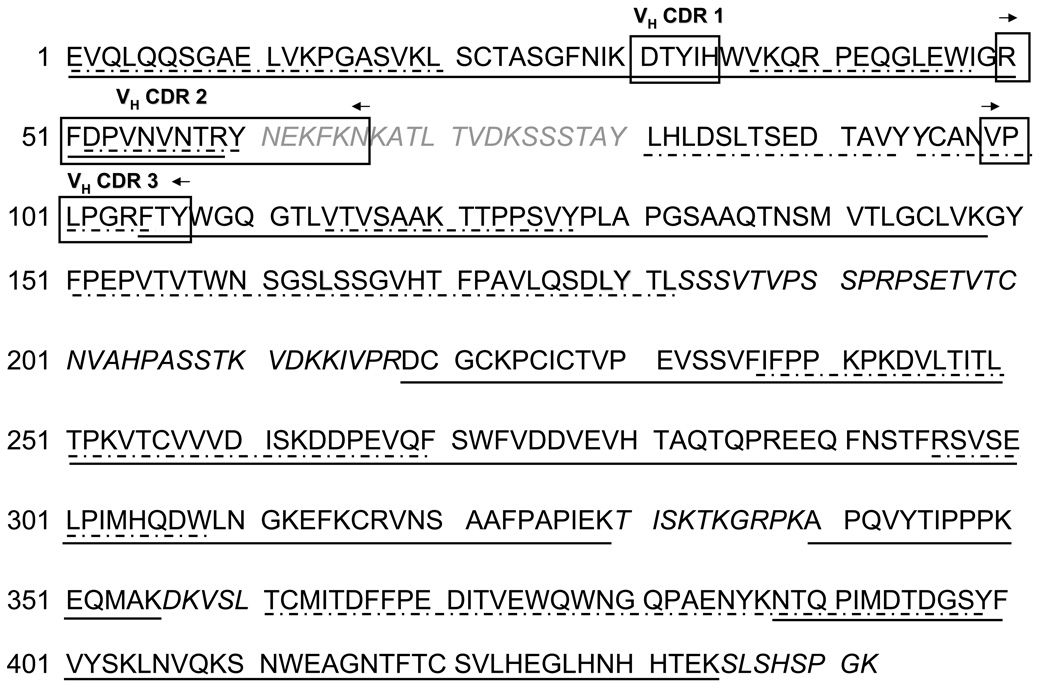
The amino acid sequence determined by MS and MS/MS for the heavy chain of the 6E10 antibody (Figure 1) resulted in an estimated sequence coverage of 82%. The identified tryptic and chymotryptic peptides were fit to a known homologous IgG heavy chain sequence frame from the NCBInr database (accession number ABD73933). Typically, γ-heavy chains contain approximately 440 residues, divided into one variable region (VH) and three constant regions (CH1, CH2 and CH3) with each containing about 110 amino acids. The heavy chain of 6E10 belongs to the IgG1 isotype, based on the amino acid composition of the constant region. The locations of the three complementary determining regions (CDRs) in the VH domain, involved in the antigen recognition, were approximated using the Kabat rules (20,21), and are highlighted with boxes in Figure 1. A higher sequence coverage was obtained by comparison of the MS/MS data in the NCBInr database entries for the heavy chain constant region than for the VH region. This is not unexpected as the constant region is conserved among immunoglobulins while the VH region is the result of the site-specific recombination of the V-D-J genes and affinity maturation of the antibody (22, 27), leading to a greater extent of variability. The amino acid sequence for the constant region CH(219–434) was, for the most part, ascertained by comparison of the MS/MS data with that calculated for the database entries with the exception of those amino acids indicated in italics in Figure 1. The resulting proteolytic peptides containing these residues were possibly too small to be retained on the C18 column or yielded singly charged ions, which would not have been selected for MS/MS analysis based on the predetermined criteria for data dependent acquisition. Lower sequence coverage for the constant region CH(149–218) was obtained; however, as the constant region is conserved among immunoglobulins, it is reasonable to assume that the undetermined amino acids are identical to those reported in the database for the IgG1 isotype. Collectively, LC/MS analyses of the trypsin and chymotrypsin digestions provided complementary information; first, by disclosing antibody regions observed with only one of the two enzymes; and secondly, by generating overlapping peptides, which confirmed the correct succession of the amino acids in the sequence frame.
Figure 1.
Amino acid sequence determined for the 6E10 antibody heavy chain. The CDRs are highlighted with black boxes and arrows; —— regions identified using trypsin; –·–·– regions were identified using chymotrypsin. The amino acids in italics were fitted in the heavy chain sequence based on homology with other antibody sequences (database accession number ABD73933).
The specificity of an antibody for an antigen is dictated by the amino acids in the complementary determining regions (CDRs). The VH CDR3 represents a signature of each immunoglobulin, as it is generated somatically, in the process of B-cell maturation. Unless a specific antibody was previously sequenced and the information deposited into the database, it is not possible to characterize the variable region using the database searching approach. In the case of the 6E10 heavy chain, only the variable region VH(1–50) spanning the CDR1 (residues 26–35) could be assigned by searching the MS/MS data against the NCBInr database. The fragment ion spectra (Supporting Information) for peptides containing the regions VH(1–19), VH(20–38) and VH(39–50) are consistent with the sequence indicated in Figure 1. According to the Kabat rules, the VH CDR1, with a typical length of 10–12 amino acids, is located four residues after the first cysteine of the variable region (CXXX) and is followed always by a tryptophane (20,21). In the case of the 6E10 heavy chain, the VH CDR1 spans the residues VH(26–35) and contains 10 amino acids (Figure 1).
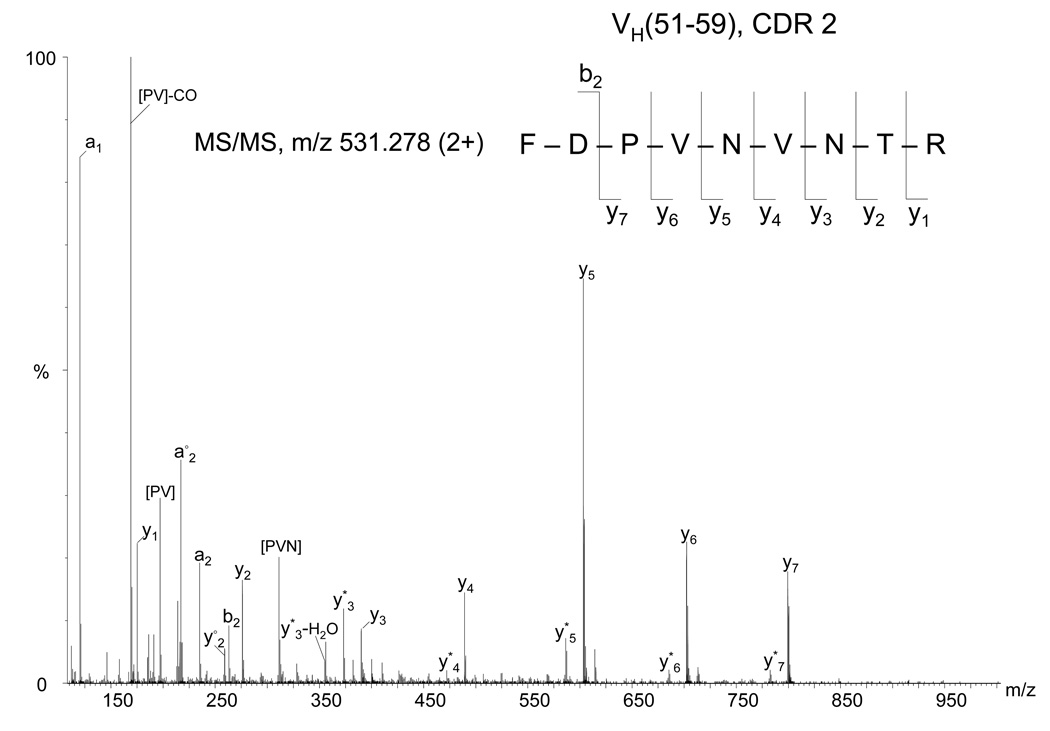
From the LC/MS analysis of the tryptic digest, other ions for which abundant fragmentation was obtained were de novo sequenced assuming trypsin specificity. As an example, the MS/MS spectrum of the ion of m/z 531.278 is shown in Figure 2. From these data, the amino acid sequence of the peptide was determined to be FDPVNVNTR based on the nearly complete y ion series (except for y8) observed in the spectrum. The proposed amino acid sequence was confirmed by the observation of an MS/MS spectrum of an overlapping chymotryptic peptide (DPVNVNTRY) (data not shown). This sequence information was inserted into the heavy chain sequence frame based on homology with another heavy chain from a mouse antibody in which the region VH (51–60) has an amino acid sequence similar to that of the peptide FDPVNVNTRY (NCBI accession number AAA38193). In the Kabat definition, the VH CDR2 begins 15 residues after the end of VH CDR1, being usually preceded by the sequence motif LEWIG (Figure 1). The typical length is 16–19 residues (21). Despite the efforts to obtain complete sequence coverage of the variable region, it was not possible to elucidate the amino acid composition of the region VH(61–80) using LC-MS/MS, assuming a length of 19 residues.
Figure 2.
Fragment mass spectrum of the precursor ion of m/z 531.278 (2+) from the heavy chain tryptic digest assigned by de novo interpretation to the CDR2 peptide VH(51–59), indicated at the top (right). Internal fragments are indicated between square brackets. The asterisk (*) denotes loss of ammonia. The empty circle (○) denotes loss of water.
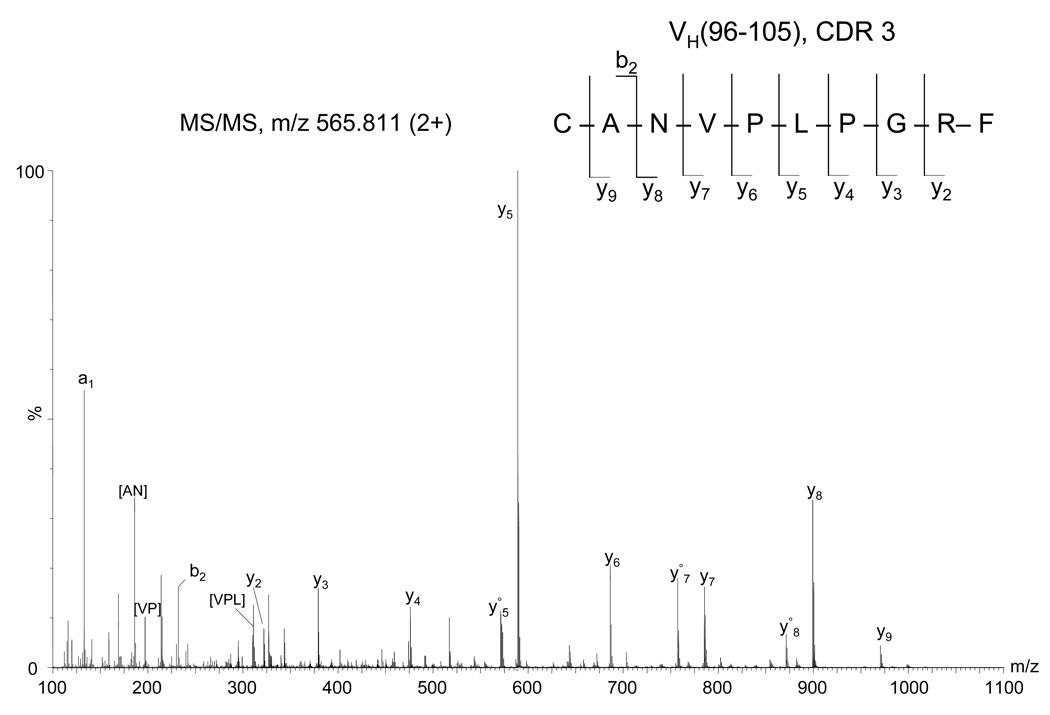
The sequence information for VH(99–107) CDR3 was determined from the MS/MS spectra of the doubly charged precursor ions of m/z 565.811 (Figure 3) observed in the chymotryptic digest and m/z 864.952 observed in the trypsin digest (Supporting information). The MS/MS fragmentation of the (M+2H)2+ ion of 565.811 is consistent with the peptide sequence CANVPLPGRF containing an alkylated cysteine, as determined by the observation of a nearly complete series of y ions (except for y1). This amino acid sequence was not found in the database, but is similar to other heavy chain CDR3 amino acid sequences (accession number AAG25671). This information suggests that this peptide can be assigned as the CDR3 peptide. Usually, the VH CDR3 begins three residues after a cysteine (a typical sequence motif is CAR) and is followed by the motif WGXG (X can be any amino acid), while it may contain from 3 up to 25 residues (21). According to this Kabat definition, the residues before the VH CDR3 of the 6E10 are CAN, those after are WGQG and the determined length is of nine amino acids (Figure 1).
Figure 3.
Fragment mass spectrum of the precursor ion of m/z 565.811 (2+) from the heavy chain chymotryptic digest assigned by de novo interpretation to the CDR3 peptide VH(98–107), indicated at the top (right). The cysteine was observed in alkylated form. Internal fragments are indicated between square brackets. The empty circle (○) denotes loss of water.
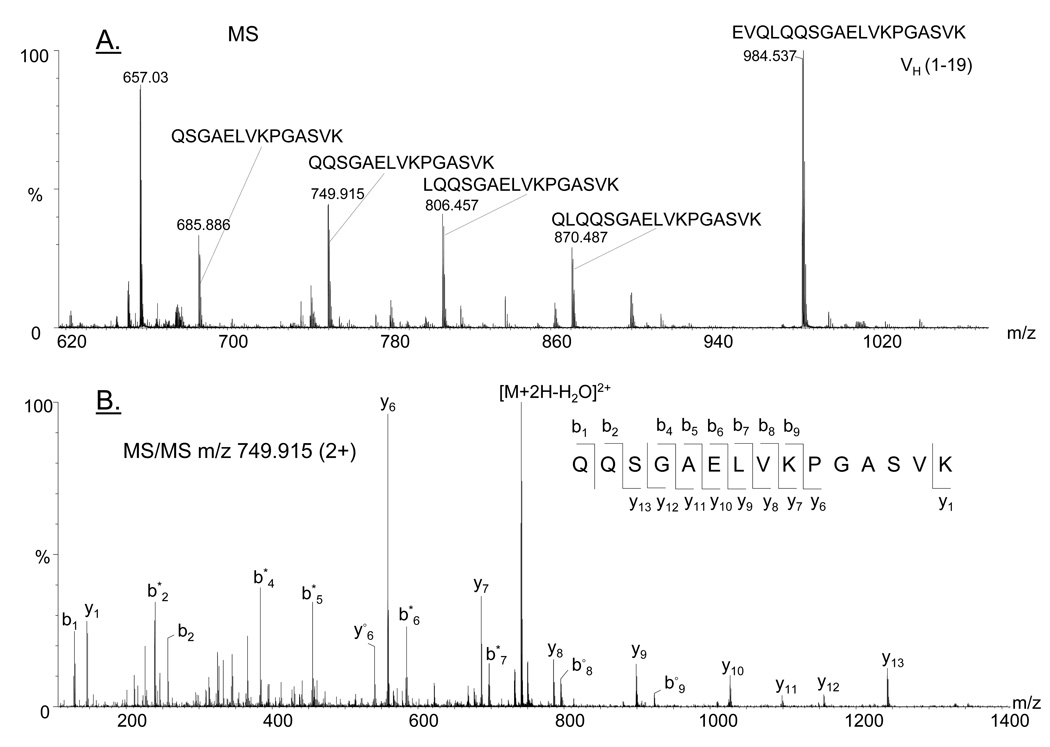
In the tryptic digest of one lot of the 6E10 antibody, heterogeneity at the N-terminus of the heavy chain was observed. In addition to the full length N-terminal tryptic peptide (1EVQLQQSGAELVKPGASVK19 m/z 984.537 (2+)), many other doubly-charged ions were observed which correspond in mass to the successive loss of two (m/z 870.487), three (m/z 806.457), four (m/z 749.915), five (m/z 685.886) and six amino acids (m/z 621.857) from the heavy chain N-terminus. The averaged mass spectrum comprising these ions and the peptides assigned to each ion are shown in Figure 4A. The MS/MS spectrum for each of these ions is consistent with the assigned peptide structures. One example is illustrated in Figure 4B and shows the fragment ion spectrum of the precursor ion of m/z 749.915 (2+). The specific product ions (b and y series) and the mass of the precursor ion enabled the unambiguous identification of the truncated peptide, 5QQSGAELVKPGASVK19, which arises from the loss of the first four amino acids from the N-terminus of the heavy chain. These data suggest that, in addition to the well documented C-terminal lysine clipping (28), antibodies may possibly undergo N-terminal degradation as well. Since this phenomenon was observed only in one out of three antibody lots, which was not analyzed by Edman sequencing, the observed N-terminal truncations may arise from non-enzymatic degradation pathways which may be relevant if such a recombinant antibody were investigated as a potential therapeutic agent.
Figure 4.
(A) Positive ion MS spectrum showing the doubly charged ions and the corresponding tryptic peptides assigned to each mass, which indicate N-terminal truncation of the heavy chain; (B) MS/MS of the precursor ion of m/z 749.915 (2+), confirming the indicated peptide sequence. The asterisk (*) denotes loss of ammonia. The empty circle (○) denotes loss of water.
In addition to N-terminal truncation it was observed that 7% of the heavy chain had undergone terminal pyroglutamic acid (pyro-Glu) formation, based on the relative abundances of the ions observed for the native (EVQLQQSGAELVKPGASVK, m/z 984.537, 2+) and modified peptide (pEVQLQQSGAELVKPGASVK, m/z 975.532, 2+) (data not shown). The observation that the tryptic peptide containing the pyro-Glu residue elutes slightly later (39.55 min) than the native peptide (35.21 min) is in agreement with data published by other groups (29–31). Pyro-Glu formation in antibodies and its identification by MS have been described previously (29–31) and is believed to be an artifact that arises via non-enzymatic pathways after prolonged storage of the samples at high temperature (45°C) and low pH conditions (pH 4). In fact, pyroglutamate can form in almost all proteins containing glutamic acid at the N-terminus.
Primary structure determination of the 6E10 light chain
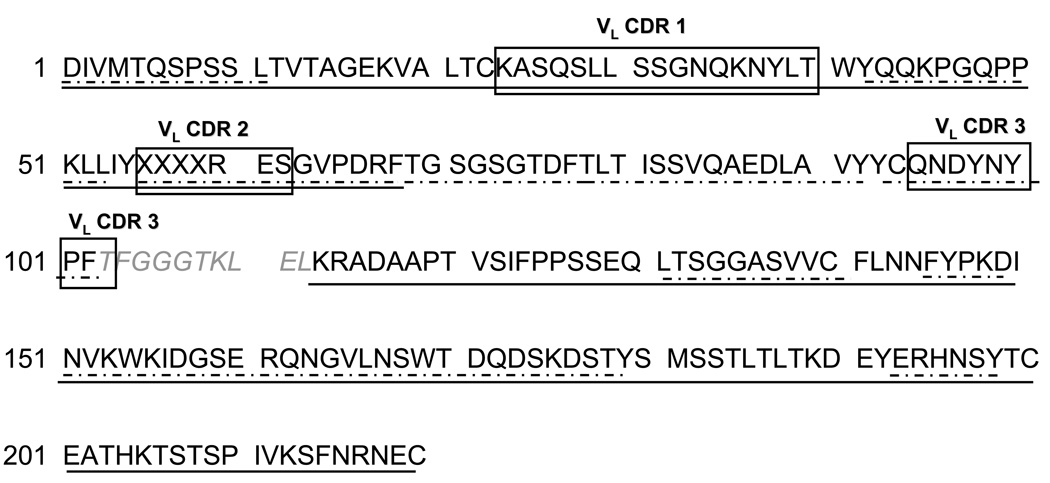
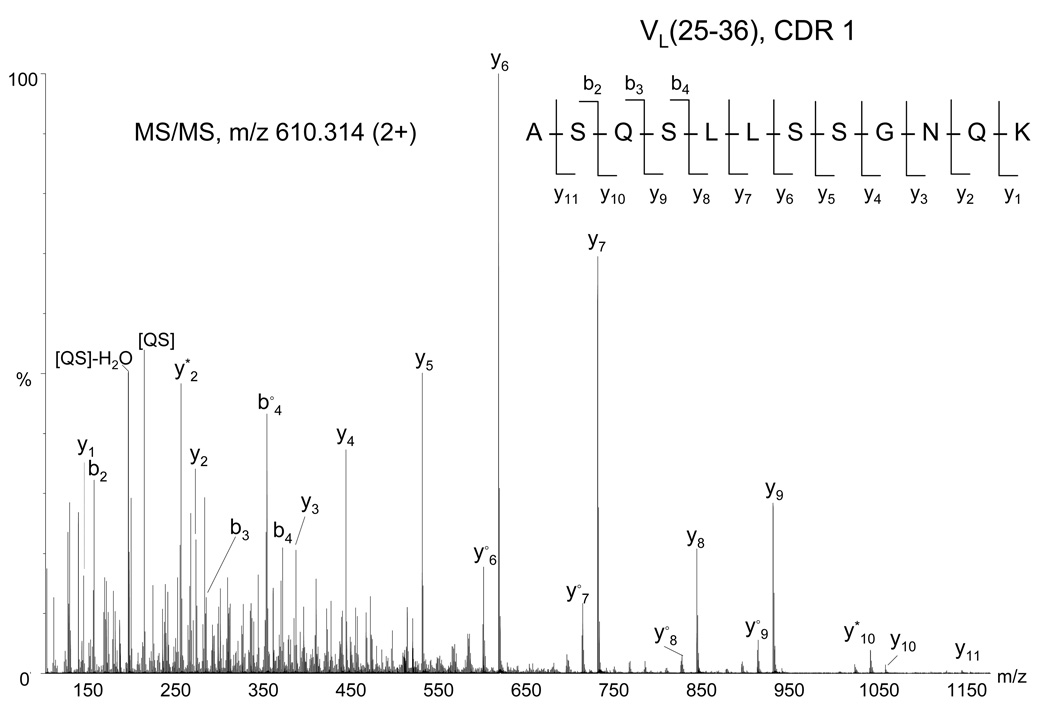
The amino acid sequence for the light chain of 6E10 is presented in Figure 5, for which the calculated sequence coverage was 95%. Analogous to our approach to sequence identification for the heavy chain, the peptides from the 6E10 light chain were inserted into a template light chain sequence from the database (accession number AAA39162). Light chains usually contain 220 residues, comprised of the N-terminal variable region (VL, approximately 110 amino acids) and a C-terminal κ or λ constant region (CL, 110 amino acids). The complementary determining regions (CDRs) were matched using the Kabat rules (20,21) and their positions are marked with black boxes in Figure 5. The constant region CH (113–220) was completely determined from MS/MS data, and showed that the light chain of 6E10 is a κ chain. A peptide from the variable region, corresponding to the region VL(103–112) remained unelucidated, despite the use of alternative enzymes. The abundance of the ion m/z 628.803 (2+), assigned to the peptide VL(69–81) was too low and provided insufficient MS/MS fragmentation, however, the observed C-terminal (y1, y2) and N-terminal ions (b1, b2), as well as the mass accuracy of 3 ppm of the experimental mass are consistent with the identification. This peptide is a feasible candidate for the region VL(69–81), as the four amino acids at the C-terminus, TLTI (Figure 5 and Table 2 in Supporting Information), are overlapping with those observed at the N-terminus in the peptide VL(78–89). MS analyses of the trypsin digest provided 100% sequence coverage of the constant region. Both enzymes provided complementary information for the variable region, indicating the region VL(68–102), determined from the MS/MS data of the chymotryptic digest, lacks potential trypsin cleavage sites. Upon analyzing the sequence of a large number of antibody light chains in the database, it was observed that the VL(103–110) region may contain a considerable number of potential chymotrypsin cleavage sites and this could explain why no peptides of comparable length were observed in our LC/MS experiments. In addition, a single potential trypsin cleavage site is located at the C-terminal of VL (103–110) (residue 109, Figure 5) and this could explain the lack of the short region (110–113) in the MS. The amino acid residues spanning the VL(25–36) CDR1 were not identified from the database search of the MS/MS data, suggesting that the corresponding protein sequence may not be contained in the NCBInr protein database and/or the ion corresponding to this region was not selected for MS/MS analyses. Manual interpretation of the MS/MS data of the ion of m/z 610.314 (2+) (Figure 6), however, revealed an amino acid sequence of a tryptic peptide resembling the CDR1 containing region VL(25–36) based on its homology to other mouse light chains (NCBI accession number ABK64007). These data enabled the determination of the peptide sequence ASQS(L/I)(L/I)SSGNQK based on the observation of a complete y ion series and a partial b ion series. Because Ile and Leu have the same mass, these amino acids could not be discriminated from the MS/MS spectrum. The amino acid sequence corresponding to the VL(97–102) CDR 3 was ascertained from the database search using the MS/MS spectrum of the (M+2H)2+ ion of m/z 611.240, which is consistent with the peptide sequence CQNDYNYPF, where the Asn99 residue was assigned as deamidated and the cysteine at the N-terminus in alkylated form. According to the Kabat rules (21), the VL CDR1 may have a length between 10 and 17 residues and is preceded by the first cysteine of the variable region (Cys23) and followed by the sequence motif WYQ. The VL CDR3 starts also after a cysteine and is followed by the residues FGXG, where X can be any amino acid. The VL CDR1 of the 6E10 antibody contains the maximal number of amino acids according to the Kabat definition (see Figure 5). The VL CDR3 fits the definition as well, however, the identity of the amino acid at the C-terminus could not be confirmed from the MS/MS.
Figure 5.
Amino acid sequence determined for the 6E10 antibody light chain. The CDRs are highlighted with black boxes; —— regions identified using trypsin; –·–·– regions identified using chymotrypsin. X represents amino acid variations observed in the light chain. The amino acids in italics were fitted in the light chain sequence based on homology with other antibody light chain sequences (database accession number AAA39162)
Figure 6.
Fragment mass spectrum of the precursor ion of m/z 610.314 (2+) from the light chain tryptic digest assigned by de novo interpretation to the CDR1 peptide VL(25–36), indicated at the top (right). Internal fragments are indicated between square brackets. The asterisk (*) denotes loss of ammonia, the empty circle (○) denotes loss of water.
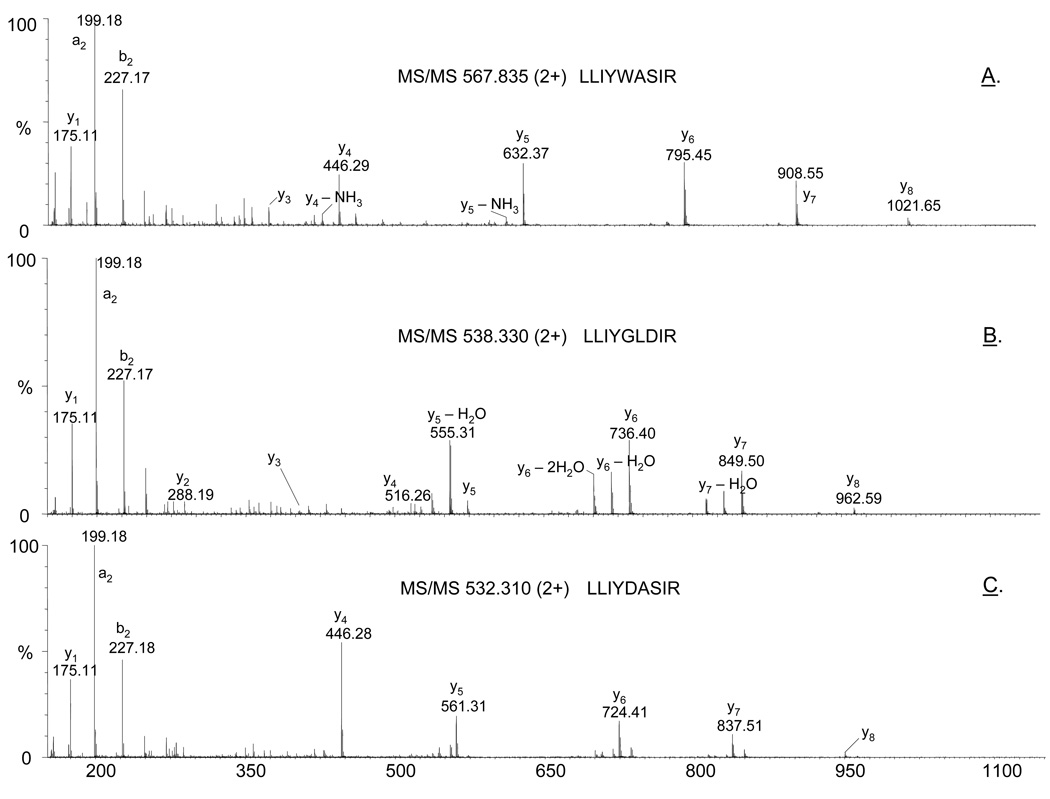
Interestingly, the MS analyses of the digests of the light chain of 6E10 revealed microheterogeneity in the second complementary determining region CDR2 corresponding to VL(52–60). Eight different tryptic peptides were observed by LC/MS/MS which contain the amino acid motif LLIYXXXXR, where X indicates the possible variations (Table 1). Representative MS/MS spectra of three of these ions are shown in Figure 7. Because these peptides are identical at their N-termini (Leu–Leu–Ile–Tyr-), their fragmentation patterns are very similar with the most abundant product ions belonging to the y series of ions. Two diagnostic product ions observed in the CID spectra of all these ions, m/z 199.175 (a2) and m/z 227.176 (b2), are specific for Leu-Leu N-terminal sequence. The observation of these ions in the MS/MS data was used to identify as many variants as possible of different precursor ions. Ions which produced these fragment ions upon MS/MS analyses are shown in Table 1. Based on manual interrogation of the MS/MS data and/or a subsequent search of the NCBInr database (taxonomy: all species), the peptide sequences were assigned. Of the determined amino acid sequence, the peptide sequence LLIYDASIR was found in human antibody light chains, but not in mouse antibodies. The same set of tryptic peptides was found in all three analyzed antibody batches, suggesting that this observed microheterogeneity was not an isolated random event. We hypothesize that this structural diversity may be due to somatic hypermutations in Ig VL genes observed at the protein level.
Table 1.
Amino acid sequence of peptides from antibody light chain variable region VL (52–60), identified in the LC/MS/MS analysis of the light chain tryptic mixture
| Peptide No. |
Peptide sequence a LLIYXXXXR |
Observed mass (Da) |
Calculated mass (Da) |
Mass accuracy (ppm) |
|---|---|---|---|---|
| 1 | LLIYDASIR | 1062.6046 | 1062.6073 | 3 |
| 2 | LLIYGLDIR | 1074.6450 | 1074.6437 | 1 |
| 3 | LLIYWASTR | 1121.6174 | 1121.6233 | 5 |
| 4 | LLIYWASIR | 1133,6540 | 1133.6597 | 5 |
| 5 | LLIYWSSTR | 1137.6058 | 1137.6182 | 11 |
| 6 | LLIYWVSTR | 1149.6492 | 1149.6546 | 5 |
| 7 | LLIYKVSYR | 1153.6800 | 1153.6859 | 9 |
| 8 | LLIYWDSTR | 1165.6168 | 1165.6132 | 3 |
Peptide sequences identified by database search performed with the MS/MS data; X represents the observed amino acid variations which are underlined within each peptide.
Figure 7.
Representative product ion spectra of the precursor ions: (A) m/z 567.835 (2+), (B) m/z 538.330 (2+), and (C) 532.310 (2+), confirming the amino acid sequence of three peptides spanning the light chain region VL(52–60).
N-terminal Edman Sequencing
The N-terminal sequences and homogeneity of the 6E10 antibody heavy and light chains were determined by Edman sequencing using a standard PVDF Edman sequencing protocol. Overall, the N-terminal 22 residues for the light chain and the N-terminal 24 residues for the heavy chain were unambiguously identified and this data was consistent with the sequence information derived from the MS/MS analysis. The N-terminal amino acids for both the heavy and light chain were determined to be unmodified, suggesting that no significant pyroglutamic acid formation had occurred. These data demonstrated the N-terminal homogeneity of the anti-Aβ(1–17) monoclonal antibody.
Characterization of the N-linked glycosylation of the heavy chain
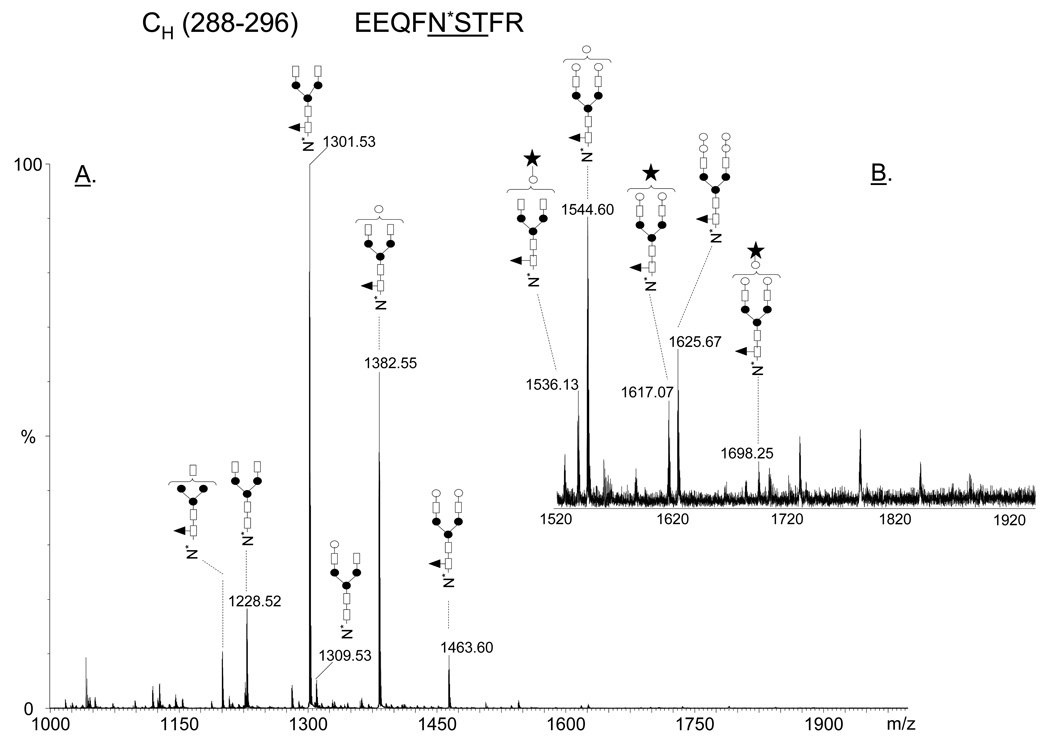
The major glycoforms observed at the conserved N-glycosylation site of the heavy chain constant region Asn292, observed in the glycopeptide EEQFNSTFR, are shown in Figure 8. The glycopeptides eluted earlier from the reversed phase column than the unmodified peptides and were easily identified by LC-MS based on the mass interval of 81 amu between doubly charged glycopeptide ions, which is an indicative of the presence of terminal hexose residues. A detailed analysis of the glycosylation pattern of the 6E10 antibody compared to other Aβ-antibodies is presented elsewhere (I. Perdivara et al., manuscript in preparation). The most abundant glycan populations decorating the heavy chain at Asn292 were found to be core fucosylated, biantennary, complex type structures containing zero to two galactose residues. Low amounts of core-fucosylated tri- and tetragalactosyl glycoforms, with the third and the fourth galactose residues probably α-linked to the GlcNAc-β(1–4)Gal moiety, as well as minimal amounts of N-glycolyl neuraminic acid were observed. The glycosylation pattern observed for the 6E10 antibody is consistent with the structures previously described for various recombinant monoclonal antibodies (32).
Figure 8.
Positive ion nHPLC/ESI/MS of the Fc glycopeptides EEQFN*STFR from the mouse monoclonal antibody 6E10; (A) MS spectrum averaged over the chromatographic window where glycopeptides eluted (30.6 min, average of 15 full MS scans). The glycan structures of the most abundant glycoforms are indicated above each ion. All ions are doubly charged; (B) Insert in the mass range m/z 1520–1920, showing low abundant di-, tri- and tetragalactosylated glycoforms. Color code: empty square – N-acetylglucosamine; black triangle – fucose; black circle – mannose; empty circle – galactose; black star – N-glycolyl neuraminic acid.
Discussion
Characterization of the amino acid sequence and structural integrity of recombinant or hybridoma derived monoclonal antibodies is becoming increasingly important, e.g. for the development of antibodies in the biotechnology and pharmaceutical industry. Modifications at the protein level resulting from the use of a specific expression system, or after prolonged storage of an antibody, might alter its antigen specificity, effector functions and/or in vivo half life, factors which are of concern in developing a potential therapeutic agent. In addition, antigen-antibody crystal structures are only rarely available and thus the knowledge of the antigen binding regions of an antibody essentially contribute to a better understanding of their interactions.
Primary structure determinations of recombinant immunoglobulins can be accomplished using mass spectrometric “top-down” or “bottom-up” approaches, because of the major advantage that the expected protein sequence can be derived from the cDNA information (29,33). However, the potential changes in protein sequences mentioned above can greatly complicate the data interpretation. For mass spectrometry, a particular challenge is the complete characterization of an antibody primary structure for which no cDNA information is available, i.e. when the antibody was produced in hybridoma. When genomic material can be obtained, the protein sequence can be derived from nucleotide sequencing (34). However, in many cases this information is not available, e.g. if the antibody was obtained from mouse ascites.
In the present work, we have used liquid chromatography coupled to mass spectrometry in an effort to elucidate the amino acid sequence of an anti-β-amyloid (1–17) mouse monoclonal antibody. Of particular interest were the assemblies of amino acids in the antibody complementary determining regions, as they represent the key structures of the antigen-antibody recognition. The cDNA information for the commercially available 6E10 antibody was not provided. The success of such an experiment may depend on the MS methodology available, but also on the original amino acid sequence of the antibody.
The structural diversity of immunoglobulins, derived from site specific recombination and affinity maturation make the identification of a complete antibody sequence by peptide mass mapping and data base searching extremely difficult. In addition, variable and constant regions of heavy and light chains sometimes have different database entry numbers. De novo sequencing based on MS/MS data is most often used to determine the amino acid sequences of peptides whose MS/MS data do not match known sequences. Therefore, we have undertaken characterization of the amino acid sequence of mAb 6E10 by MS/MS. High specificity of proteases, chromatographic resolution and quality of MS/MS data were prerequisites for this approach.
Based on sequence homology, the peptides identified by database search of the MS/MS data were fit to known sequence frames for antibody heavy and light chains. For the light chain of 6E10, a coverage of 95% was achieved, while for the heavy chain the coverage was 82%. The incomplete assignment might be related to several issues: (i), the protein sequence lacks potential cleavage sites for a specific enzyme, leading to formation of long peptides; or too many cleavage sites, leading to singly charged fragment ions which can be obscured by the chemical noise in the lower m/z range of the mass spectrometer; (ii), large peptides may be extracted from the gel after enzymatic digestion with poor efficiency; or, (iii), the division of ion abundance between multiple charge states reduces the abundance of any one charge state to the point that interpretable MS/MS data is not obtained; (iv), the peptide sequences generated by enzymatic digestion may not be contained in protein databases, and in this case, sufficient ionization of the peptide, generation of specific backbone cleavages in CID and high quality MS/MS spectra are important prerequisites for a successful de novo interpretation.
Although it was not possible to obtain 100% sequence coverage for the 6E10 antibody, the determination of partial or complete sequence of the complementary determining regions was successful. Four of the six CDRs (VH-CDR1, VH-CDR3, VL-CDR1 and VL-CDR2) were completely elucidated, while only one amino acid remained unelucidated of the VL-CDR3. Only partial sequence information could be disclosed for the CDR2 of the heavy chain. The peptides determined for heavy chain CDR1 and light chain CDR2 and CDR3 regions were identified directly by searching the MS/MS data against the NCBInr protein database, while those spanning the heavy chain CDR2 and CDR3 and the light chain CDR1 were determined by means of manual de novo interpretation of the data and were not found in any other antibody sequence in the protein database.
Although the N-terminal Edman sequencing confirms the monoclonal nature of the 6E10 antibody for the first 25–30 amino acids and did not identify truncations, extended sequence microheterogeneities were determined for the VL(52–60) region, comprising the partial CDR2 between the residues (56–60). (see Table 1). These were the only sequence microheterogeneities observed for both heavy and light chains, but it is possible that this phenomenon also occurs at other amino acid positions from the variable region. The microheterogeneity found in the monoclonal antibody light chain may result from point mutations which occur at the DNA level, termed somatic hypermutation (SHM) (reviewed in (23)). It is accepted that SHMs occur in mature B-cells during affinity maturation in secondary lymphoid organs (germinal centers) (35), and whether this mechanism might still occur in a later phase of B-cells, for example in hybridomas, is a point of controversy. Our data indicates that SHM might occasionally take place in hybridoma cells, but this hypothesis needs to be investigated in more detail. To our knowledge, this is the first mass spectrometric evidence of potential modifications at the DNA level directly from isolated protein data.
In conclusion, we demonstrate the utility of liquid chromatography– tandem mass spectrometry to successfully address the question of immunoglobulin sequence determination, and to reveal unexpected features of the primary structure of the 6E10 anti-Aβ- antibody.
Supplementary Material
Acknowledgements
This research was supported in part by grants from the Deutsche Forschungsgemeinschaft, Bonn, Germany, and the University of Konstanz (M.P.), and the Intramural Research Program of the NIH, National Institute of Environmental Health Sciences (K.T.). The authors want to thank Dr. Marilyn Diaz for informative discussions throughout the project, as well as for the critical review of the manuscript.
References
- 1.Schenk DB, Seubert P, Grundman M, Black R. Neurodegener Dis. 2005;2(5):255–260. doi: 10.1159/000090365. [DOI] [PubMed] [Google Scholar]
- 2.Selkoe DJ. Physiol Rev. 2001;81(2):741–766. doi: 10.1152/physrev.2001.81.2.741. [DOI] [PubMed] [Google Scholar]
- 3.McLaurin J, Cecal R, Kierstead ME, Tian X, Phinney AL, Manea M, French JE, Lambermon MH, Darabie AA, Brown ME, Janus C, Chishti MA, Horne P, Westaway D, Fraser PE, Mount HT, Przybylski M, St George-Hyslop P. Nature Med. 2002;8(11):1263–1269. doi: 10.1038/nm790. [DOI] [PubMed] [Google Scholar]
- 4.Check E. Nature. 2002;415(6871):462. doi: 10.1038/415462a. [DOI] [PubMed] [Google Scholar]
- 5.Goldenberg MM. Clin Ther. 1999;21(2):309–318. doi: 10.1016/S0149-2918(00)88288-0. [DOI] [PubMed] [Google Scholar]
- 6.Grillo-Lopez AJ, White CA, Varns C, Shen D, Wei A, McClure A, Dallaire BK. Semin Oncol. 1999;26(5) Suppl 14:66–73. [PubMed] [Google Scholar]
- 7.Chung KF. Curr Opin Investig Drugs. 2002;3(8):1157–1160. [PubMed] [Google Scholar]
- 8.Kohler G, Milstein C. Nature. 1975;256(5517):495–497. doi: 10.1038/256495a0. [DOI] [PubMed] [Google Scholar]
- 9.Terai K, Iwai A, Kawabata S, Tasaki Y, Watanabe T, Miyata K, Yamaguchi T. Neuroscience. 2001;104(2):299–310. doi: 10.1016/s0306-4522(01)00095-1. [DOI] [PubMed] [Google Scholar]
- 10.Maddalena AS, Papassotiropoulos A, Gonzalez-Agosti C, Signorell A, Hegi T, Pasch T, Nitsch RM, Hock C. Neurodegener Dis. 2004;1(4–5):231–235. doi: 10.1159/000080991. [DOI] [PubMed] [Google Scholar]
- 11.Tian X, Cecal R, McLaurin J, Manea M, Stefanescu R, Grau S, Harnasch M, Amir S, Ehrmann M, St George-Hyslop P, Kohlmann M, Przybylski M. Eur J Mass Spectrom (Chichester, Eng) 2005;11(5):547–556. doi: 10.1255/ejms.722. [DOI] [PubMed] [Google Scholar]
- 12.Przybylski M, McLaurin J, Cecal R-E, Kierstead ME, Tian X, Janus C, Horne P, Westaway D, Fraser PE, St George Hyslop P. J. Peptide Sci. 2002;8:73–75. [Google Scholar]
- 13.Van Regenmortel MH. Mol Immunol. 1988;25(6):565–567. doi: 10.1016/0161-5890(88)90078-8. [DOI] [PubMed] [Google Scholar]
- 14.Amit AG, Mariuzza RA, Phillips SE, Poljak RJ. Science. 1986;233(4765):747–753. doi: 10.1126/science.2426778. [DOI] [PubMed] [Google Scholar]
- 15.Paterson Y, Englander SW, Roder H. Science. 1990;249(4970):755–759. doi: 10.1126/science.1697101. [DOI] [PMC free article] [PubMed] [Google Scholar]
- 16.Macht M, Fiedler W, Kurzinger K, Przybylski M. Biochemistry. 1996;35(49):15633–15639. doi: 10.1021/bi961727w. [DOI] [PubMed] [Google Scholar]
- 17.Fenn JB, Mann M, Meng CK, Wong SF, Whitehouse CM. Science. 1989;246(4926):64–71. doi: 10.1126/science.2675315. [DOI] [PubMed] [Google Scholar]
- 18.Hillenkamp F, Karas M, Beavis RC, Chait BT. Anal Chem. 1991;63(24):1193A–1203A. doi: 10.1021/ac00024a002. [DOI] [PubMed] [Google Scholar]
- 19.Srebalus Barnes CA, Lim A. Mass Spectrom Rev. 2007;26(3):370–388. doi: 10.1002/mas.20129. [DOI] [PubMed] [Google Scholar]
- 20.Kabat EA, Wu TT. J Immunol. 1991;147(5):1709–1719. [PubMed] [Google Scholar]
- 21.Kabat EAWT, Reid-Miller M, Perry HM, Gottesman KS. Sequences of proteins of immunological interest. 4th Ed. Bethesda: Department of Health and Human Services; [Google Scholar]
- 22.Tonegawa S. Nature. 1983;302(5909):575–581. doi: 10.1038/302575a0. [DOI] [PubMed] [Google Scholar]
- 23.Di Noia JM, Neuberger MS. Annu Rev Biochem. 2007 doi: 10.1146/annurev.biochem.76.061705.090740. [DOI] [PubMed] [Google Scholar]
- 24.Higgins LM, McDonald SA, Whittle N, Crockett N, Shields JG, MacDonald TT. J Immunol. 1999;162(1):486–493. [PubMed] [Google Scholar]
- 25.Malmstrom V, Shipton D, Singh B, Al-Shamkhani A, Puklavec MJ, Barclay AN, Powrie F. J Immunol. 2001;166(11):6972–6981. doi: 10.4049/jimmunol.166.11.6972. [DOI] [PubMed] [Google Scholar]
- 26.Pham V, Henzel WJ, Arnott D, Hymowitz S, Sandoval WN, Truong BT, Lowman H, Lill JR. Anal Biochem. 2006;352(1):77–86. doi: 10.1016/j.ab.2006.02.001. [DOI] [PubMed] [Google Scholar]
- 27.Johnson A. Molecular Biology of the Cell. 4th Ed. Garland Science: 2002. [Google Scholar]
- 28.Harris RJ. J Chromatogr A. 1995;705(1):129–134. doi: 10.1016/0021-9673(94)01255-d. [DOI] [PubMed] [Google Scholar]
- 29.Beck A, Bussat MC, Zorn N, Robillard V, Klinguer-Hamour C, Chenu S, Goetsch L, Corvaia N, Van Dorsselaer A, Haeuw JF. J Chromatogr B Analyt Technol Biomed Life Sci. 2005;819(2):203–218. doi: 10.1016/j.jchromb.2004.06.052. [DOI] [PubMed] [Google Scholar]
- 30.Chelius D, Jing K, Lueras A, Rehder DS, Dillon TM, Vizel A, Rajan RS, Li T, Treuheit MJ, Bondarenko PV. Anal Chem. 2006;78(7):2370–2376. doi: 10.1021/ac051827k. [DOI] [PubMed] [Google Scholar]
- 31.Yu L, Remmele RL, Jr, He B. Rapid Commun Mass Spectrom. 2006;20(24):3674–3680. doi: 10.1002/rcm.2790. [DOI] [PubMed] [Google Scholar]
- 32.Sheeley DM, Merrill BM, Taylor LC. Anal Biochem. 1997;247(1):102–110. doi: 10.1006/abio.1997.2036. [DOI] [PubMed] [Google Scholar]
- 33.Hirayama K, Yuji R, Yamada N, Kato K, Arata Y, Shimada I. Anal Chem. 1998;70(13):2718–2725. doi: 10.1021/ac9712153. [DOI] [PubMed] [Google Scholar]
- 34.Shendure J, Mitra RD, Varma C, Church GM. Nat Rev Genet. 2004;5(5):335–344. doi: 10.1038/nrg1325. [DOI] [PubMed] [Google Scholar]
- 35.Muramatsu M, Sankaranand VS, Anant S, Sugai M, Kinoshita K, Davidson NO, Honjo T. J Biol Chem. 1999;274(26):18470–18476. doi: 10.1074/jbc.274.26.18470. [DOI] [PubMed] [Google Scholar]
Associated Data
This section collects any data citations, data availability statements, or supplementary materials included in this article.


