

Abstract
In cellular and molecular biomechanics, extensional stiffness of rod-like structures such as leukocyte microvilli can be easily measured with many techniques, but not many techniques are available for measuring their flexural stiffness. In this paper, we report a novel technique of measuring the flexural stiffness of rod-like structures. This technique is based on image deconvolution and, as an example, it was used for determining the flexural stiffness of neutrophil microvilli. The probes we used were 40-nm-diameter fluorescent beads, which were bound to the tips of neutrophil microvilli by anti-L-selectin antibody. The fluorescent images of the bead, which was positioned at the center of the cell bottom, were acquired with high magnification and long exposure time (3 s). Using a Gaussian function as the point spread function of our imaging system, we established a convolution equation based on Boltzmann’s law, which yields an analytical expression that relates the bead image profile to the flexural stiffness of the microvillus. The flexural stiffness was then obtained by the least squares regression. On average, the flexural stiffness was determined to be 7 pN/μm for single neutrophil microvilli. With the resolution of our imaging system, this technique can be used for measuring any flexural stiffness smaller than 34 pN/μm and it has great potential in single molecule biomechanics.
Keywords: biomechanics, microvillus, leukocyte, micropipette, point spread function, deconvolution
INTRODUCTION
Measuring extensional or flexural stiffness of various subcellular structures is essential for understanding cellular functions. Many methods have been developed for this purpose. They include the microneedle technique used for measuring the stiffness of individual hair bundles on the saccular hair cell of a bullfrog (1), the magnetic trap used for measuring the stiffness of a crystalline actin bundle (2), and the thermal fluctuation analysis (3–5), optical tweezers (6), and atomic force microscopy (7) used for measuring the stiffness of single actin filaments or microtubules. With the single particle tracking technique and micropipette manipulation, Lee and Discher measured the stiffness of the red cell skeleton (8). However, none of these methods is readily applicable to measuring very small flexural stiffness values such as that of single microvilli on live neutrophils.
Neutrophils are the most abundant leukocytes in the blood and they have numerous membranous projections called microvilli on their surfaces. Neutrophils usually circulate within the bloodstream. At the site of infection, they attach to the endothelium and roll on the endothelial surface, followed by firm adhesion to the vessel wall and transendothelial migration into infected tissue. The attachment and rolling are mainly mediated by three selectins and their ligands, which include L-selectin (CD62L) and P-selectin glycoprotein ligand-1 (PSGL-1 or CD162) on neutrophils and E-selectin and P-selectin on the endothelium. About 78% of L-selectin and 80% of PSGL-1 are expressed on the tips of microvilli (9, 10). In contrast, CD44, another adhesion molecule involved in neutrophil function, is only expressed on the non-microvillar region of the neutrophil surface (11). If L-selectin is expressed on the non-microvillar region of leukocytes instead of the microvillus tips, the number of rolling leukocytes will decrease by 4-fold (12).
The flexural stiffness of neutrophil microvilli is an essential parameter for studying neutrophil rolling. In the bloodstream, freely circulating neutrophils translate and rotate as spherical cells about 8.5 μm in diameter (13). Under the influence of shear stress exerted by the flowing blood, neutrophils may attach to the endothelium and begin to roll in apparent contact with the endothelial surface (14, 15). Each neutrophil has about 1100 microvilli on its surface, with an average microvillus length about 300 nm (9, 16). As a consequence of the abundance of microvilli on a neutrophil surface, when a neutrophil touches an endothelial cell, the initial contact point is very likely to be the tip of a microvillus. If a selectin bond forms between the microvillus and endothelium, the cell will experience an additional force that acts to restrain its free transport by the blood flow (14). This force can be visualized as concentrated at the microvillus tip with components along and perpendicular to its long axis. Thus, like a cantilever beam loaded at its free end, the microvillus will be bent and stretched simultaneously while the cell tumbles forward and makes another contact with the endothelium. The second contact is likely also to be at the tip of a microvillus whereupon the blood flow will cause the second adherent microvillus to be compressed and the first adherent microvillus to be stretched and bent. It is known that a neutrophil microvillus can be stretched as much as 250% of its original length, like a spring with a spring constant of about 43 pN/μm if the pulling force is between 17 pN and 45 pN (16). It is also known that a neutrophil microvillus can be bent with a flexural stiffness of ~7 pN/μm at small deformation (17). However, the technique used for obtaining this flexural stiffness has never been examined in detail.
Here, we present a detailed analysis of the technique developed for measuring the flexural stiffness of rod-like structures (17). This technique is modified from a method developed by Treacy et al. for measuring the Young’s modulus of carbon nanotubes (18, 19). In the method of Treacy et al, the image of a carbon nanotube is acquired by the transmission electron microscopy, and the image of the nanotube tip, blurred due to thermal agitation, is matched to the convoluted image computed from the image of the nanotube base. Instead of the transmission electron microscopy, the fluorescence microscopy needs to be used in our technique where live cell experiments are conducted. In addition, fluorescent nano-beads are used as probes, which were bound to the microvillus tip by anti-L-selectin antibody in our experiments. The images of the beads are acquired with long exposure time while the cell is held stationary. The flexural stiffness can be deconvolved by fitting the bead images to an analytical expression, which relates the intensity profile of the bead image to the flexural stiffness of the microvillus.
THEORY
We consider the image of the fluorescent bead which is bound to the tip of a microvillus as shown in Fig. 1. The bead is assumed to be in thermal equilibrium, and the equilibrium position is assumed to be the origin of two rectangular coordinate systems: (x, y) and (ξ, η). (x, y) represents a certain location in the bead image and (ξ, η) represents possible bead center locations during the acquisition of the bead image. The flexural stiffness of the microvillus is assumed to be K.
FIGURE 1.

Schematic diagram of bead imaging. The bead, a fluorescent nanosphere, is bound to the tip of a microvillus. The Cartesian coordinates (x, y) represents any point in the bead image. The Cartesian coordinates (ξ, η) represent the position of the bead center.
When the bead stays at position (ξ, η) for a time interval dt, its contribution to the intensity of the measured bead image is
| (1) |
where I is the bead image intensity, α is the emission intensity of the fluorescent bead, and G is the point spread function (PSF) of the microscope. According to Boltzmann’s law, the probability density of finding the bead at (ξ, η) is
| (2) |
where K (ξ2 + η2)/2 is the potential energy for bending the microvillus, κB is the Boltzmann constant, and T is the absolute temperature. If the exposure time (Te) for the bead image acquisition is long enough, the probability of finding the bead at (ξ, η) is
| (3) |
Substitution of Eq. 3 into Eq. 1 gives
| (4) |
Therefore,
| (5) |
where I0= αTe. We assume that the PSF at the focal point is a two-dimensional Gaussian function
| (6) |
where σ0 is a constant determined by the imaging setup. Substitution of Eqs. 2 and 6 into Eq. 5 gives
| (7) |
where the variance σ2 is
| (8) |
Integration of Eq. 7 yields
| (9) |
This is the image intensity profile for a bead whose equilibrium position is at the origin of the (x, y) coordinate system.
If the equilibrium position of the bead is at (x0, y0) instead of the origin of the coordinate system, Eq. 9 is replaced by
| (10) |
Equation 10 expresses the intensity profile of the image of a bead on the microvillus with axisymmetry. If the image has some background noise (B), the in-focus image intensity of the fluorescent bead on the microvillus tip should be expressed as
| (11) |
If the bead is on the cell body, where the flexural stiffness is so large that K → ∞, Eq. 11 reduces to a simplified expression as follows
| (12) |
MATERIALS AND METHODS
Sample preparation
The sample preparation has been described in detail previously (17). Briefly, we obtained human neutrophils by centrifuging a 50-μl sample of fresh human blood layered on 0.2 ml Ficoll-Hypaque density gradient (mono-poly resolving medium; MP Biomedicals, Aurora, OH) at 300×g for 15 min at room temperature (23–25°C). Cells were washed in Hanks’ balanced salt solution (HBSS; Sigma, St. Louis, MO) containing 25 mM HEPES (Sigma) and resuspended in BlockAid™ blocking solution (Molecular Probes, Eugene, OR). We bound fluorescent beads to neutrophils with mouse anti-human monoclonal antibodies. The beads were neutravidin-coated yellow-green fluorescent microspheres of 40 nm in diameter (Molecular Probes), which emit at 519 nm after excitation at 488 nm. The antibodies were biotinylated anti-CD62L (Ancell, Bayport, MN) for microvillus labeling and biotinylated anti-CD44 (BD Pharmingen, San Diego, CA) for non-microvillar cell body labeling. About eight bound fluorescent beads per neutrophil were observed after the microvillus labeling. Without the biotinylated antibodies, only two bound beads were observed on 50 cells. Therefore, the binding of the fluorescent beads to the neutrophils was specific. The neutrophils were fixed by formaldehyde (Sigma) after the cell body labeling. The fixed neutrophils were marked by Alexa Fluor 546 phalloidin (Molecular Probes) to distinguish the fixed cells from live cells.
Fluorescence microscopy
Both live neutrophils and fixed neutrophils were injected into an experimental chamber, which was filled with 50% autologous plasma/HBSS. The chamber was placed on the stage of a Nikon inverted microscope (Eclipse TE 200). A micropipette, with outer diameter of about 12 μm, was inserted into the chamber for holding the neutrophils. The micropipette tip was rested on the chamber bottom, and the micropipette body was glued to the microscope stage. A cell was aspirated onto the micropipette tip by a small suction pressure; on the cell a fluorescent bead was located at the center of the cell bottom, as shown in Fig. 2. After the cell was held stationary, the fluorescent bead on the cell bottom was ~2 μm above the chamber bottom.
FIGURE 2.
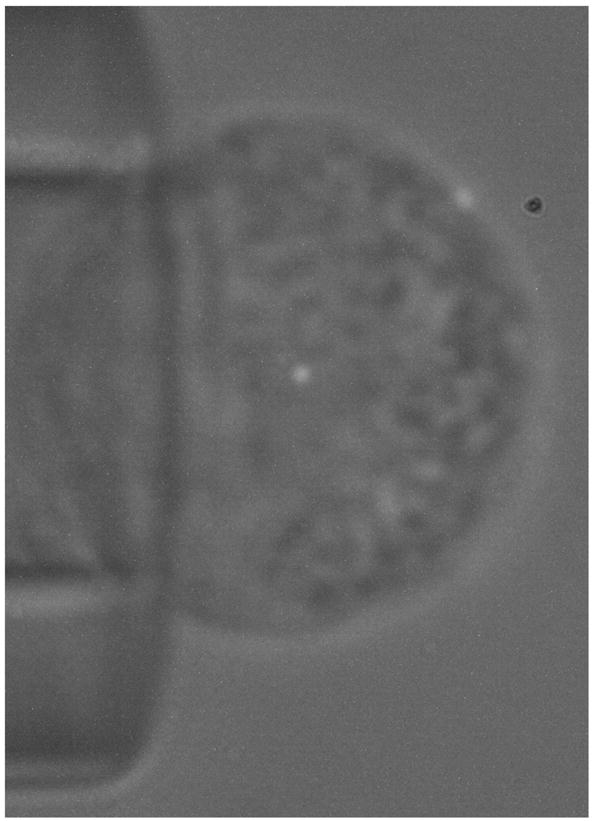
The typical image of a 40-nm fluorescent bead superposed on a human neutrophil bright-field image. The neutrophil was immobilized by being held with a micropipette affixed to the microscope stage. The fluorescent bead was at the center of the cell bottom.
We observed fluorescent beads through the Nikon microscope equipped with an oil immersion 100× Plan-Apo objective (numerical aperture = 1.4) and a Nikon B-2E/C filter set. The bead fluorescence was excited by a 100-W mercury arc lamp. Fixed cells were observed with the same epi-fluorescence microscopy but with a special filter set for Alexa Fluor 546. Bead images were projected onto a Zeiss digital camera (AxioCam MRm; Carl Zeiss, Thornwood, NY) through a zoom lens (Optem, Fairport, NY), and the image was monitored on a computer screen and recorded on a DVD. The exposure time of the camera was set to 3 s. For the bead on the bottom of an immobilized cell, each image was collected once its image showed that the bead was in focus. Five to nine images were obtained for each bead by repeating the bead focusing procedure followed by the image acquisition. Each cell was only used for one bead image acquisition in order to minimize the photobleaching effect. All images were obtained at room temperature, and the image scale was determined by a reticule to be 78 pixels per micrometer.
Deconvolution
The analysis of the bead images is based on a Gaussian point spread function. The PSF is defined as the intensity distribution of a point source of light in the imaging space. The image of a stationary fluorescent bead is considered as the PSF of the microscope in fluorescence microscopy if the bead diameter is less than 100 nm (20). For an optimized imaging system, the PSF is often approximated by a Gaussian function (21–24). For our microscope, the Gaussian function with circular symmetry was a good approximation to the measured PSF with correlation coefficients R > 0.99, as shown in Fig. 3.
FIGURE 3.
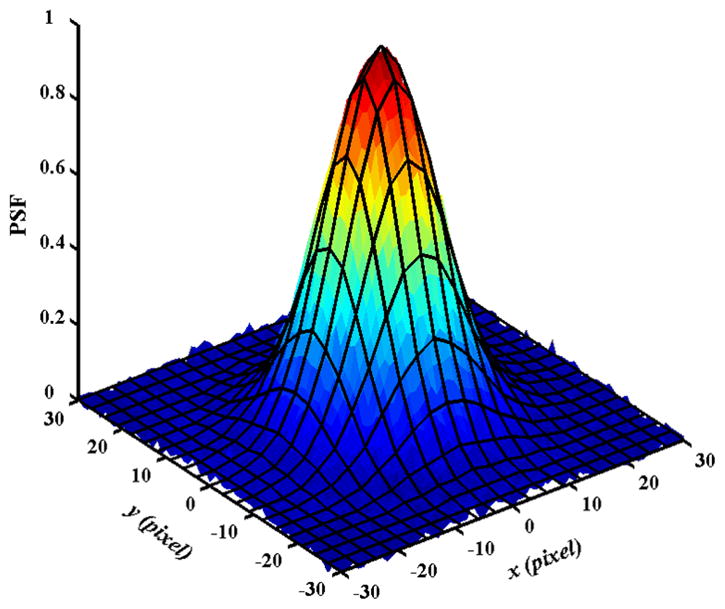
The point spread function (PSF) of our microscopic imaging system. The PSF was measured by averaging 25 bead images (20). The beads were on immobilized fixed neutrophils. The images were acquired with an exposure time of 3 s. The solid wireframe is a two-dimensional Gaussian fit with a correlation coefficient of 0.995.
We determined the parameter in the Gaussian function by fitting Eq. 12 to the images of the fluorescent beads on the fixed neutrophils. Here, the fixed cells were for in situ measurement of the PSF. The least-squares method was employed in the fitting with Matlab. The fitting parameters in Eq. 12 were I0, , B, x0 and y0. The beads on the fixed neutrophils were considered anchored tightly to the cell bodies. It was shown by single particle tracking that the beads were stationary after the fixed cells were immobilized by the micropipette. After obtaining , we determined the variance σ2 by fitting Eq. 11 to the images of the fluorescent beads on the live neutrophils. The fitting parameters in Eq. 11 were I0, σ2, B, x0 and y0. The fitting yielded a total of five to nine variances for each bead. Three or four variances that were close to each other were averaged to exclude any focusing effect. The flexural stiffness K was obtained by substituting the average variance into Eq. 8. Before the fitting, the bead images were analyzed to exclude those whose profiles did not have circular symmetry.
RESULTS
Measurement uncertainty
Our measurements rely on the PSF of the microscope, which is sensitive to such components of the experimental setup as refractive-index-mismatched medium and the coverslip (25). The refractive index mismatch between the experimental medium and immersion oil results in a broader PSF as the distance between the coverslip and focal plane increases (26). In addition, any slight variation in the coverslip thickness also results in a different PSF (25). To control the uncertainty from the individual coverslip, we calibrated the PSF in each experiment by using the fluorescent beads on the fixed cells. To control the uncertainty from the refractive index mismatch, we evaluated how the PSF parameter would change when the fluorescent bead was placed at different distances (d) from the coverslip that is in contact with the immersion oil of the microscope objective. As shown in Fig. 4, increased as d increased, which can be interpreted as the increased blurriness of the fluorescent bead image. For the range of d values studied, the relationship between d and is approximately linear as shown in Fig. 4. Therefore, if d varies by 1 μm, would vary by 710 nm2. In all the experiments described in the following sections, the difference among the bead-coverslip distances in each experiment did not exceed 0.5 μm (in most cases, it did not exceed 0.3 μm). In other words, only the beads that were within 0.5 μm from each other in the optical path were included in the measurements.
FIGURE 4.

Dependence of the PSF parameter on the distance between the bead and the coverslip (d). The linear regression yields .
Figure 5(a) shows the values of ten beads on fixed neutrophils. The difference among the distances from these beads to the coverslip was within 0.4 μm. Overall, the average of for all these beads is ~20×103 nm2 and the standard deviation is ~0.24×10³ nm2. If the variance σ2 of a bead is smaller than this standard deviation, this bead becomes indistinguishable from a bead on the fixed cells, as shown in Eq. 11. If we assume that any flexural stiffness that has a standard deviation larger than 0.24×10³ nm2 is measurable, our technique should allow us to measure any flexural stiffness that is smaller than 34 pN/μm.
FIGURE 5.

(a) The distribution of the values of the beads on some fixed neutrophils. (b) The apparent variance distribution in one typical experiment where ten beads were imaged: seven (Nos. 1–7) were bound to live neutrophils by anti-L-selectin and three (Nos. 8–10) were affixed to the cell bodies of fixed neutrophils by anti-CD44. The apparent variance β in Eq. 16 should be equal to when the beads were on fixed neutrophils.
Flexural stiffness of single neutrophil microvilli
In our image analysis, we first analyzed the circular symmetry of the bead images. If the flexural stiffness of the microvillus is assumed to be Kx in the x-axis and Ky in the y-axis, we obtain the following expression in place of Eq. 11
| (13) |
where and . Equation 13 expresses the intensity profile of the bead image with an elliptical shape. We use the following coordinate transformation for an actual bead image in case x and y are not aligned perfectly with the imaging axes
| (14) |
where x′ and y′ are the coordinates in the imaging plane, and θ is the angle between x′-axis and x-axis. Substitution of Eq. 14 into Eq. 13 yields the following equation
| (15) |
After fitting Eq. 15 to the bead images, we obtained the semimajor axis a and the semiminor axis b. We found that the relative difference between a and b was smaller than 4% for most of the beads on live neutrophils, indicating that these bead images were circularly symmetrical. Four beads were excluded from the data analysis because their relative differences between a and b were larger than 5%.
For each experiment, we analyzed the images of the fluorescent beads both on the live neutrophils and on the fixed neutrophils using the expression
| (16) |
where β is the apparent variance (AV), which equals if the fluorescent bead is on a microvillus tip and equals if the fluorescent bead is on a fixed cell. Figure 5(b) shows the distribution of the AVs of ten beads in a typical experiment, in which seven beads (Nos. 1–7) were bound to live neutrophils and the other three (Nos. 8–10) were affixed to the cell body of fixed neutrophils. Both the live and fixed cells were present in the experimental chamber. We obtained the PSF parameter by averaging the AVs of Nos. 8–10 beads.
We analyzed 105 fluorescent beads on live human neutrophils. After fitting Eq. 11 to the images of these beads, we obtained the flexural stiffness from Eq. 8. Figure 6 shows the distribution of 79 values of the flexural stiffness less than 34 pN/μm. Other 26 values of the flexural stiffness span a large range from 51 to 1.3×10⁸ pN/μm. We used the fluorescent beads as probes to measure the flexural stiffness of the microvilli. The fluorescent beads were bound to the live neutrophils by the anti-L-selectin antibody, which specifically bind to human L-selectin. The neutrophil expresses L-selectin constitutively either on its microvillus tips or on its cell body, and 78% of neutrophil L-selectin is located on the microvillus tips with 22% on the cell body (9, 27). Consequently, the fluorescent beads bound to the neutrophils should be either on the microvillus tips or on the cell bodies, and most of the beads must be on the microvillus tips. The cell body is much stiffer than the microvillus. The flexural rigidity of the cell body is six orders of magnitude larger than that of the microvillus because the microvillus is much thinner than the cell body (about two orders of magnitude difference in diameter). If the fluorescent bead was bound on the microvillus, the corresponding measurement of the flexural stiffness should be smaller. If the fluorescent bead was bound on the cell body, the corresponding measurement of the flexural stiffness should be larger. Therefore, those measurements shown in Fig. 6 are mainly the flexural stiffness of the neutrophil microvilli, and those between 51 and 1.3×10⁸ pN/μm are mainly the flexural stiffness of the cell bodies of the neutrophils. It is noteworthy that the values of the flexural stiffness of the cell body are not reliable quantitatively because these values are beyond our measurement resolution, and they simply represent that the σ2 values of the beads on the cell bodies are close to zero. By assuming that the stiffness distribution shown in Fig. 6 was a Poisson distribution and fitting the distribution to the Poisson function, the flexural stiffness of sinlge microvilli on human neutrophils was found to be 7 ± 3 pN/μm (mean ± standard deviation).
FIGURE 6.

The histogram of the flexural stiffness of single microvilli on human neutrophils. The solid curve represents a Poisson fit, which yields 7 ± 3 pN/μm (mean ± SD) for the flexural stiffness. The bin width is 2 pN/μm.
DISCUSSION
We successfully developed a novel technique of measuring the flexural stiffness of rod-like structures and measured the flexural stiffness of individual microvilli on human neutrophils. We bound the beads to the microvillar tips using specific antibodies and acquired the bead images with long exposure time. The images were blurred by thermal agitation with the scattering determined by the flexibility of the microvilli. The flexural stiffness was deconvolved from the images by the least squares regression. For our microscopic imaging system, we found that this deconvolution method was capable of measuring any flexural stiffness smaller than 34 pN/μm. In a way, this method is similar to the single particle tracking technique whereby sub-pixel tracking resolution can be achieved by utilizing an ensemble of pixels. We used high magnification to acquire the bead images, so one bead image covered more than 1000 pixels, as shown in Fig. 3. This ensemble of pixels allowed us to solve for the variance σ2with a standard deviation of ~240 nm2. Our measurements produced mean values of 7 pN/μm for neutrophil microvilli. Compared with the extensional stiffness of neutrophil microvilli at small loading rates, viz., 43 pN/μm (16), the flexural stiffness is much smaller. This indicates that leukocyte microvilli can be easily deformed by bending moments generated by physiological hemodynamic forces.
The measurements reported here relied on the use of long exposure time to obtain the bead images, contrary to the single particle tracking technique where a short exposure time is generally essential to capture the instantaneous positions of moving molecules or beads (28, 29). With conventional fluorescence microscopy, it is difficult to track a fluorescent bead bound to the microvillus tip with spatial nanometer resolution and sub-millisecond exposure times like those applied in laser tracking microrheology (30). Therefore, although we experimented with several other techniques, we eventually found success with the method already successfully employed for measuring the stiffness of carbon nanotubes (18).
In our experiments, 40-nm fluorescent beads were bound to the microvillus tip with anti-L-selectin antibodies. The typical size of an immunoglobulin G (IgG) is about 10 nm, so the center of the bead is likely ~40 nm (bead radius + IgG length + L-selectin length) away from the microvillus tip. Consequently, the actual fluctuation of the microvillus tip might be slightly smaller than what we measured and the flexural stiffness can be corrected correspondingly. If we assume that the microvillus is a continuous, isotropic, and homogeneous Hookean cylinder, the flexural stiffness of the microvillus can be expressed as
| (17) |
where R is the microvillus radius, L is its length, and E is the Young’s modulus. According to Eq. 17, the corrected flexural stiffness is 10 pN/μm if the average length of the neutrophil microvilli is 0.3 μm. However, electron micrographs showed that L-selectin distributes not only on the top of the microvillus, but also below the microvillus top (9, 27). Therefore, the average distance between the bead center and the top of the microvillus is probably smaller than the 40 nm used in the above correction and the effect of the molecular link on our measured flexural stiffness may be negligible.
To examine the effect of bead diffusion on measurements of the flexural stiffness, we measured the diffusion coefficient of the bound beads on the neutrophils and carried out a Monte Carlo simulation. After the anti-L-selectin-coated fluorescent beads were bound to the live neutrophils, the diffusion coefficient of the beads was measured to be 2 nm2/s (17). Therefore, these beads barely diffused during the 3-s exposure time in our experiments. This diffusion coefficient does not represent the diffusion of individual L-selectin on the neutrophil surface because multiple linkages between the bead and cell were most likely in our experiments. The effect of diffusion on measuring K was evaluated by a Monte Carlo simulation, where a bead with the image intensity profile shown in Eq. 12 was allowed to diffuse with the measured diffusion coefficient of 2 nm2/s. The resulted images after 3-s diffusion were analyzed with the same procedure as used for the images obtained by fluorescence microscopy. We found that the images obtained with Monte Carlo simulation yielded huge flexural stiffness values, as shown in Fig. 7, showing that the bead diffusion has minimal influence on the calculation of K in our experiments. It is worth to note that, even at a diffusion coefficient of 10 nm2/s, an average flexural stiffness of 374 pN/μm was obtained.
FIGURE 7.

The mean values (circle, ± SD) of simulated flexural stiffness (K) at different diffusion coefficients (D). In the Monte Carlo simulation, the beads were allowed to diffuse for 3 seconds to obtain the convolved bead images. These simulated images were analyzed with the same procedure as used for the images obtained by fluorescence microscopy to obtain the simulated flexural stiffness.
It is possible that the macromolecules on the neutrophils help limit the local diffusion of the fluorescent beads. On the microvillus tips, there are not only many L-selectins, but also many PSGL-1s and other molecules. L-selectin is anchored to the cytoskeleton through α-actinin (31), and its extracellular domain is about 15 nm long (32). In contrast, PSGL-1 is bound to the cytoskeleton through moesin (33), and its extracellular domain is about 50 nm long (34). Once a 40-nm bead is bound to the microvillus tip by anti-L-selectin, the bead is likely trapped in a “jungle” of macromolecules. In all likelihood, the bead is tethered not only by several L-selectins but also stabilized by such long molecules as PSGL-1. With all the molecules in the “jungle” working together, the bead should be fairly stable on the microvillus tip.
Since the development of various techniques for imposing piconewton scale forces to single cells and molecules, many extensional and compressional studies have been carried out (35). Flexural stiffness has been measured for many subcellular structures such as actin filaments and microtubules. However, no method has been found applicable to any subcellular structure on a live cell such as a neutrophil microvillus. The method developed in this study has great potential in the study of the flexural stiffness of other soft subcellular structures and biological macromolecules.
Acknowledgments
This work was supported by the National Institutes of Health (R01 HL069947 and R21/R33 RR017014).
References
- 1.Howard J, Hudspeth AJ. Proc Natl Acad Sci U S A. 1987;84:3064–3068. doi: 10.1073/pnas.84.9.3064. [DOI] [PMC free article] [PubMed] [Google Scholar]
- 2.Shin JH, Mahadevan L, So PT, Matsudaira P. J Mol Biol. 2004;337:255–261. doi: 10.1016/j.jmb.2004.01.028. [DOI] [PubMed] [Google Scholar]
- 3.Gittes F, Mickey B, Nettleton J, Howard J. J Cell Biol. 1993;120:923–934. doi: 10.1083/jcb.120.4.923. [DOI] [PMC free article] [PubMed] [Google Scholar]
- 4.Isambert H, Venier P, Maggs AC, Fattoum A, Kassab R, et al. J Biol Chem. 1995;270:11437–11444. doi: 10.1074/jbc.270.19.11437. [DOI] [PubMed] [Google Scholar]
- 5.Yanagida T, Nakase M, Nishiyama K, Oosawa F. Nature. 1984;307:58–60. doi: 10.1038/307058a0. [DOI] [PubMed] [Google Scholar]
- 6.Felgner H, Frank R, Schliwa M. J Cell Sci. 1996;109:509–516. doi: 10.1242/jcs.109.2.509. [DOI] [PubMed] [Google Scholar]
- 7.Kis A, Kasas S, Babic B, Kulik AJ, Benoit W, et al. Phys Rev Lett. 2002;89:248101–248104. doi: 10.1103/PhysRevLett.89.248101. [DOI] [PubMed] [Google Scholar]
- 8.Lee JCM, Discher DE. Biophys J. 2001;81:3178–3192. doi: 10.1016/S0006-3495(01)75954-1. [DOI] [PMC free article] [PubMed] [Google Scholar]
- 9.Bruehl RE, Springer TA, Bainton DF. J Histochem Cytochem. 1996;44:835–844. doi: 10.1177/44.8.8756756. [DOI] [PubMed] [Google Scholar]
- 10.Bruehl RE, Moore KL, Lorant DE, Borregaard N, Zimmerman GA, et al. J Leukoc Biol. 1997;61:489–499. doi: 10.1002/jlb.61.4.489. [DOI] [PubMed] [Google Scholar]
- 11.Fors BP, Goodarzi K, von Andrian UH. J Immunol. 2001;167:3642–3651. doi: 10.4049/jimmunol.167.7.3642. [DOI] [PubMed] [Google Scholar]
- 12.Von Andrian UH, Hasslen SR, Nelson RD, Erlandsen SL, Butcher EC. Cell. 1995;82:989–999. doi: 10.1016/0092-8674(95)90278-3. [DOI] [PubMed] [Google Scholar]
- 13.Ting-Beall HP, Needham D, Hochmuth RM. Blood. 1993;81:2774–2780. [PubMed] [Google Scholar]
- 14.Goldman AJ, Cox RG, Brenner H. Chem Engr Sci. 1967;22:653–660. [Google Scholar]
- 15.Alon R, Hammer DA, Springer TA. Nature. 1995;374:539–542. doi: 10.1038/374539a0. [DOI] [PubMed] [Google Scholar]
- 16.Shao JY, Ting-Beall HP, Hochmuth RM. Proc Natl Acad Sci U S A. 1998;95:6797–6802. doi: 10.1073/pnas.95.12.6797. [DOI] [PMC free article] [PubMed] [Google Scholar]
- 17.Yao DK, Shao JY. Phys Rev E (Statistical, Nonlinear, and Soft Matter Physics) 2007;76:021907–6. doi: 10.1103/PhysRevE.76.021907. [DOI] [PubMed] [Google Scholar]
- 18.Treacy MM, Krishnan A, Yianilos PN. Microsc Microanal. 2000;6:317–323. doi: 10.1007/s100050010037. [DOI] [PubMed] [Google Scholar]
- 19.Treacy MMJ, Ebbesen TW, Gibson JM. Nature. 1996;381:678–680. [Google Scholar]
- 20.McNally JG, Karpova T, Cooper J, Conchello JA. Methods. 1999;19:373–385. doi: 10.1006/meth.1999.0873. [DOI] [PubMed] [Google Scholar]
- 21.Izu LT, Wier WG, Balke CW. Biophys J. 1998;75:1144–1162. doi: 10.1016/s0006-3495(98)74034-2. [DOI] [PMC free article] [PubMed] [Google Scholar]
- 22.Littlefield R, Fowler VM. Biophys J. 2002;82:2548–2564. doi: 10.1016/S0006-3495(02)75598-7. [DOI] [PMC free article] [PubMed] [Google Scholar]
- 23.Michalet X, Lacoste TD, Weiss S. Methods. 2001;25:87–102. doi: 10.1006/meth.2001.1218. [DOI] [PubMed] [Google Scholar]
- 24.Santos A, Young IT. Appl Opt. 2000;39:2948–2958. doi: 10.1364/ao.39.002948. [DOI] [PubMed] [Google Scholar]
- 25.Inoue S, Spring KR. Video microscopy: the fundamentals. Plenum Press; New York: 1997. [Google Scholar]
- 26.Diaspro A, Federici F, Robello M. Appl Opt. 2002;41:685–690. doi: 10.1364/ao.41.000685. [DOI] [PubMed] [Google Scholar]
- 27.Erlandsen SL, Hasslen SR, Nelson RD. J Histochem Cytochem. 1993;41:327–333. doi: 10.1177/41.3.7679125. [DOI] [PubMed] [Google Scholar]
- 28.Ritchie K, Kusumi A. Methods in Enzymology. Academic Press; 2003. pp. 618–634. [DOI] [PubMed] [Google Scholar]
- 29.Saxton MJ, Jacobson K. Annu Rev Biophys Biomol Struct. 1997;26:373–399. doi: 10.1146/annurev.biophys.26.1.373. [DOI] [PubMed] [Google Scholar]
- 30.Yamada S, Wirtz D, Kuo SC. Biophys J. 2000;78:1736–1747. doi: 10.1016/S0006-3495(00)76725-7. [DOI] [PMC free article] [PubMed] [Google Scholar]
- 31.Pavalko FM, Walker DM, Graham L, Goheen M, Doerschuk CM, et al. J Cell Biol. 1995;129:1155–1164. doi: 10.1083/jcb.129.4.1155. [DOI] [PMC free article] [PubMed] [Google Scholar]
- 32.McEver RP. Glycoconj J. 1997;14:585–591. doi: 10.1023/a:1018584425879. [DOI] [PubMed] [Google Scholar]
- 33.Snapp KR, Heitzig CE, Kansas GS. Blood. 2002;99:4494–4502. doi: 10.1182/blood.v99.12.4494. [DOI] [PubMed] [Google Scholar]
- 34.Li F, Erickson HP, James JA, Moore KL, Cummings RD, et al. J Biol Chem. 1996;271:6342–6348. doi: 10.1074/jbc.271.11.6342. [DOI] [PubMed] [Google Scholar]
- 35.Shao JY, Xu G, Guo P. Front Biosci. 2004;9:2183–2191. doi: 10.2741/1386. [DOI] [PubMed] [Google Scholar]