Abstract
Contrary to the conventional assumption that humans perceive shapes of rigid objects as constant despite retinal-image variations caused by changes in orientation and position, we show that the depths of three-dimensional (3-D) textured shapes appear to vary when the image is rotated. In paired comparisons of static stimuli, depth amplitude was perceived to be greater at vertical than at oblique orientations. A similar oblique bias was found for simple two-dimensional (2-D) obtuse angles. Using projective geometry to link angle magnitude to the orientation flows that convey 3-D shape from texture cues, we show quantitatively that the 2-D bias predicts the 3-D bias. Our finding that perception of angular magnitude is dependent on orientation has broad implications for shape constancy because orientation flows have also been implicated in 3-D perception from reflections and shading, and contour curvature is fundamental to uncovering depth and part-structure of shapes. We examined the roles played in the observed biases by anisotropies in numbers and tuning widths of orientation-tuned cells in striate cortex as well as the distribution of oriented energy in natural scenes. An optimal stimulus decoding model for 2-D angles revealed that the narrower tuning of cells for horizontal orientations combined with cross-orientation inhibition explains the orientation-dependent angle distortion and hence the 3-D shape inconstancy. Variations in properties within neural populations can thus have direct effects on visual perceptions and need to be included in neural decoding models.
Keywords: shape constancy, cortical anisotropy, vision, population coding, spatial perception, striate cortex
Introduction
Shape is the geometrical attribute of an object that is invariant to location, rotation, and scale effects (Kendall et al., 1999). The ability to perceive the shape of a rigid object as constant, despite differences in the viewing angle, has been considered an essential component of representing objects in the visual world accurately. Because the visual system cannot generally discount perspective distortions, shapes of certain classes of three-dimensional (3-D) objects are not perceived as constant across viewpoints (Pizlo and Stevenson, 1999; Griffiths and Zaidi, 2000), but shape constancy is expected to hold for simple shapes under two-dimensional (2-D) rotations of the image plane (Lawson, 1999). In striate cortex, cells tuned to orientation are sampled unevenly, with greater concentration, as well as narrower tuning, near horizontal and vertical (Mansfield, 1974; Li et al., 2003). These anisotropies raise questions about whether shape constancy can survive image rotations. This report describes two new empirical findings about the orientation dependence of visual shape perception and uses an elaboration of cortical stimulus decoding models to test whether variations in properties within neural populations have significant effects on visual perceptions.
Figure 1 depicts four shapes that appear triangular in depth because of texture cues. The concave and convex 3-D wedges with vertical axes (top) appear deeper than the corresponding wedges with oblique axes (bottom), especially when viewed monocularly. However, when the page is rotated counterclockwise by 45°, the bottom shapes appear deeper than the top. The bottom images are simply rotated copies of the top images, revealing that perceived depth depends on shape orientation. Surprisingly, the same violation of constancy also occurs when viewing a single slowly rotating textured wedge, despite cues to object continuity.
Figure 1.
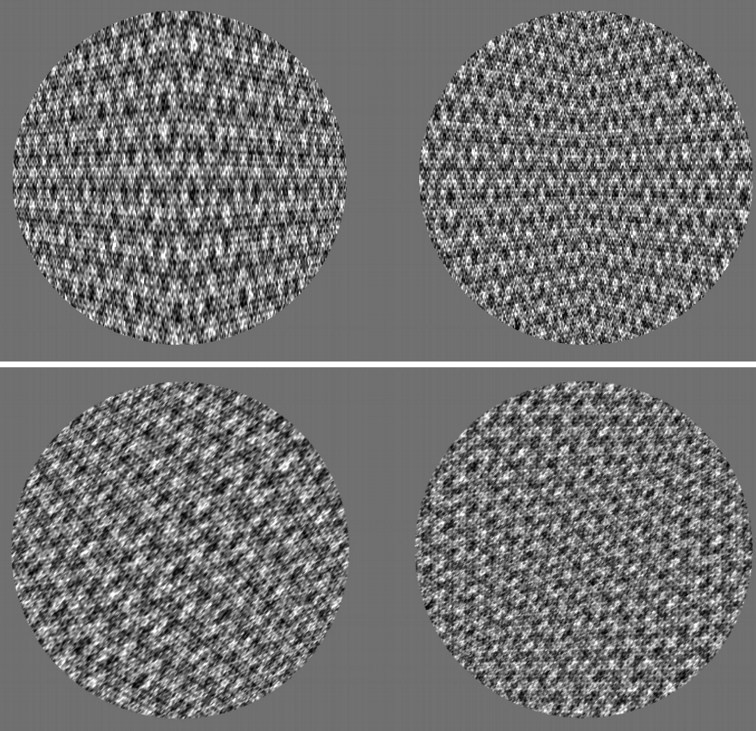
Convex and concave wedges oriented vertically and obliquely.
Li and Zaidi (2000, 2004) showed that the perception of 3-D shapes from texture cues depends critically on the orientation modulations around the axis of maximum curvature. When these orientation flows are visible, distinct patterns of orientation modulation automatically determine perceived signs of curvatures and directions of slants. When the flows are not visible, texture gradients such as density and spatial frequency are not sufficient to convey even a qualitatively accurate shape in many conditions. The critical orientation flows, visible in Figure 1 and highlighted in Figure 3a, form obtuse angles that bow inward in the center of the perspective image of the concave wedge and bow outward in the center of the image of the convex wedge. Changes in the magnitudes of angles above and below eye height determine the perceived depth. This finding was used to test whether the 3-D inconstancy results from anisotropy in perception of 2-D angles.
Figure 3.
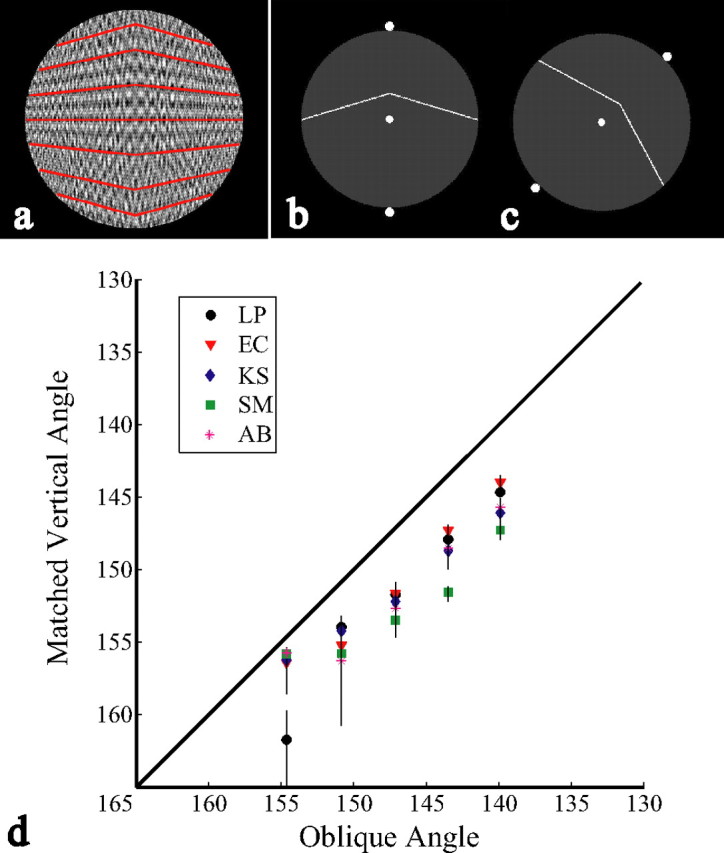
a, 2-D angles in the image of a 3-D convex shape. b, c, Vertical and oblique obtuse angles similar to those used in experiment 2. d, Estimates of 50% points of the choice psychometric functions giving the vertical angles perceived equivalent to fixed oblique angles by five observers. Error bars indicate 95% confidence intervals. Descending magnitudes for x- and y-axes depict angles of increasing acuteness.
Materials and Methods
Experiment 1: failures of 3-D shape constancy.
To quantify the orientation dependence of depth perceptions, two 3-D wedges (one oriented at 45° and the other oriented at 90°) were viewed successively in random order, and observers identified which appeared greater in depth. 3-D wedges were formed by simulating a texture pattern folded into a depth triangle and projected in perspective. Wedges varied in depth within a circular outline 8° of visual angle in diameter and centered on a dark screen. The grayscale texture pattern consisted of 21 sine-wave gratings at three spatial frequencies (1, 3, and 6 cycles per degree) and seven orientations (0, ± 22.5, ± 45, and ± 67.5°) with respect to the axis of maximum curvature. The contrast of each grating was 1/21 so that the contrast of each texture pattern was ∼1.0. Ten different texture patterns were generated for each shape by adding the gratings in random phases. By rotating the orientation of the 3-D axis, the same stimuli were used for 90 and 45° presentations.
Stimuli were presented in a dark room to minimize frame effects, centered at eye level, and viewed monocularly at 1.0 m. To equate orientation expectations, a central fixation dot and two reference dots were displayed as axis orientation cues. A trial (Fig. 2a) consisted of the following progression: (1) fixation dot (500 ms), (2) axis orientation cue 1 (500 ms), (3) test shape 1 (500 ms), (4) axis orientation cue 2 (500 ms), (5) test shape 2 (500 ms), and (6) fixation dot (until response). The observer's two-alternative forced choice task was to indicate by button press which shape was greater in depth.
Figure 2.
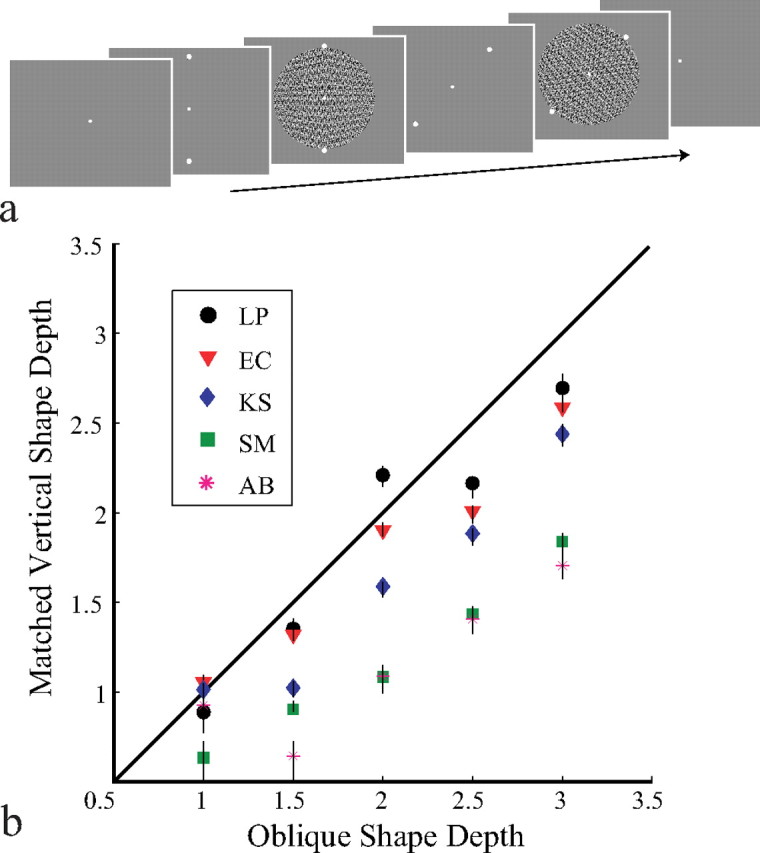
a, A trial sequence for experiment 1. b, Estimates of 50% points of the choice psychometric functions giving the vertical depths perceived equivalent to fixed oblique depths by five observers. Error bars indicate 95% confidence intervals.
Vertical shapes were compared in depth to oblique shapes for 25 convex–convex and 25 concave–concave comparison conditions. Vertical shapes of each of five depths, equivalent to 1, 1.5, 2, 2.5, or 3° of visual angle at the presented distance, were compared with oblique shapes of the same five depths. Each observer ran 20 trials of each condition, presented in random order.
Four paid naive observers and author E.H.C. participated. All had normal or corrected-to-normal vision and exhibited no more than minimal levels of astigmatism (<0.5 cylinders). All observers were given extensive training in the experimental task.
Experiment 2: failures of 2-D angle constancy.
In experiment 2, using the same observers, procedures, stimulus extents, and statistical analyses as in experiment 1, we tested whether there is a corresponding anisotropy in the perception of obtuse 2-D angles when angles symmetric around 90° are compared with angles symmetric around 45° (Fig. 3b,c).
Test angles were white lines against a gray circular background. Aliasing was equated in the two orientations by adding noise to all lines through repeated image rotation. Angles were presented in one of two ways, either intersecting the fixation dot or set above it, and were randomly varied to point either toward the top or bottom of the screen. Trial sequences were identical to experiment 1, but with 2-D oblique angles as the test stimuli. The observer's task was to indicate which angle was sharper.
Results
Experiment 1: failures of 3-D shape constancy
Psychometric functions (Wichmann and Hill, 2001) were fit to each observer's data, and the 50% points estimated the depths of vertical wedges judged subjectively equivalent (PSE) to fixed depths of oblique wedges. The average ratios of subjectively equivalent vertical to oblique depths for convex and concave shapes were nearly equivalent, 0.766 (SE, 0.006) and 0.781 (SE, 0.010), respectively. Data from concave and convex trials combined (Fig. 2b) show that almost all PSEs fall below the unit diagonal (mean, 0.771; SE, 0.007). Physically identical shapes were perceived as deeper when oriented vertically than when oriented obliquely; consequently, 3-D shapes are not perceived as constant even across rotations in the image plane.
Experiment 2: failures of 2-D angle constancy
Figure 3d shows that all PSEs fall below the unit diagonal (i.e., 2-D angles were perceived to be sharper at vertical than at 45°). The average subjectively equivalent vertical angle was 4.5° (SE, 0.38°) shallower than the oblique angle. Consequently, 2-D angles are not perceived as constant across plane rotations.
The relationship between 2-D angles and 3-D curvature
For a 3-D wedge at distance d with depth a and width 2w, the 2-D slope s of the critical orientation flow, at height y above or below eye height, is equal to ay/wd (Li and Zaidi, 2004). Because distance and width are the same for the two orientations, the equation svert/soblq = avert/aoblq holds for all y. The average ratio of perceptually equivalent 2-D slopes, calculated from the PSEs for 2-D angles, was 0.862 (SE, 0.001), similar to the ratio of perceptually equivalent 3-D depths (0.771; SE, 0.007), suggesting that 3-D depth inconstancy can be explained by anisotropy in perception of 2-D features. The small discrepancy between ratios may reflect greater accuracy with the less noisy angle stimuli, or interactions between angles in the complex shape stimulus.
Perceived angles decoded from cortical responses
Having traced 3-D perceptual anisotropy to an oblique bias for 2-D angles, we used a probabilistic stimulus decoding model (Sanger, 1996) to test whether this 2-D bias could be explained by anisotropies in numbers or tuning widths of cortical cells tuned to different orientations (Li et al., 2003), or the anisotropic distribution of oriented energy in images of natural scenes (Hansen and Essock, 2004). We first derived the probabilities of numbers of spikes from individual orientation-tuned cells in response to an angle stimulus. Using Bayes' formula, we then decoded the most probable angle given the population response. To compare the predictions of the model with the experimental measurements, we assumed that the observer perceives an angle equal to the optimally decoded angle.
Population decoding model
To show how we decode angles from population responses, we begin with decoding the orientation of a single line. We make the assumption that a cell tuned to the orientation θi gives an action potential in response to any orientation θ with the following probability:
where fi(θ)is the tuning curve of the cell with respect to θ (i.e., the average firing rate for each value of θ). If the probability of firing is a constant within time intervals of the same length, then the firing is governed by a Poisson distribution. The probability of the cell tuned to θi firing n spikes is given by the following:
 |
If neurons can be treated as independent (i.e., all correlated firing is attributable to overlap in receptive fields or tuning curves), then the probability of ni spikes each from a population of k cells is given by the product of the probabilities:
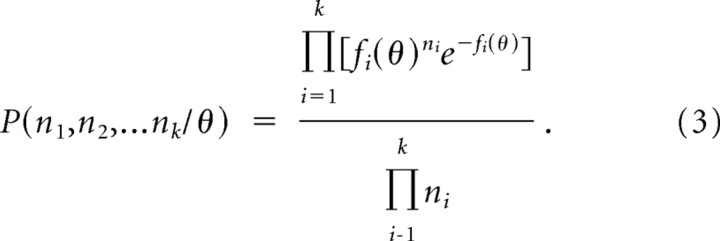 |
Using Bayes' formula, the optimal estimate of the stimulus can be decoded from the population response:
 |
where P(θ) is the prior probability distribution of orientations in natural scenes and C is a combination of terms that are not functions of θ. The maximum of the posterior probability distribution provides an optimal estimate of the stimulus orientation θ given the population response (Box and Tiao, 1992). It is computationally easier to use the log of the probability distribution (Jazayeri and Movshon, 2006):
 |
If there are a considerable number of cells di tuned to each orientation θi, and if the average responses of these cells are n̄i, then the total response for each orientation is din̄i, and Equation 5 can be grouped within m orientations as follows:
 |
Because the average responses are given by the values of the tuning curves, Equation 6 can be used to make predictions without running probabilistic simulations.
We now consider angles Ω composed of two lines, θp and θq. The orientation tuning functions of cells in striate cortex have been fit satisfactorily by circular Gaussians (Swindale, 1998). However, when more than one orientation is present in the receptive field of a cell, the response to a preferred orientation can be reduced even by an orientation to which the cell does not respond (Morrone et al., 1982). The tuning width of the cross-orientation inhibition is considerably broader than that of the orientation tuning of the cell, but more than one mechanism may be involved and estimates of the extent vary (Bonds, 1989). In the model, we match the excitatory orientation tuning, gi(θ), to average widths for cat striate cortex (Li et al., 2003) (i.e., half-height widths varying from 29° for horizontal orientations to 38° for oblique orientations). We explored widths of the cross-orientation inhibition, hi(θ), ranging from two times the excitatory width to broader. For each orientation-tuned cell, we derived a matrix valued tuning function for angles:
where ε is a tiny constant used to make Fi(Ω) all-positive as is required for the Poisson distribution in Equation 2. We could not find published data giving frequencies of a sufficient sample of angles P(Ω) in natural scenes, so using P(θ), the prior probability distribution of orientations in images of natural scenes (Hansen and Essock, 2004), for all combinations of orientations θp and θq, we made the following rough approximation:
Angles can be decoded from the population responses of orientation-tuned cells using an equation analogous to Equation 6:
 |
We took estimates of the distribution of orientation-tuned cat striate cells (Li et al., 2003) for di. Using n̄i equal to average responses to the stimulus angle, we found that decoded angles differed from stimulus angles.
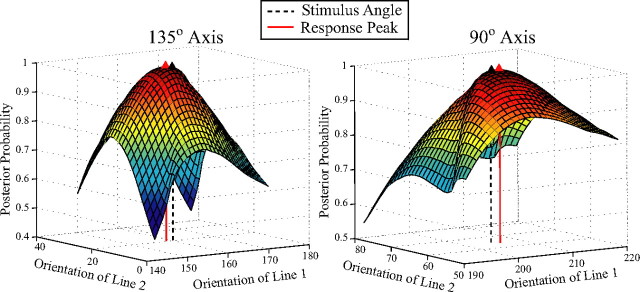
Our psycho-neural linking hypothesis is that the optimal estimate of the perceived angle is the angle at which the posterior probability is maximum. Figure 4 presents the posterior probability distribution functions of angles in the neighborhoods of vertically and obliquely oriented angles of 140° for one choice of inhibitory tuning width. The decoded vertical angle is 138°, and the decoded oblique angle is 142°, so the oblique bias of 4° is similar to the empirically measured bias. For the range of angles used in experiment 2, the decoded oblique angles were wider than the decoded vertical angles. In numerous simulations, as long as the anisotropy in the excitatory bandwidths and a constant ratio of excitatory to inhibitory tuning widths was maintained, the oblique angle was decoded as broader than the vertical angle. The model will thus make correct predictions even if tuning widths of human cells differ from cat cells. The anisotropy in numbers of cells, maximum at horizontal, and 28% less at oblique (Li et al., 2003) tended to pull the posterior estimates of the arms of the angles toward the horizontal, creating a bias in perceived angles that is opposite to the empirical results but weaker than the bias resulting from tuning-width anisotropy. The posterior probability was insensitive to the prior probability of image angles (i.e., a uniform prior led to the same predictions as the empirical frequency distribution). The model thus shows that the narrower tuning of cells for horizontal orientations and inhibitory orientation effects explain the orientation-dependent angle distortion and hence the 3-D shape distortion.
Figure 4.
Surface plots of the log of the posterior distribution function for angles in the neighborhood of vertically and obliquely oriented angles of 140°. x- and y-axes depict the two arms of the angle.
Justifications, alternatives, and implications of the model
To obtain the decoding solution, a number of assumptions were made: (1) shapes of orientation tuning curves are not constrained but are assumed to be invariant to signal strength, based on orientation tuning curves in V1 being contrast invariant (Sclar and Freeman, 1982); (2) the variation in firing rates of cortical neurons is described by Poisson statistics, but more general Poisson-like exponential distributions would suffice (Ma et al., 2006); and (3) the assumption that responses of cells tuned to different angles at different orientations are independent leads to a simple Bayes-optimal solution, but noise in the cortex is correlated across cells. However, a decoding model incorporating the structure of neural correlations (Ma et al., 2006) requires empirical estimates that do not yet exist, and the relatively constant variability observed across cortical stages suggests that noise correlations may be propagated by downstream neurons (Shadlen and Newsome, 1998). In addition, a neural correlation function based on similarities between preferred stimuli changes the variance of the likelihood function but not measures of central tendency (Jazayeri and Movshon, 2006).
Equation 7 provides a way to simulate cells sensitive to specific angles at specific orientations and could be used to predict tuning curves for such cells in V2 and V4 (Pasupathy and Connor, 1999; Ito and Komatsu, 2004). This equation takes into account cross-orientation inhibition between V1 cells, so although responses of angle-selective cells are assumed to be independent in the model, V1 cells are not. V1 cells also have anatomical links to cells with co-oriented and coaxially aligned receptive fields (Bosking et al., 1997). Such long-range excitatory connections could facilitate the extraction of curved contours (Ben-Shahar and Zucker, 2004). Because there are more co-oriented cells available for connections to horizontal cells than to oblique cells, if co-oriented excitation replaces cross-orientation inhibition in the model, it enhances the effect of anisotropy in numbers of cells, which leads to predictions that overestimate the vertical angle and underestimate the oblique angle (i.e., distortions opposite to the observed perceptual bias). A stronger divisive gain for horizontally tuned cells than for obliquely tuned cells (Hansen and Essock, 2004) attenuates the effect of the anisotropy in numbers, but a multiplicative gain cannot reverse the effect, so cross-orientation inhibition is still needed to account for the observed perceptual bias.
This model can be viewed as a formal embodiment of Mach's (1914) idea of “contrast in directions,” which he proposed as an explanation for why obtuse angles tend to appear contracted and acute angles tend to appear expanded (Wundt, 1862). In the simulations, we found that contraction of obtuse angles is not a general result of orientation contrast, as presupposed by Blakemore et al. (1970), but occurs only for certain relative widths of excitation and inhibition. Mach's (1914) second explanation for angle distortions invoked the projective tendency of acute angles in the image to originate from 3-D angles that are greater than their projections and obtuse projections to arise from smaller 3-D angles (quantified by Nundy et al., 2000). To explain our results, this hypothesis requires that the 3-D angles in the world that project to oblique obtuse angles be wider, on average, than the 3-D angles that project to vertical obtuse angles. We used Equation 8 as an approximation to the frequency of image angles in natural scenes. The model was insensitive to P(Ω). It is likely that tuning-width anisotropies will also explain Bouma and Andriessen's (1970) result that the magnitude of the induced effect on the perceived orientation of a line segment depends on the orientations of the inducing and test lines.
Discussion
Perhaps because investigations of oblique effects concentrated on detection and discrimination (Appelle, 1972; Cohen and Zaidi, 2007) or memory of oriented information (Essock, 1980), the oblique bias for angles remained undiscovered. The oblique bias has direct consequences for a variety of shape and space constancies. First, it suggests that 2-D shapes defined by contours will also not be perceived as constant across axis orientations. In addition, contour curvature is known to be fundamental to uncovering depth (Koenderink, 1984) as well as representation of the part-structure of 2-D and 3-D shapes (Hoffman and Richards, 1984; Cohen and Singh, 2006), and cells in area V4 have been shown to be selective for angles and curves in particular orientations (Pasupathy and Connor, 1999). Our finding that perception of even a single angle is dependent on image orientation has broad implications for object–shape perception.
The link between cortical processing and 3-D shape inconstancy revealed by this study relied on the previous identification of 2-D orientation flows critical for 3-D perception from texture cues (Li and Zaidi, 2000, 2004; Knill, 2001). Because orientation flows have also been implicated in 3-D perception from reflections and shading (Breton and Zucker, 1996; Ben-Shahar and Zucker, 2001; Fleming et al., 2004), it is likely that shapes defined by these cues also show orientation dependence. The result that the perceived shape of a simple 3-D stimulus is not invariant to rotation of the image plane suggests that object identity computations overcome shape distortions caused by neural processing.
As yet, there has been no electrophysiological examination of how outputs of V1 cells are combined by extra-striate cells to extract orientation flows. The 3-D orientation dependence revealed here demonstrates that neural extraction of orientation flows is more than simple combination of oriented energy and involves cross-orientation inhibition, some of which may be attributable to compressive contrast-response functions in the lateral geniculate nucleus (Li et al., 2006; Priebe and Ferster, 2006) or even in ganglion cells.
The decoding model shows that the anisotrotropic distribution of orientation tuning widths of cells creates orientation-dependent 2-D and 3-D shape distortions. Population decoding models generally ignore anisotropies in distributions of properties of neurons to simplify the expressions for the likelihood or posterior probability by omitting the equivalent of the last terms of Equations 6 and 9 (Jazayeri and Movshon, 2006). Our results show that it is essential to include distributions of neural properties, and we present a method that links these variations to the decoding of complex 2-D and 3-D stimuli.
Footnotes
This work was supported by National Eye Institute Grants EY07556 and EY13312 (Q.Z.).
References
- Appelle S. Perception and discrimination as a function of stimulus orientation: the “oblique effect” in man and animals. Psychol Bull. 1972;78:266–278. doi: 10.1037/h0033117. [DOI] [PubMed] [Google Scholar]
- Ben-Shahar O, Zucker SW. On the perceptual organization of texture and shading flows: from a geometrical model to coherence computation. CVPR. 2001:1048–1055. [Google Scholar]
- Ben-Shahar O, Zucker SW. Geometrical computations explain projection patterns of long range horizontal connections in visual cortex. Neural Comput. 2004;16:445–476. doi: 10.1162/089976604772744866. [DOI] [PubMed] [Google Scholar]
- Blakemore C, Carpenter RHS, Georgeson MA. Lateral inhibition between orientation detectors in the human visual system. Nature. 1970;228:37–39. doi: 10.1038/228037a0. [DOI] [PubMed] [Google Scholar]
- Bonds AB. Role of inhibition in the specification of orientation selectivity of cells in the cat striate cortex. Vis Neurosci. 1989;2:41–55. doi: 10.1017/s0952523800004314. [DOI] [PubMed] [Google Scholar]
- Bosking WH, Zhang Y, Schofield B, Fitzpatrick D. Orientation selectivity and the arrangement of horizontal connections in tree shrew striate cortex. J Neurosci. 1997;17:2112–2127. doi: 10.1523/JNEUROSCI.17-06-02112.1997. [DOI] [PMC free article] [PubMed] [Google Scholar]
- Bouma H, Andriessen JJ. Induced changes in the perceived orientation of line segments. Vision Res. 1970;10:333–349. doi: 10.1016/0042-6989(70)90104-5. [DOI] [PubMed] [Google Scholar]
- Box GEP, Tiao GC. Bayesian inference in statistical analysis. New York: Wiley; 1992. [Google Scholar]
- Breton P, Zucker SW. Shadows and shading flow fields. CVPR. 1996:782–789. [Google Scholar]
- Cohen EH, Singh M. Perceived orientation of complex shape reflects graded part decomposition. J Vis. 2006;6:805–821. doi: 10.1167/6.8.4. [DOI] [PubMed] [Google Scholar]
- Cohen EH, Zaidi Q. The oblique effect and three-dimensional shape. Vis Cogn. 2007;15:80–83. [PMC free article] [PubMed] [Google Scholar]
- Essock EA. The oblique effect of stimulus identification considered with respect to two classes of oblique effects. Perception. 1980;9:37–46. doi: 10.1068/p090037. [DOI] [PubMed] [Google Scholar]
- Fleming RW, Torralba A, Adelson EH. Specular reflections and the perception of shape. J Vis. 2004;4:798–820. doi: 10.1167/4.9.10. [DOI] [PubMed] [Google Scholar]
- Griffiths AF, Zaidi Q. Perceptual assumptions and projective distortions in a three-dimensional shape illusion. Perception. 2000;29:171–200. doi: 10.1068/p3013. [DOI] [PubMed] [Google Scholar]
- Hansen BC, Essock EA. A horizontal bias in human visual processing of orientation and its correspondence to the structural components of natural scenes. J Vis. 2004;4:1044–1060. doi: 10.1167/4.12.5. [DOI] [PubMed] [Google Scholar]
- Hoffman DD, Richards WA. Parts of recognition. Cognition. 1984;18:65–96. doi: 10.1016/0010-0277(84)90022-2. [DOI] [PubMed] [Google Scholar]
- Ito M, Komatsu H. Representation of angles embedded within contour stimuli in area V2 of macaque monkeys. J Neurosci. 2004;24:3313–3324. doi: 10.1523/JNEUROSCI.4364-03.2004. [DOI] [PMC free article] [PubMed] [Google Scholar]
- Jazayeri M, Movshon JA. Optimal representation of sensory information by neural populations. Nat Neurosci. 2006;9:690–696. doi: 10.1038/nn1691. [DOI] [PubMed] [Google Scholar]
- Kendall D, Barden D, Carne T, Le H. Shape and shape theory. New York: Wiley; 1999. [Google Scholar]
- Knill DC. Contour into texture: the information content of surface contours and texture flow. J Opt Soc Am A. 2001;18:12–36. doi: 10.1364/josaa.18.000012. [DOI] [PubMed] [Google Scholar]
- Koenderink J. What the occluding contour tells us about solid shape. Perception. 1984;13:321–330. doi: 10.1068/p130321. [DOI] [PubMed] [Google Scholar]
- Lawson R. Achieving visual object constancy across plane rotation and depth rotation. Acta Psychol. 1999;102:221–245. doi: 10.1016/s0001-6918(98)00052-3. [DOI] [PubMed] [Google Scholar]
- Li A, Zaidi Q. The perception of 3D shape from texture is based on patterns of oriented energy. Vision Res. 2000;40:217–242. doi: 10.1016/s0042-6989(99)00169-8. [DOI] [PubMed] [Google Scholar]
- Li A, Zaidi Q. Three-dimensional shape from non-homogeneous textures: carved and stretched surfaces. J Vis. 2004;4:860–878. doi: 10.1167/4.10.3. [DOI] [PubMed] [Google Scholar]
- Li B, Peterson MR, Freeman RD. Oblique effect: a neural basis in the visual cortex. J Neurophysiol. 2003;90:204–217. doi: 10.1152/jn.00954.2002. [DOI] [PubMed] [Google Scholar]
- Li B, Thompson JK, Duong T, Peterson MR, Freeman RDJ. Origins of cross-orientation suppression in the visual cortex. J Neurophysiol. 2006;96:1755–1764. doi: 10.1152/jn.00425.2006. [DOI] [PubMed] [Google Scholar]
- Ma WA, Beck JM, Latham PE, Pouget A. Bayesian inference with probabilistic population codes. Nat Neurosci. 2006;9:1432–1438. doi: 10.1038/nn1790. [DOI] [PubMed] [Google Scholar]
- Mach E. Chicago: Open Court Publishing; 1914. The analysis of the sensations and the relation of the physical to the psychical. [Google Scholar]
- Mansfield RJW. Neural basis of orientation perception in primate vision. Science. 1974;186:1133–1135. doi: 10.1126/science.186.4169.1133. [DOI] [PubMed] [Google Scholar]
- Morrone MC, Burr DC, Maffei L. Functional implications of cross-orientation inhibition of cortical visual cells. I. Neurophysiological evidence. Proc R Soc Lond B Biol Sci. 1982;216:335–354. doi: 10.1098/rspb.1982.0078. [DOI] [PubMed] [Google Scholar]
- Nundy S, Lotto RB, Coppola D, Shimpi A, Purves D. Why are angles misperceived? Proc Natl Acad Sci USA. 2000;97:5592–5597. doi: 10.1073/pnas.97.10.5592. [DOI] [PMC free article] [PubMed] [Google Scholar]
- Pasupathy A, Connor CE. Responses to contour features in macaque area V4. J Neurophysiol. 1999;82:2490–2502. doi: 10.1152/jn.1999.82.5.2490. [DOI] [PubMed] [Google Scholar]
- Pizlo Z, Stevenson A. Shape constancy from novel views. Percept Psychophys. 1999;61:1299–1307. doi: 10.3758/bf03206181. [DOI] [PubMed] [Google Scholar]
- Priebe NJ, Ferster D. Mechanisms underlying cross-orientation suppression in cat visual cortex. Nat Neurosci. 2006;9:552–561. doi: 10.1038/nn1660. [DOI] [PubMed] [Google Scholar]
- Sanger TD. Probability density estimation for the interpretation of neural population codes. J Neurophysiol. 1996;76:2790–2793. doi: 10.1152/jn.1996.76.4.2790. [DOI] [PubMed] [Google Scholar]
- Sclar G, Freeman RD. Orientation selectivity in the cat's striate cortex is invariant with stimulus contrast. Exp Brain Res. 1982;46:457–461. doi: 10.1007/BF00238641. [DOI] [PubMed] [Google Scholar]
- Shadlen MN, Newsome WT. The variable discharge of cortical neurons: implications for connectivity, computation, and information coding. J Neurosci. 1998;18:3870–3896. doi: 10.1523/JNEUROSCI.18-10-03870.1998. [DOI] [PMC free article] [PubMed] [Google Scholar]
- Swindale NV. Orientation tuning curves: empirical description and estimation of parameters. Biol Cybern. 1998;78:45–56. doi: 10.1007/s004220050411. [DOI] [PubMed] [Google Scholar]
- Wichmann FA, Hill NJ. The psychometric function: I. Fitting, sampling, and goodness of fit. Percept Psychophys. 2001;63:1293–1313. doi: 10.3758/bf03194544. [DOI] [PubMed] [Google Scholar]
- Wundt W. Leipzig, Germany: Winter'sche Verlagshandlung; 1862. Beitrag̈e zur Theorie der Sinneswahrnehmung. [Google Scholar]


