Abstract
A growing body of evidence shows that membrane phosphatidylinositol 4,5-bisphosphates (PtdIns(4,5)P2, PIP2) play an important role in cell signaling. The presence of PIP2 is fundamentally important for maintaining the functions of a large number of ion channels and transporters, and for other cell processes such as vesicle trafficking, mobility, and endo- and exocytosis. PIP2 levels in the membrane are dynamically modulated, which is an important signaling mechanism for modulation of PIP2-dependent cellular processes. In this study, we describe a novel mechanism of membrane PIP2 modulation. Membrane depolarization induces an elevation in membrane PIP2, and subsequently increases functions of PIP2-sensitive KCNQ potassium channels expressed in Xenopus oocytes. Further evidence suggests that the depolarization-induced elevation of membrane PIP2 occurs through increased activity of PI4 kinase. With increased recognition of the importance of PIP2 in cell function, the effect of membrane depolarization in PIP2 metabolism is destined to have important physiological implications.
Keywords: Channels/Potassium, Lipid/Inositol Phospholipid, Lipid/Phospholipid/Metabolism, Membrane, Oocyte, Depolarization, PI4-kinase, PIP2, Increase
Introduction
Phosphoinositides are minor phospholipids in cellular membranes. However, they play an important role in cellular signaling. Phosphatidylinositol 4,5-bisphosphate (PIP2)3 is a major phosphoinositide of the plasma membrane that comprises about 1% of plasma membrane phospholipids (1). PIP2 has long been known as the precursor of two important second messengers, diacylglycerol (DAG) and inositol trisphosphate (IP3), produced when PIP2 is cleaved by phospholipase C (PLC). However, it is now well documented that PIP2 is also important in the attachment of the cytoskeleton to the plasma membrane, exocytosis, endocytosis, membrane trafficking, and the activation of enzymes (1–3).
Among the targets of PIP2 signaling, ion channels have been the focus of recent studies. Many members of ion channel families have been shown to be PIP2-sensitive (4–6). The physiological significance of PIP2 modulation of ion channels is best manifested when the channel function is altered under conditions of PIP2 hydrolysis, a process that is initiated by the activation of membrane receptors by a variety of neuronal transmitters or hormones. One well-studied case is the receptor-mediated inhibition of M/KCNQ potassium currents. It had long been a mystery until PIP2 was implicated in the inhibition of M/KCNQ currents when a Gq-coupled receptor like muscarinic M1 is activated (7–9). It is now accepted that PLC-mediated hydrolysis of PIP2 serves as the major mechanism of neurotransmitter- and neuropeptide-induced inhibition of M/KCNQ currents (5, 6, 10). Apart from G protein-coupled receptors, activation of other membrane receptors such as EGF and NGF receptors also employ a similar mechanism to the modulation of M/KCNQ function (11, 12).
Apart from PLC-induced cleavage of membrane PIP2, steady state PIP2 levels in the cellular membrane are dynamically balanced by the activities of specific phosphoinositide kinases and specific lipid phosphatases. These kinases and phosphatases targeting PIP2 in cells are likely regulated to control the PIP2 level. For example, PIPKIγ and synaptojanin 1 (5-phosphatase) antagonize each other in determining PIP2 levels and the subsequent recruitment of clathrin coats at the synaptic membrane (13). Alterations in the activities of these kinases and phosphates inevitably change PIP2 levels, and subsequently PIP2-dependent cellular signals. Thus, blockage of PI4 kinase by wortmannin or phenylarsine oxide blocks the re-synthesis of PIP2 and the reactivation of M/KCNQ currents (7, 8). Expression of PIP2 5-phosphatase depresses KCNQ2/Q3 currents, as expected for channels that need PIP2 for their function (14, 15). When membrane PIP2 abundance is elevated by overexpression of PI(4)P5K, the channel activities of KCNQ2 and KCNQ2/Q3 are dramatically increased (14), a similar maneuver greatly blunts the extent of M/KCNQ current inhibition by Gq/11-coupled receptor stimulation (15, 16).
Recently, a phosphoinositide phosphatase linked to a transmembrane voltage-sensing domain homologous to the S1-S4 segments of voltage-gated channels was described in Ciona intestinalis (named Ci-VSP) (17). Ci-VSP is activated when the membrane potential is depolarized, which results in cleavage of membrane PIP2 and inhibition of PIP2-dependent K+ currents (17, 18). This is the first example showing that PIP2 levels in the membrane can be modulated by a phosphoinositide-metabolizing enzyme in a manner similar to PLC-mediated cleavage of PIP2, namely a fast breakdown of PIP2 driven by a single event of either an activation of PLC or membrane depolarization.
In this study, we describe a novel mechanism of membrane PIP2 modulation. The membrane depolarization elevates membrane PIP2 levels and enhances PIP2-dependent KCNQ2/Q3 currents expressed in Xenopus oocytes. The depolarization-induced elevation of PIP2 levels is a result of increased activity of PI4 kinase.
EXPERIMENTAL PROCEDURES
Two-electrode Voltage Clamp (TEVC) Recording in Xenopus Oocytes
Currents were measured in oocytes 1–2 days after cRNA injection under two-electrode voltage clamp using 0.5–1.0 MΩ microelectrodes filled with 3 m KCl (PH 7.2) with a Geneclamp 500B amplifier (Axon Instruments). The external solutions include: (1) ND96 solution (in mm): 96 NaCl, 1 KCl, 1 MgCl2, 1.8 CaCl2, 5 HEPES; (2) ND96-10K solution (in mm): 87 NaCl, 10 KCl, 1 MgCl2, 1.8 CaCl2, 5 HEPES; (3) ND96K solution (in mm): 96 KCl, 1 NaCl, 1 MgCl2, 1.8 CaCl2, 5 HEPES, and (4) hypertonic ND96 (in mm): 196 NaCl, 1 KCl, 1 MgCl2, 1.8 CaCl2, 5 HEPES. All solutions were adjusted with NaOH to pH 7.4. Only cells with negligible leaky current were used for experiments. Therefore, no leak subtraction was used. All experiments were carried out at room temperature (23–25 °C).
Membrane PIP2 Assay by TLC
The method of thin layer chromatography (TLC) was modified from [32P]PIP2 TLC analysis. Oocytes lipids were extracted with chloroform-methanol. The mobile phase for TLC was chloroform/methanol/4 n NH4OH (45:35:10, v/v/v) (2). Phospholipids were visualized with iodine vapor. PIP and PIP2 were confirmed by mass spectrometry (MS).
Western Blots
100 oocytes from either the control group or dsRNA-injected group (2–3 days after injection) were used for Western blots studies. Oocytes were solubilized in 500 μl of lysis buffer on ice. The lysis buffer contained (in mm): 5 Tris-HCl, 1 EDTA, 1 EGTA, 10 Na3VO4, 10 NaF, and (in μg/ml) 30 phenylmethylsulfonyl fluoride, 10 pepstatin A, 2.5 leupeptin, 10 aprotinin. Homogenates were centrifuged at 400 rpm for 10 min at 4 °C to remove yolk granules. The supernatant was centrifuged at 16,000 × g for 30 min at 4 °C, yielding a whole cell protein supernatant. The whole cell protein supernatant was mixed with loading buffer (10% glycerol, 50 mm Tris-HCl, 2% SDS, 5% β-mercaptoethanol, and 0.02% bromphenol blue), then heat denatured at 99 °C for 5 min and subjected to SDS-PAGE. Proteins resolved by 10% SDS-PAGE were transferred to polyvinylidene difluoride (Millipore, Billerica, MA) membranes in transfer buffer (20% methanol and 15.6 mm Tris base,120 mm glycine,) for 3 h at 100 V, and were probed with anti-PI4Kβ (Upstate, Lake Placid, NY) antibodies (1:200), for 1 h at room temperature or overnight at 4 °C. Nonspecific binding was blocked with 1.5% (w/v) evaporated skimmed milk (Difco, Becton Drive Franklin Lakes, NJ) in TBS (154 mm NaCl, 10 mm Tris base). Anti-rabbit or anti-mouse secondary antibodies conjugated to IRDye700DX and IRDye800CW (1:5000; Rockland, Gilbertsville, PA) were used to probe primary antibodies. Protein bands were detected and quantified on an Odyssey two-color infrared imaging system (LI-COR Biosciences, Lincoln, Nebraska).
Synthesis of DNA Template and dsRNAs
A 634-bp PI4K DNA template was synthesized by PCR using a ProofStart PCR kit. The PCR template is the cDNA of PI4 kinase β from oocytes of Xenopus laevis (ordered from Open Biosystems, clone no.: BC073706.1). See supplemental information for details. A 21-mer small interference RNA (siRNA) against PI4β was also used. See supplemental information for details.
Chemicals
All chemicals were purchased from Sigma. Stock solutions were made in DMSO, stored at −20 °C, and diluted in the appropriate solution immediately before use. The final concentration of DMSO was less than 0.1%.
Data Analysis and Statistics
Currents were analyzed and fitted using Clampfit 9.2 (Axon Instrument) and Origin 7.5 (Originlab Corp.) software.
Results are expressed as mean ± S.E. Each experiment was replicated between 3 and 15×. Differences were analyzed with Student's paired/unpaired t test or one-way ANOVA when appropriate, and were considered significant at p < 0.05.
RESULTS
Membrane Depolarization Augments the Amplitude but Does Not Affect the Kinetics of KCNQ2/Q3 Currents Expressed in Xenopus Oocytes
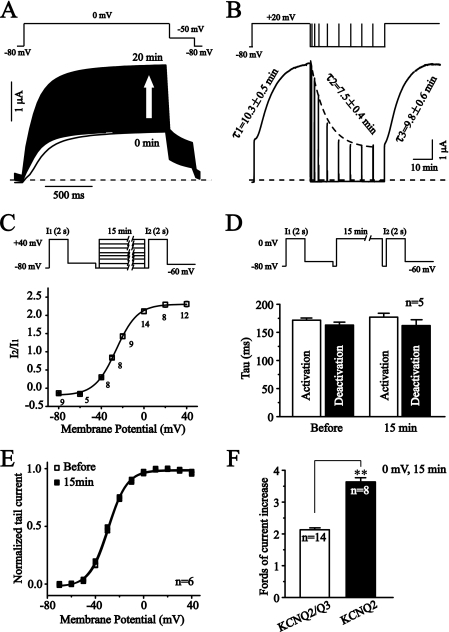
The heterologous currents of KCNQ2 and KCNQ3 K+ channels are believed to be the major components of neuronal M currents. Earlier studies (8, 19) demonstrate that KCNQ2/Q3 expressed in Xenopus oocytes has most of the characteristics of native neuronal M currents. However, we noticed that when expressed in Xenopus oocytes, the amplitudes of KCNQ2/Q3 currents activated by a depolarizing voltage always increased with time (Fig. 1A). Fig. 1A shows the increase of KCNQ2/Q3 currents. The arrow shows the time-dependent increase in KCNQ2/Q3 currents activated at 0 mV. Fig. 1B shows the depolarization-dependent nature of the current increase. A long (30 min) depolarization (+20 mV) led to a continuous increase in KCNQ2/Q3 currents, and the increase was gradually reversed when the membrane was repolarized to −80 mV (Fig. 1B). Multiple brief (10 s) depolarization pulses of +20 mV from −80 mV demonstrated the time course of reversion of the increased currents, which can be fitted by a single exponential decay (dotted line) with a time constant of 7.5 ± 0.4 min (n = 6). Similarly, the time course of the depolarization-induced current potentiation can be fitted nicely by a single exponential growth with a time constant of 10.3 ± 0.5 min (n = 7). The depolarization-induced increase could be fully reversed by the repolarization, and the following depolarization induced the same increase as the first depolarization (time constant is 9.8 ± 0.6 min, n = 6, Fig. 1B).
FIGURE 1.
Membrane depolarization augments the amplitude, but does not affect the kinetics of KCNQ2/Q3 currents expressed in Xenopus oocytes. KCNQ2/Q3 currents expressed in Xenopus oocytes were recorded under TEVC. A, KCNQ2/Q3 current was elicited by the voltage protocol shown above. The protocol was repeated with a minimum time interval of 65 ms. The arrow indicates the increase of the current with time. The dashed line shows the zero current level. B, membrane potential-dependence of KCNQ2/Q3 current amplitudes. KCNQ2/Q3 currents were increased by a continuous depolarization (+20 mV) with the time constant shown; the increased currents recovered when the membrane was repolarized (−80 mV) with the time constant shown. Brief depolarization pulses (+20 mV, 10 s) during the repolarization were applied to assess the changes of the current amplitudes. C, voltage-dependence of the depolarization-induced increase of KCNQ2/Q3 currents. The depolarization-induced current increases were assessed by the voltage protocol shown. I1 is the control current amplitude; I2 is the current amplitude after a 15 min conditioning voltages at different level. The ratio of I2 and I1 was plotted against the conditioning potentials. The data were fitted with the Boltzmann function, and V1/2 is −26.1 ± 0.5 mV. D, depolarization did not affect the activation and deactivation of KCNQ2/Q3 currents. Time constants of activation and deactivation of KCNQ2/Q3 currents before and after a 15-min depolarization (0 mV) were compared. The upper panel shows the voltage protocol used, and the activation and deactivation of KCNQ2/Q3 currents elicited by I1 and I2 are summarized and compared in the lower panel. E, conductance-voltage relationship (G-V) of KCNQ2/Q3 currents before (open squares) and after a 15-min depolarization (filled squares). The whole cell conductance was measured from the tail currents at −60 mV. Conductance at each depolarizing voltage was normalized to the Gmax. The data were fitted with the Boltzmann function, and V1/2 is −28.7 ± 0.5 mV and −29.6 ± 0.4 mV, respectively, for before and after the depolarization (n = 6). F, summary of fold increases for KCNQ currents induced by the depolarization. **, p < 0.01.
The depolarization-induced potentiation of KCNQ2/Q3 currents was clearly voltage-dependent (Fig. 1C). The voltage that produced a half-maximal increase (V1/2) was −26.1 ± 0.5 mV (n = 5–14). Depolarization did not affect the kinetics of KCNQ2/Q3 currents. The activation and deactivation time constants of KCNQ2/Q3 currents measured either before or after the currents had been increased by the depolarization were not significantly different (Fig. 1D). Similarly, the conductance-voltage relationship of KCNQ2/Q3 activation was also not affected (Fig. 1E).
Depolarization Induced Larger Potentiation of Homomeric KCNQ2 Currents
Homomeric KCNQ2 currents were also sensitive to depolarization. Actually, KCNQ2 currents were increased to a larger extent by depolarization than KCNQ2/Q3 currents (Fig. 1F). However, the voltage dependence of the induced increases was similar for both KCNQ2 and KCNQ2/Q3 currents (V1/2 is −29.1 ± 2.4 mV for KCNQ2 and −26.1 ± 0.5 mV for KCNQ2/Q3). Similarly, the kinetics of KCNQ currents were not affected (data not shown). We were not able to see measurable homomeric KCNQ3 currents in Xenopus oocytes.
External High Potassium Depolarizes the Membrane Potential and Increases KCNQ2/Q3 Currents
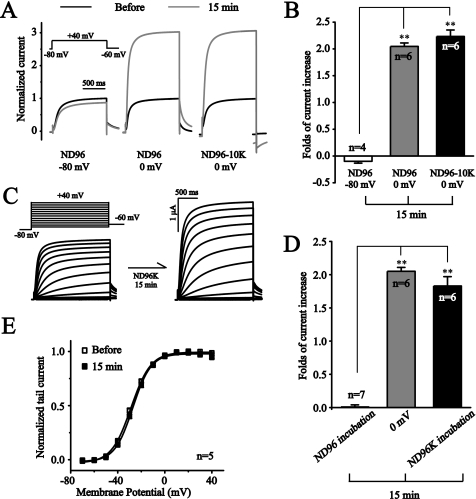
Increased external K+ is known to increase the conductance of some K+ channels (e.g. Kv2.1, (20)). To exclude the possibility that the depolarization-induced potentiation of KCNQ2/Q3 currents is due to an increased outflux of K+ and an increased concentration of external K+, an external solution with elevated K+ (10 mm, ND96-10K) was used to see if this solution would exclude the depolarization-induced increase. In the presence of ND96-10K, a 15-min depolarization to 0 mV induced similar potentiation of KCNQ2/Q3 currents as was observed in the presence of ND96 solution (Fig. 2, A and B).
FIGURE 2.
External high potassium increases KCNQ2/Q3 currents. A, external K+ increased from 1 (ND96) to 10 mm (ND96–10K) did not affect the depolarization-induced potentiation of KCNQ2/Q3 currents. Black and gray lines indicate the current traces before and after a 15-min depolarization, respectively. B, summary data for A. C, incubation with high external K+ solution (ND96K) increased KCNQ2/Q3 currents. D, comparison of KCNQ2/Q3 current potentiation by depolarization (0 mV, 15 min) and high K+ solution incubation (15 min). E, G-V curves for KCNQ2/Q3 channels before and after a15-min incubation with high K+ solution incubation. The data were fitted with the Boltzmann function. **, p < 0.01.
We next tested the effect of high (96 mm) external K+ solution (ND96K). The membrane potential in the presence of ND96 was around −50 mV, and that in the presence of ND96K was around 0 mV (data not shown). Incubation with ND96K for 15 min led to potentiation of KCNQ2/Q3 currents (Fig. 2C). The average fold increase induced by ND96K incubation was similar to that induced by the depolarization at 0 mV (183 ± 14% versus 205 ± 6%, for ND96K and 0 mV, respectively) (Fig. 2D). Similar to voltage-clamp depolarization, high K+-induced depolarization did not affect the activation properties of KCNQ2/Q3 currents (Fig. 2E). The above results suggest that depolarization per se, and not increasing K+ outflux, contributes to the observed potentiation of KCNQ2/Q3 currents.
Depolarization Increases KCNQ2/Q3 Currents through Increasing Membrane PIP2 Levels
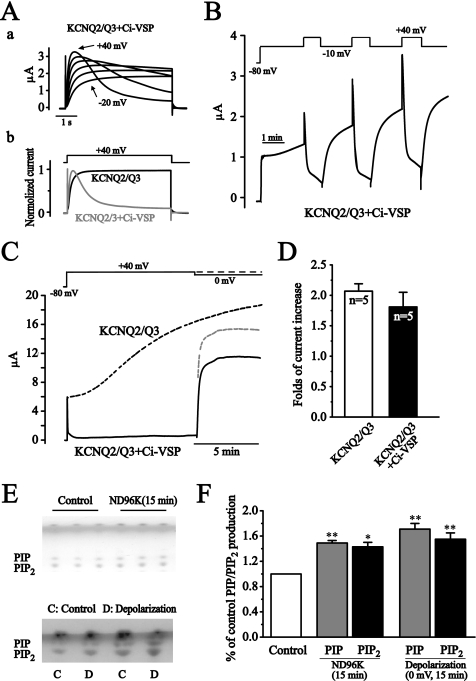
The membrane PIP2 is an essential and sufficient factor for KCNQ2/Q3 function (8). It has been shown that the resting membrane PIP2 concentration is not at a saturating concentration for KCNQ2/Q3 activity, less so for KCNQ2 activity (14). These facts and our observation that the depolarization increased KCNQ2 currents more than KCNQ2/Q3 currents (Fig. 1F), led us to speculate that the depolarization-induced enhancement of KCNQ2/Q3 currents could be the result of increased membrane PIP2 level. Two strategies were used to test this hypothesis. First, we utilized the recently described voltage sensor-containing phosphatase (Ci-VSP) (17). Ci-VSP is a membrane voltage (depolarization) activated phosphoinositides phosphatase that can dephosphorylate PIP2 and thus inhibit the function of PIP2-dependent channels including KCNQ2/Q3 (17). If the increased activity of KCNQ2/Q3 we observed here is indeed through PIP2 then the same depolarization-dependent activation of Ci-VSP should antagonize the increase. Co-expression of Ci-VSP with KCNQ2/Q3 made the channel currents susceptible to depolarization-induced inhibition; the activated KCNQ2/Q3 currents quickly declined when the membrane was depolarized to more positive than +40 mV (Fig. 3A). A protocol was designed to see both the depolarization-induced potentiation and inhibition of KCNQ2/Q3 currents in Ci-VSP-expressing oocytes. In this case, the membrane was depolarized from −80 mV to −10 mV and then was held at −10 mV for 10 min, but interrupted by three short (800 ms) steps of further depolarization to +40 mV. The depolarization to −10 mV is positive enough to activate the potentiation process (Fig. 1C), but negative enough to keep the Ci-VSP inactive (supplemental Fig. S1B); a short (800 ms) further depolarization to +40 mV is positive enough to activate Ci-VSP, but is too short to have a significant effect on the potentiation process (Fig. 1B). Depolarization to −10 mV gradually increased KCNQ2/Q3 current, and this increase was clearly antagonized by the Ci-VSP activated at +40 mV, manifested by an abrupt and significant reduction of the current (Fig. 3B). It seems that activation of Ci-VSP interrupted but did not cancel the final potentiation capacity of the depolarization on KCNQ2/Q3 currents. This was confirmed by the results shown in Fig. 3C. In this experiment, depolarization to +40 mV (activate KCNQ2/Q3 and Ci-VSP) immediately inhibited the activated KCNQ2/Q3 currents almost completely. The inhibition persisted during the sustained depolarization at +40 mV. When Ci-VSP was inactivated by changing the potential to 0 mV, the currents recovered rapidly and actually to a higher level, which was unexpected since the membrane potential was now 0 mV instead of the original +40 mV. When the recovered current was enlarged, assuming the potential was +40 mV instead of 0 mV (driving force is the only difference in this range of membrane potential, Fig. 1E), it reached the level (light dotted line, Fig. 3C) that would be expected for KCNQ2/Q3 currents after being exposed to +40 mV for 10 min in the absence of Ci-VSP action (dotted line) (Fig. 3D).
FIGURE 3.
Depolarization increases KCNQ2/Q3 currents through increasing membrane PIP2 level. A, co-expressed Ci-VSP was activated at depolarization potentials and induced an inhibition of KCNQ2/Q3 currents. Aa shows the current traces elicited by depolarization from −20 mV to +40 mV. Ab shows the comparison of the currents elicited by +40 mV depolarization with (gray) or without (black) Ci-VSP coexpression. B, activation of Ci-VSP antagonized the depolarization-induced potentiation of KCNQ2/Q3 current. Lesser depolarization to −10 mV was used to activate KCNQ2/Q3 currents only, whereas larger depolarization to +40 mV was used to activate Ci-VSP. C, activation of Ci-VSP interrupted but did not cancel the depolarization-induced potentiation of KCNQ2/Q3 currents. The black dotted line was an average representative current trace seen for KCNQ2/Q3 alone under the depolarization (+40 mV). The solid line was the KCNQ2/Q3 currents from oocytes co-expressing Ci-VSP, recorded using the protocol shown above (solid line). The gray dotted line presented KCNQ2/3 currents computed as if the membrane were depolarized to +40 mV rather than 0 mV where the currents were measured. D, summary data of fold-current increases from KCNQ2/Q3 only, and KCNQ2/Q3+Ci-VSP oocytes. The currents were measured 10 min after holding the membrane at +40 mV. E, high K+ incubation and depolarization increased PIP and PIP2 levels. Cellular PIP and PIP2 levels were measured using thin layer chromatography (TLC). Oocytes were incubated either in ND96 (control) or in ND96K for 15 min (upper panel), or were held either at −80 mV (control) or 0 mV (depolarization) for 15 min (lower panel). Triplicate (upper panel) or duplicate samples (lower panel) from a single experiment are shown. F, summary data for E. The dots in E were quantified and normalized to the control level. Data are summary of three independent experiments. **, p < 0.01.
The second strategy we used was to measure phosphoinositide levels directly by using the TLC method (see “Experimental Procedures” and Ref. 21). Fig. 3E shows the results of PIP and PIP2 dots visualized with iodine vapor. The identity of PIP and PIP2 was confirmed with mass spectrometry (supplemental Fig. S2). High K+ solution (ND96K) incubation increased PIP and PIP2 levels by 49 ± 4% and 43 ± 7% (Fig. 3F), respectively. Similarly, depolarization at 0 mV also increased PIP and PIP2 levels by 71 ± 9% and 55 ± 10%, respectively (Fig. 3F).
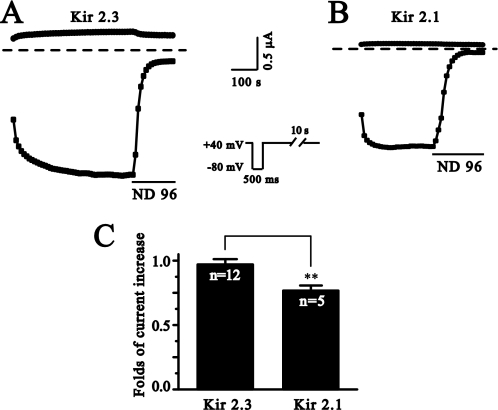
We also tested the effect of the depolarization on two members of inwardly rectifying K+ channels (Kir), Kir2.1 and Kir2.3. These two channels have been well characterized in regard to their modulation by PIP2 (22). The membrane depolarization increased the activity of both channels (Fig. 4). Furthermore, the depolarization increased Kir2.3 currents more than it did to Kir2.1 currents and with a slower time course, consistent with the fact that Kir2.3 has a lower apparent affinity than Kir2.1 with PIP2 (22).
FIGURE 4.
The membrane depolarization potentiates Kir2.1 and Kir2.3 currents. Kir2.3 (A) and Kir2.1 (B) currents were elicited in ND96-10K solution by the protocol shown. Brief hyperpolarization to −80 mV for 500 ms was separated by long depolarization of +40 mV. Current traces above and below the dotted zero current lines were the currents from +40 mV and −80 mV, respectively. C, summary data for folds of current increase at −80 mV after 10 min using the protocol shown. **, p < 0.01.
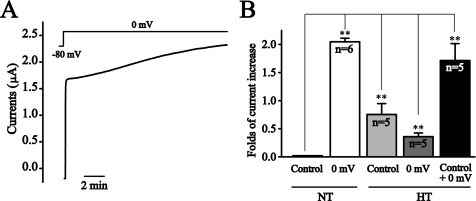
A recent study demonstrated that hypertonic stress increases PIP2 levels by activating PIP5KIβ (23). We tested if preincubating the oocytes with hypertonic solution would blunt the depolarization-induced KCNQ2/Q3 current increase. Indeed, preincubation significantly reduced the effect of depolarization, whereas the hypertonic solution on its own increased KCNQ2/Q3 currents (Fig. 5). Overall, the above results suggest that the depolarization increases KCNQ currents by elevating PIP2 levels in the oocytes.
FIGURE 5.
Hypertonic stress reduces the depolarization-induced potentiation of KCNQ2/Q3 currents. A, oocytes were incubated in either normal (NT) or hypertonic solution (HT, ND96 plus 96 mm NaCl) for 10 min, and then were depolarized to 0 mV for 10 min. B, summary data for: control (current amplitudes at the beginning of 10 min depolarization at 0 mV) after 10 min of incubation in either normal (NT) or hypertonic solution (HT), increased currents by 10 min depolarization at 0 mV (0 mV), and total increased currents by 10 min of HT incubation and 10 min of 0 mV depolarization (control + 0 mV) compared with NT control. **, p < 0.01.
Depolarization Increases PIP2 Levels through Increased Activity of PI4 Kinase
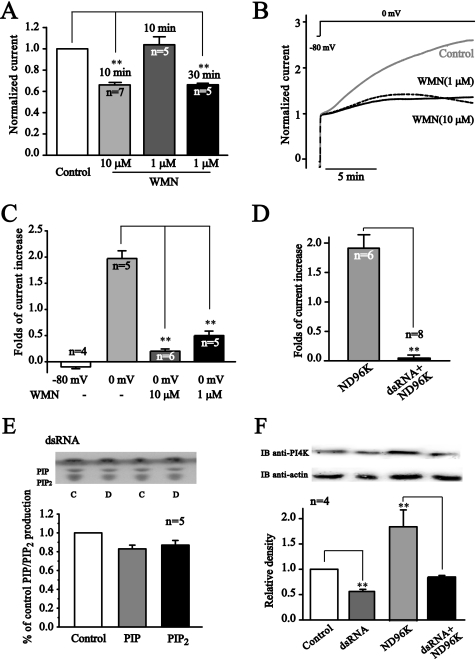
If the depolarization-induced enhancement of KCNQ2/Q3 currents was due to an increased synthesis of PIP2, then blocking the synthesis of PIP2 would be expected to prevent the depolarization-induce enhancement of KCNQ2/Q3 currents. For this, wortmannin, a blocker of PI4 kinase was used to test this possibility. Wortmannin, when applied at 10 μm in an incubation solution for 10 min, reduced KCNQ2/Q3 currents by 33.8 ± 1% (n = 7) (Fig. 6A), indicating an active endogenous phosphoinositide metabolism involving PI4 kinase. Wortmannin at 1 μm did not affect KCNQ2/Q3 currents when applied for 10 min, but induced a 34 ± 2% (n = 5) inhibition when applied for 30 min (Fig. 6A). The time-dependent effect of wortmannin indicated a low potency in inhibiting PI4 kinase at a low concentration, as described (24). When applied during the period of depolarization, both concentrations of wortmannin greatly reduced the depolarization-induced enhancement of KCNQ2/Q3 currents (Fig. 6, B and C).
FIGURE 6.
Wortmannin and dsRNA for PI4 kinase abolished the depolarization-induced increase of PIP2 and potentiation of KCNQ2/Q3 currents. A, treatment with 10 μm wortmannin (WMN) for 10 min and 1 μm for 30 min reduced KCNQ2/Q3 currents. B, potentiation of KCNQ2/Q3 currents by depolarization (control, gray line) was mostly abolished by pretreatment with either 1 μm (dashed line) or 10 μm (solid line) wortmannin for 10 min. The initial current amplitudes immediately following depolarization to 0 mV were normalized. C, summary data for B. D, dsRNA for PI4Kβ abolished the ND96K-induced potentiation of KCNQ2/Q3 currents. **, p < 0.01. E, dsRNA for PI4Kβ abolished depolarization (0 mV)-induced increases of membrane PIP2 level. F, Western blot of PI4Kβ for control, dsRNA-injected, ND96K-incubated, and dsRNA plus ND96K-incubated oocytes.
We also tested the effect of depressing expression of PI4 kinase on depolarization-induced potentiation of KCNQ2/Q3 currents. Double-stranded RNA (dsRNA) and siRNA against the endogenous PI4 kinase of Xenopus oocytes (PI4Kβ) was used to decrease levels of the enzyme. The 634 base pair (corresponding to bases 1038–1671) dsRNA was synthesized from a cDNA clone of PI4Kβ isolated from Xenopus oocytes (ordered from Open Biosystems. GenBankTM access no. BC073760). Injection of the dsRNA reduced the basal expression level and abolished the depolarization-induced increase in PI4 kinase expression (Fig. 6F). In agreement with these results, the dsRNA completely abolished the depolarization-induced potentiation of KCNQ2/Q3 currents (Fig. 6D). Furthermore, the dsRNA also prevented depolarization-induced membrane PIP2 increase (Fig. 6E). Similar results were obtained when siRNA was used (data not shown).
Physiological Stimulation Mimicking Action Potentials Frequency Dependently Increase KCNQ2/Q3 Currents
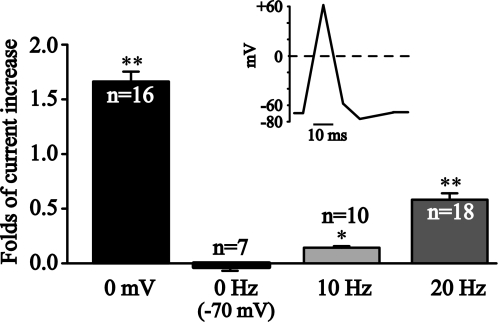
We tested if a more “physiological” activity of membrane potentials would also modulate KCNQ2/Q3 currents. For this, we used a voltage clamp protocol mimicking neuronal action potential (Fig. 7). Four groups of oocytes were compared: (1), oocytes were clamped at 0 mV for 10 min; (2), oocytes were clamped at −70 mV for 10 min; (3), oocytes were applied with voltage clamp protocol shown in Fig. 7 every 100 ms (10 Hz) from a holding potential of −70 mV for 10 min; (4) oocytes were applied with voltage clamp protocol shown in Fig. 7 every 50 ms (20 Hz) from a holding potential of −70 mV for 10 min. Fold-current increases after 10 min of each above the voltage clamp protocol were shown and compared. Clearly the low frequency of “physiological” membrane potential activity (10 Hz) already increased KCNQ2/Q3 currents compared with quiescent cells (0 Hz, held at −70 mV). This stimulation at higher frequency (20 Hz) further significantly increased KCNQ2/Q3 currents.
FIGURE 7.
Membrane potentials mimicking neuronal action potential frequency dependently increased KCNQ2/Q3 currents. A neuronal action potential-like voltage clamp protocol was designed and used to stimulate oocytes with different frequencies. Oocytes were either continuously depolarized (0 mV), or continuously hyperpolarized (−70 mV), or stimulated with action potential-like protocol at 10 or 20 Hz. Fold-current increases after 10 min of the above voltage protocols were compared. *, p < 0.05; **, p < 0.01 compared with continuously hyperpolarized (−70 mV) cells.
DISCUSSION
The present study demonstrates that membrane depolarization increases cellular PIP2 levels through increased PIP2 synthesis mediated by PI4 kinase. To our knowledge, this is a novel finding that broadens our understanding on the roles that membrane potential may play in cellular signaling. With increased recognition of the importance of PIP2 in cell function, the effect of membrane depolarization in PIP2 metabolism is destined to have important physiological implications.
KCNQ channels were found to have a highly variable maximal open probability (25, 26), which was explained by a differential apparent affinity among the channels for PIP2 (14). Consistent with highly differential PIP2 affinities for KCNQ2 and KCNQ3, overexpression or overactivation of PI(4)P5 kinase greatly increased the amplitude of whole-cell KCNQ2 currents, but not of KCNQ3 currents, and KCNQ2/Q3 currents were increased modestly (14, 15). This suggests that KCNQ2 channels are normally only marginally saturated by PIP2, whereas KCNQ3 channels are nearly fully saturated and KCNQ2/Q3 channels are in between, analogous to the differential affinity for PIP2 that has been proposed for Kir channels (22, 27, 28). In line with these observations, we found that the membrane depolarization increased KCNQ2 currents more than KCNQ2/Q3 currents. KCNQ2(H328C)/Q3 mutant was shown to be less sensitive to PIP2 (8). Accordingly, KCNQ2(H328C)/Q3 currents tend to be increased to a greater degree by depolarization than KCNQ2/Q3 currents (supplemental Fig. S3). Similarly, the depolarization increased Kir2.3 currents to a greater extent than Kir2.1 currents (Fig. 4C). Our previous study demonstrated that Kir2.1 has a higher apparent affinity for PIP2 than Kir2.3 (22). Thus, the depolarization-induced potentiation of KCNQ channels currents was most likely due to an increased membrane PIP2 level. This was confirmed by the direct measurement of PIP2 in the cells. Elevated PIP2 is most likely the result of increased activity of PI4 kinase, since wortmannin (a PI4 kinase inhibitor) totally abolished the depolarization-induced potentiation of KCNQ2/Q3 currents.
It is not yet clear from the present study what is the voltage-sensing mechanism for the observed increase of PI4 kinase activity and PIP2 level. We have studied the roles of voltage-dependent Ca2+ channels and Ca2+ may play in this regard. L-type Ca2+ channels are believed to be the voltage-sensing mechanism for depolarization-induced activation of PLC in skeletal muscle cells (29, 30). However, in the absence of extracellular Ca2+, the depolarization induced a similar enhancement of KCNQ2/Q3 currents (supplemental Fig. S4).
Apart from the well-known effects of membrane potentials on functions of voltage-dependent ion channels, evidence is accumulating suggesting that membrane voltage is an important regulator on functions of non-conventional voltage sensing proteins. A prototype example is the voltage-dependent activation of phosphoinositides specific phosphatase, Ci-VSP (17), as we used in this study. Another example is modulation of G protein-coupled receptor (GPCR) signaling by membrane potential. It is believed that voltage-sensitive GPCR signaling using mechanisms localized at the GPCR per se, or direct coupling interface between GPCR and immediate downstream effectors (31–33). Recently, two muscarinic receptors (M2R and M1R) were shown to have charge-movement-associated currents analogous to gating currents of voltage-gated channels. The results indicate that GPCRs serve as sensors for both transmembrane potential and external chemical signals (34). It is interesting to note that while the depolarization-induced modulation of GPCR signaling is graded and with no apparent threshold or upper limit (32), the voltage-dependent potentiation effect of depolarization on KCNQ2/Q3 currents resembles the voltage-dependent activation of ion channels (Fig. 1C).
The present study presents an important novel mechanism for phosphoinositides metabolism that could have broad physiological implications. It is clear from data shown in Fig. 7 that physiological stimulation like action potential could significantly modulate function of PIP2-sensitive proteins including but not solely ion channels, if a similar membrane potential mediated phosphoinositides metabolism system exists in cells where these proteins reside. We tried on dorsal root ganglion (DRG) to see if a similar depolarization-induced modulation of M/KCNQ currents exists in these neurons. Instead, depolarization-associated depression of M/KCNQ currents was observed, which is probably not linked with altered phosphoinositides metabolism.4 Nevertheless, the membrane potentials and excitation of cells are surely important modulating factors for cellular phosphoinositides and their relevant functions, as exemplified in cardiac myocytes (35) and in neurons (36). Clearly, more work needs to be done to understand the detailed mechanisms and physiological significance of voltage-dependent modulation of phosphoinositides metabolism.
Supplementary Material
Acknowledgments
We thank Drs. Tooraj Mirshahi and Nikita Gamper for reading the manuscript and for their suggestions.
This work was supported by the National Natural Science Foundation of China (30730031, to H. Z., 30500112, to X. D.) and the National Basic Research Program (2007CB512100).

The on-line version of this article (available at http://www.jbc.org) contains supplemental Figs. S1–S4.
H. Zhang, unpublished observations.
- PIP2
- phosphatidylinositol 4,5-bisphosphate
- PLC
- phospholipase C
- TEVC
- two-electrode voltage clamp
- ds
- double-stranded.
REFERENCES
- 1.McLaughlin S., Wang J., Gambhir A., Murray D. (2002) Annu. Rev. Biophys. Biomol. Struct. 31, 151–175 [DOI] [PubMed] [Google Scholar]
- 2.Di Paolo G., De Camilli P. (2006) Nature 443, 651–657 [DOI] [PubMed] [Google Scholar]
- 3.Krauss M., Haucke V. (2007) EMBO Rep. 8, 241–246 [DOI] [PMC free article] [PubMed] [Google Scholar]
- 4.Hilgemann D. W., Feng S., Nasuhoglu C. (2001) Sci. STKE 2001, re19. [DOI] [PubMed] [Google Scholar]
- 5.Suh B. C., Hille B. (2005) Curr. Opin. Neurobiol. 15, 370–378 [DOI] [PubMed] [Google Scholar]
- 6.Gamper N., Shapiro M. S. (2007) Nat. Rev. Neurosci. 8, 921–934 [DOI] [PubMed] [Google Scholar]
- 7.Suh B. C., Hille B. (2002) Neuron 35, 507–520 [DOI] [PubMed] [Google Scholar]
- 8.Zhang H., Craciun L. C., Mirshahi T., Rohács T., Lopes C. M., Jin T., Logothetis D. E. (2003) Neuron 37, 963–975 [DOI] [PubMed] [Google Scholar]
- 9.Ford C. P., Stemkowski P. L., Light P. E., Smith P. A. (2003) J. Neurosci. 23, 4931–4941 [DOI] [PMC free article] [PubMed] [Google Scholar]
- 10.Delmas P., Brown D. A. (2005) Nat. Rev. Neurosci. 6, 850–862 [DOI] [PubMed] [Google Scholar]
- 11.Jia Q., Jia Z., Zhao Z., Liu B., Liang H., Zhang H. (2007) J. Neurosci. 27, 2503–2512 [DOI] [PMC free article] [PubMed] [Google Scholar]
- 12.Jia Z., Bei J., Rodat-Despoix L., Liu B., Jia Q., Delmas P., Zhang H. (2008) J. Gen. Physiol. 131, 575–587 [DOI] [PMC free article] [PubMed] [Google Scholar]
- 13.Wenk M. R., Pellegrini L., Klenchin V. A., Di Paolo G., Chang S., Daniell L., Arioka M., Martin T. F., De Camilli P. (2001) Neuron 32, 79–88 [DOI] [PubMed] [Google Scholar]
- 14.Li Y., Gamper N., Hilgemann D. W., Shapiro M. S. (2005) J. Neurosci. 25, 9825–9835 [DOI] [PMC free article] [PubMed] [Google Scholar]
- 15.Suh B. C., Inoue T., Meyer T., Hille B. (2006) Science 314, 1454–1457 [DOI] [PMC free article] [PubMed] [Google Scholar]
- 16.Winks J. S., Hughes S., Filippov A. K., Tatulian L., Abogadie F. C., Brown D. A., Marsh S. J. (2005) J. Neurosci. 25, 3400–3413 [DOI] [PMC free article] [PubMed] [Google Scholar]
- 17.Murata Y., Iwasaki H., Sasaki M., Inaba K., Okamura Y. (2005) Nature 435, 1239–1243 [DOI] [PubMed] [Google Scholar]
- 18.Murata Y., Okamura Y. (2007) J. Physiol. 583, 875–889 [DOI] [PMC free article] [PubMed] [Google Scholar]
- 19.Wang H. S., Pan Z., Shi W., Brown B. S., Wymore R. S., Cohen I. S., Dixon J. E., McKinnon D. (1998) Science 282, 1890–1893 [DOI] [PubMed] [Google Scholar]
- 20.Wood M. J., Korn S. J. (2000) Biophys. J. 79, 2535–2546 [DOI] [PMC free article] [PubMed] [Google Scholar]
- 21.Xu C., Watras J., Loew L. M. (2003) J. Cell Biol. 161, 779–791 [DOI] [PMC free article] [PubMed] [Google Scholar]
- 22.Du X., Zhang H., Lopes C., Mirshahi T., Rohacs T., Logothetis D. E. (2004) J. Biol. Chem. 279, 37271–37281 [DOI] [PubMed] [Google Scholar]
- 23.Yamamoto M., Chen M. Z., Wang Y. J., Sun H. Q., Wei Y., Martinez M., Yin H. L. (2006) J. Biol. Chem. 281, 32630–32638 [DOI] [PubMed] [Google Scholar]
- 24.Nakanishi S., Catt K. J., Balla T. (1995) Proc. Natl. Acad. Sci. U.S.A. 92, 5317–5321 [DOI] [PMC free article] [PubMed] [Google Scholar]
- 25.Li Y., Gamper N., Shapiro M. S. (2004) J. Neurosci. 24, 5079–5090 [DOI] [PMC free article] [PubMed] [Google Scholar]
- 26.Selyanko A. A., Hadley J. K., Brown D. A. (2001) J. Physiol. 534(Pt 1), 15–24 [DOI] [PMC free article] [PubMed] [Google Scholar]
- 27.Huang C. L., Feng S., Hilgemann D. W. (1998) Nature 391, 803–806 [DOI] [PubMed] [Google Scholar]
- 28.Zhang H., He C., Yan X., Mirshahi T., Logothetis D. E. (1999) Nat. Cell Biol. 1, 183–188 [DOI] [PubMed] [Google Scholar]
- 29.Araya R., Liberona J. L., Cárdenas J. C., Riveros N., Estrada M., Powell J. A., Carrasco M. A., Jaimovich E. (2003) J. Gen. Physiol. 121, 3–16 [DOI] [PMC free article] [PubMed] [Google Scholar]
- 30.Eltit J. M., Hidalgo J., Liberona J. L., Jaimovich E. (2004) Biophys. J. 86, 3042–3051 [DOI] [PMC free article] [PubMed] [Google Scholar]
- 31.Ben-Chaim Y., Tour O., Dascal N., Parnas I., Parnas H. (2003) J. Biol. Chem. 278, 22482–22491 [DOI] [PubMed] [Google Scholar]
- 32.Billups D., Billups B., Challiss R. A., Nahorski S. R. (2006) J. Neurosci. 26, 9983–9995 [DOI] [PMC free article] [PubMed] [Google Scholar]
- 33.Martinez-Pinna J., Gurung I. S., Vial C., Leon C., Gachet C., Evans R. J., Mahaut-Smith M. P. (2005) J. Biol. Chem. 280, 1490–1498 [DOI] [PubMed] [Google Scholar]
- 34.Ben-Chaim Y., Chanda B., Dascal N., Bezanilla F., Parnas I., Parnas H. (2006) Nature 444, 106–109 [DOI] [PubMed] [Google Scholar]
- 35.Nasuhoglu C., Feng S., Mao Y., Shammat I., Yamamato M., Earnest S., Lemmon M., Hilgemann D. W. (2002) Am. J. Physiol. Cell Physiol. 283, C223–C234 [DOI] [PubMed] [Google Scholar]
- 36.Micheva K. D., Holz R. W., Smith S. J. (2001) J. Cell Biol. 154, 355–368 [DOI] [PMC free article] [PubMed] [Google Scholar]
Associated Data
This section collects any data citations, data availability statements, or supplementary materials included in this article.


