Abstract
All but 11 of the 323 known actin sequences have Tyr at position 53, and the 11 exceptions have the conservative substitution Phe, which raises the following questions. What is the critical role(s) of Tyr-53, and, if it can be replaced by Phe, why has this happened so infrequently? We compared the properties of purified endogenous Dictyostelium actin and mutant constructs with Tyr-53 replaced by Phe, Ala, Glu, Trp, and Leu. The Y53F mutant did not differ significantly from endogenous actin in any of the properties assayed, but the Y53A and Y53E mutants differed substantially; affinity for DNase I was reduced, the rate of nucleotide exchange was increased, the critical concentration for polymerization was increased, filament elongation was inhibited, and polymerized actin was in the form of small oligomers and imperfect filaments. Growth and/or development of cells expressing these actin mutants were also inhibited. The Trp and Leu mutations had lesser but still significant effects on cell phenotype and the biochemical properties of the purified actins. We conclude that either Tyr or Phe is required to maintain the functional conformations of the DNase I-binding loop (D-loop) in both G- and F-actin, and that the conformation of the D-loop affects not only the properties that directly involve the D-loop (binding to DNase I and polymerization) but also allosterically modifies the conformation of the nucleotide-binding cleft, thus increasing the rate of nucleotide exchange. The apparent evolutionary “preference” for Tyr at position 53 may be the result of Tyr allowing dynamic modification of the D-loop conformation by phosphorylation (Baek, K., Liu, X., Ferron, F., Shu, S., Korn, E. D., and Dominguez, R. (2008) Proc. Natl. Acad. Sci. U.S.A. 105, 11748–11753) with effects similar, but not identical, to those of the Ala and Glu mutations.
Keywords: Cytoskeleton/Actin, Phosphorylation/Cytoskeletal Proteins, Protein/Protein-Protein Interactions, Protein/Allosteric, Protein/Contractile, Protein/Protein-Protein Interactions, Protein/Sequence, Protein/Structure
Introduction
Actin is one of the most highly conserved proteins, with all actins having the same amino acid in at least 7% of the 375 positions (1) and about 95% of actins having the same amino acid in about 66% of the positions. The substitution in 74% of the positions that have at least one substitution is always the same amino acid, often a conservative substitution (1). Tyr-53 is an example of this last situation. All but 11 (3.5%) of the 323 actin sequences in the data base PROSITE, entry PDOC00340, have Tyr at position 53, with Phe replacing Tyr in all 11 exceptions: five Plasmodium actins (Q4ZIL3, Q8I440, P10988, P8687, and Q7RME1), three Trypanosoma actins (P12432, P12433, and P53477), and one actin each from Arabidopsis (Q8RY62), Euplotes (P20360), and Pichia (Q9P4D1).
One could ask, in this and similar situations, what is the critical role of the amino acid (Tyr in this example) that leads to its strong conservation throughout evolution, and why is it, very occasionally, replaced by one, and only one, other amino acid (Phe in this example). The conservation of Tyr-53 is particularly striking because the immediately adjacent DNase I-binding loop (D-loop)2 in subdomain 2, originally defined as residues 40–50 (2), is one of the actin regions in which mutations are most common. It may be relevant that Tyr-53 is dynamically phosphorylated when Dictyostelium amoebae are subjected to stress (3–6) and during the developmental cycle, accounting for 50% of the actin in spores (7–10), and rapidly dephosphorylated prior to spore germination. Tyr-phosphorylated actin also occurs in cysts of Acanthamoeba (10) and in Mimosa petioles, where dephosphorylation accompanies leaf folding (11, 12), and mass spectroscopic data indicate the presence of Tyr-53 phosphorylated actin in cultured cancer cells (13).
To understand the consequences of Tyr-53 phosphorylation at the molecular level, we had previously determined some of the biochemical and biophysical properties and the atomic structure of pY53-actin isolated from Dictyostelium (10, 14). Briefly summarized, the crystal structure of pY53-actin shows the formation of hydrogen bonds between the phosphate group and residues Gly-48, Gln-49, and Lys-61 (14), thus partially stabilizing the D-loop, which is fully disordered in unphosphorylated actin, allowing the resolution of D-loop residues Gly-42, Met-47, Gly-48, and Gln-49.
As a consequence of the conformational change in the D-loop, phosphorylation of Tyr-53 reduces the rate of subtilisin cleavage of the D-loop (10), reduces the affinity of monomeric actin for pancreatic DNase I (14), and reduces the rate of nucleotide exchange in monomeric actin (14). Phosphorylation of Tyr-53 also affects actin polymerization (10). The critical concentration is increased, the rates of nucleation and pointed end elongation are reduced, polymerization and ATP hydrolysis are partially uncoupled, and filaments of pY53-actin are unstable such that polymerized pY53-actin is predominantly in the form of very short oligomers. These observations raise the question whether the effects of Tyr-53 phosphorylation are due to the “loss” of tyrosine or the addition of phosphate.
In the research reported in this paper, we initially studied the biochemical and biophysical properties of Dictyostelium actin with Tyr-53 replaced by either Phe, to mimic Tyr; Glu, to mimic the negative charge of phospho-Tyr; Ala, to remove the bulky (hydrophobic) side chain; or Leu and Trp, to determine whether any hydrophobic amino acid could replace Tyr-53 or if an aromatic amino acid were required. With that as background, we then examined the effects of expression of the mutant actins on cell growth and development.
EXPERIMENTAL PROCEDURES
Mutation of Actin
Dictyostelium actin cDNA (a generous gift of Dr. Gunther Gerisch (Max-Planck-Institut für Biochemie, Martinsried, Germany)) was mutated at position Tyr-53 by PCR to Phe, Ala, Glu, Leu, or Trp. A FLAG sequence followed by a TEV-protease cleavage site (TEVCS) (DYKDDDDK-ENLYFQG) was fused to the N terminus of the mutated actins (Y/F, Y/A, Y/E, Y/L, and Y/W) and WT actin (Y/Y), which was expressed as a control. WT and mutant actin cDNAs were cloned into a pTIKL vector, which has an actin 15 promoter and G-418 resistance (15).
Expression and Purification of FLAG-TEVCS-Actins
WT and mutant actin DNAs were transfected into AX3 cells by standard electroporation. G-418-resistant cells were selected by growing cells on plates with HL-5 medium containing 16 μg/ml G-418, and cell lines were maintained on plates. For protein purification, cells were grown in suspension culture in five 4-liter flasks, or, for Y/W-actin, on multiple 25 × 25-cm plates. Cells were harvested; washed in 10 mm Tris, pH 7.5; lysed (40 g/280 ml) in G-buffer (4 mm Tris, 0.1 mm CaCl2, 0.2 mm ATP, 1 mm dithiothreitol, pH 7.5) containing 0.6% Triton X-100, 0.1 mm phenylmethylsulfonyl fluoride, and protease inhibitor tablets (Roche Applied Science); and centrifuged at 40,000 rpm for 40 min at 4 °C. The supernatant was mixed with 40 g of DEAE-52 for 1 h, the mixture was loaded onto a 25 × 20-cm column, and the column was eluted with 100 ml of buffer containing 10 mm imidazole, pH 7.5, 0.1 mm CaCl2, 0.2 mm ATP, and 1 mm dithiothreitol with a gradient from 0.1 to 0.5 m KCl followed by 50 ml of the same buffer containing 0.5 m KCl. The fractions containing actin (identified by SDS-PAGE) were pooled and mixed with 8 ml of anti-FLAG resin (Sigma) in G-buffer. The column was washed with G-buffer and eluted with G-buffer containing 0.1 mg/ml FLAG peptide. The FLAG-TEVCS-actins were then incubated on ice overnight with TEV-protease at a weight ratio of 20:1, to remove the FLAG-TEVCS peptide. The resultant actin was further purified by fast protein liquid chromatography on a mono P HR 5/20 column (GE Healthcare) eluted with 120 ml of buffer containing 10 mm Tris, pH 8.0, 0.1 mm CaCl2, 0.2 mm ATP, and 1 mm dithiothreitol with a gradient of KCl from 0 to 500 mm. The actin fractions identified by SDS-PAGE were pooled, concentrated by Amicon Ultra-4 (Millipore) filtration to ∼1 mg/ml, and dialyzed against G-buffer overnight. The actin was centrifuged at 100,000 rpm for 2 h at 4 °C in a Beckman TL-100 centrifuge before use.
Purification of Endogenous Actin
Endogenous WT actin was purified as a by-product of the purifications of the mutant actins. WT actin was precipitated from the flow-through from the FLAG affinity column by the addition of (NH4)2SO4 to 50% saturation, dissolved in ∼30 ml of G-buffer, and polymerized on ice for 1 h after the addition of MgCl2 to 2 mm. The polymerized actin was collected by centrifugation at 40,000 rpm for 1 h at 4 °C, and the pellet was depolymerized by overnight dialysis against G-buffer. The depolymerized actin was further purified by chromatography on a 26 × 60-cm Sephacryl S-200 column (GE Healthcare) in G-buffer and a mono P HR 5/20 column, dialyzed against G-buffer overnight, and centrifuged at 100,000 rpm for 2 h at 4 °C in a Beckman TL-100 centrifuge before use.
Expression and Purification of TEV-Protease
The bacterial strain carrying the TEV-protease expression vector was a generous gift of Dr. David S. Waugh (NCI, National Institutes of Health). Expression and purification of TEV-protease were carried out as described by Tropea et al. (16).
Mass Spectroscopy
Mass spectrometric characterization of the proteins was carried out as described (10). Proteins were injected by reverse-phase chromatography on a narrow bore C18 column, with a flow rate of 20 μl/min, and analyzed on an Agilent Technologies model 1100 high pressure liquid chromatograph coupled to an Agilent model G1969A mass spectrometer with a time-of-flight detector.
Purification of Dictyostelium Myosin II and S1
Full-length myosin II and regulatory light chain kinase were purified as described (15), and the myosin light chain was phosphorylated by the addition of kinase, at a final concentration of 20 μg/ml, to ∼10 mg of myosin in 40 ml. Purified myosin II was dissolved in 50% glycerol and stored in liquid N2 before use. Expression and purification of S1 were performed according to the procedure described previously (17). S1 was kept in liquid N2 before use.
Subtilisin Cleavage
Subtilisin (Sigma) dissolved in G-buffer was added to 16 μm actin in G-buffer at a molar ratio of 1:5,200. Digestion was performed at 23 °C for 1 h with samples removed at the indicated times for analysis by SDS-PAGE on 10% polyacrylamide gels.
Nucleotide Exchange
The nucleotide exchange assay was performed as described (18). Free ATP was removed from G-actin by centrifugation of 65 μl of actin applied to a micro Bio-spin 30 chromatography column (Bio-Rad) in G-buffer minus ATP, the bound ATP was replaced by etheno-ATP (Molecular Probes), excess etheno-ATP was removed by centrifugal chromatography, and 0.1 mm ATP was added to 3 μm G-actin. The decrease in fluorescence as the ATP replaced bound etheno-ATP was monitored in an LS55 luminescence spectrometer (PerkinElmer Life Sciences) with an excitation wavelength of 340 nm and emission wavelength of 410 nm.
Polymerization
Endogenous and mutant actins in G-buffer were polymerized at 22 °C by the addition of KCl and MgCl2 to 100 and 2 mm, respectively. Polymerization was followed by right angle light scattering in a LS55 luminescence spectrometer with both emission and excitation wavelength of 360 nm and a slit width of 4 nm.
ATP Hydrolysis Accompanying Polymerization
Inorganic phosphate released by the hydrolysis of ATP during actin polymerization was measured by the Enzchek phosphate assay kit (Molecular Probes). In this assay, phosphate is quantified by the increased absorption at 360 nm when 2-amino-6-mercapto-7-methylpurine riboside is converted to 2 amino-6-mercapto-7-methyl-purine and ribose-1-phosphate catalyzed by purine nucleoside phosphorylase. Actin at the indicated concentrations was preincubated for 8 min with the assay reagents to remove inorganic phosphate before initiating polymerization by the addition of KCl and MgCl2. The final reaction mixtures contained 50 mm Tris, pH 7.5, 3 mm MgCl2, 0.2 mm ATP, 100 mm KCl, 0.2 mm 2-amino-6-mercapto-7-methylpurine riboside, 0.8 units of purine nucleoside phosphorylase, and actin as indicated in a volume of 600 μl. The final mixture was divided into two samples: 450 μl for measuring phosphate release and 150 μl for measuring polymerization by light scattering.
Determination of Critical Concentration
Actin at various concentrations in G-buffer was polymerized overnight at room temperature after the addition of KCl and MgCl2 to final concentrations of 100 and 2 mm, respectively, and the extent of polymerization was measured by light scattering.
In Vitro Motility Assay
The in vitro motility assay was carried out at 30 °C according to Ito et al. (19) with Dictyostelium myosin II. Actin at 5 μm in G-buffer was polymerized at room temperature for 3–5 h by the addition of MgCl2 to 2 mm and rhodamine-phalloidin to 5 μm, and the labeled actin was kept on ice until use. Motility buffer consisted of 25 mm Hepes, pH 7.4, 2 mm ATP, 4 mm MgCl2, and 10 mm dithiothreitol.
Actin-activated Dictyostelium Myosin S1 ATPase Activity
Steady-state ATPase activity was assayed in 20 mm imidazole, pH 7.5, 4 mm MgCl2, 25 mm KCl, 2 mm [γ-32P]ATP, 150 nm S1, and F-actin at the indicated concentrations. The production of 32Pi was determined as described (20) after incubation at 30 °C for 12 min, during which period the reaction rates were constant.
Electron Microscopy
Actin was polymerized overnight in the presence of 100 mm KCl, 2 mm MgCl2, and 5 mm Tris, pH 7.5. One drop of the filament suspension (0.1–0.5 mg/ml) was placed on a Formvar/carbon-coated, 400-mesh copper grid previously glow-discharged for 30 s in an EMScope TB500 sputter coater (Emscope Laboratories). After 1 min, the excess liquid was absorbed with filter paper. The grid was stained with a drop of 0.5% aqueous uranyl acetate for 30 s, the excess stain was removed with filter paper, and the sample was observed in a JEM-1200EX II transmission electron microscope (JEOL).
Other Biochemical Assays
SDS-PAGE was carried out according to Laemmli (21). Protein concentrations were determined by the Bradford method with bovine serum albumin as a standard. Actin concentration was determined by absorption at 290 nm using an extinction coefficient of 0.62 cm2/mg. DNase I activity was measured by the change in A260 when Sigma DNA (50 μg/ml) was added to 0.7 nm Sigma DNase I and the indicated concentrations of G-actin in 10 mm Tris, pH 8.0, 1 mm MgCl2, 0.1 ml CaCl2, and 1 mm NaN3 as described (10).
Cell Growth and Development
To measure cell growth, 50 ml of cells (1 or 2 × 10⁵ cells/ml) in HL-5 medium containing 16 μg/ml G-418 were cultured in a 250-ml flask on a rotary shaker at 145 rpm and 21 °C, and cells were counted daily using a cellometer (AutoT4 cell counter, Nexcelom Bioscience). For development assays, cells growing in HL-5 medium were washed twice with starvation buffer (20 mm Mes (Sigma), pH 6.8, 0.2 mMCaCl2, 2 mm MgSO4), and 6 × 10⁶ cells in 50 μl of starvation buffer were spread over one-third of a 10-cm diameter plate containing agarose in starvation buffer. Cells were observed for 48 h with a Discovery V12 stereomicroscope (Carl Zeiss) equipped with a PlanApos ×1.0 objective and an AxioCam camera automated by AxioVision 4 software.
Indirect Immunofluorescence Microscopy
For localization of total actin and expressed FLAG-TEVCS-actins, cells were fixed with 1% formaldehyde in cold methanol at −20 °C for 5 min, washed, and then incubated for 60 min at 37 °C with 100-fold diluted rabbit anti-actin (catalog number A-200, Sigma) and 500-fold diluted anti-FLAG-antibody (catalog number F-3165, Sigma) in phosphate buffer supplemented with 1% bovine serum albumin and 0.2% saponin. Secondary antibodies, fluorescein isothiocyantate-conjugated goat anti-mouse IgG and Texas Red-goat anti-rabbit IgG (Molecular Probes), were diluted 750-fold. Images were observed under an LSM-510 laser-scanning fluorescence microscope (Carl Zeiss).
RESULTS
Initially, Y/F, Y/A, and Y/E mutant actins, with an N-terminal FLAG-TEVCS tag, were expressed in Dictyostelium, purified, and separated from endogenous actin by FLAG-affinity chromatography, and the FLAG tag was removed by cleavage with TEV-protease, as described under “Experimental Procedures.” Because the expressed actins (Y/F, Y/A, and Y/E) had an N-terminal glycyl group instead of the N-terminal acetyl group of endogenous actin and were purified by a different procedure than endogenous actin, wild type actin (Y/Y) was also expressed and purified to serve as a control for any differences not related to the mutations at position 53. The purity of typical actin preparations was determined by SDS-PAGE (Fig. 1), and their sequences were confirmed by mass spectrometry (Table 1). The typical yield of purified, expressed actin was 1 mg per 10 g of cells.
FIGURE 1.
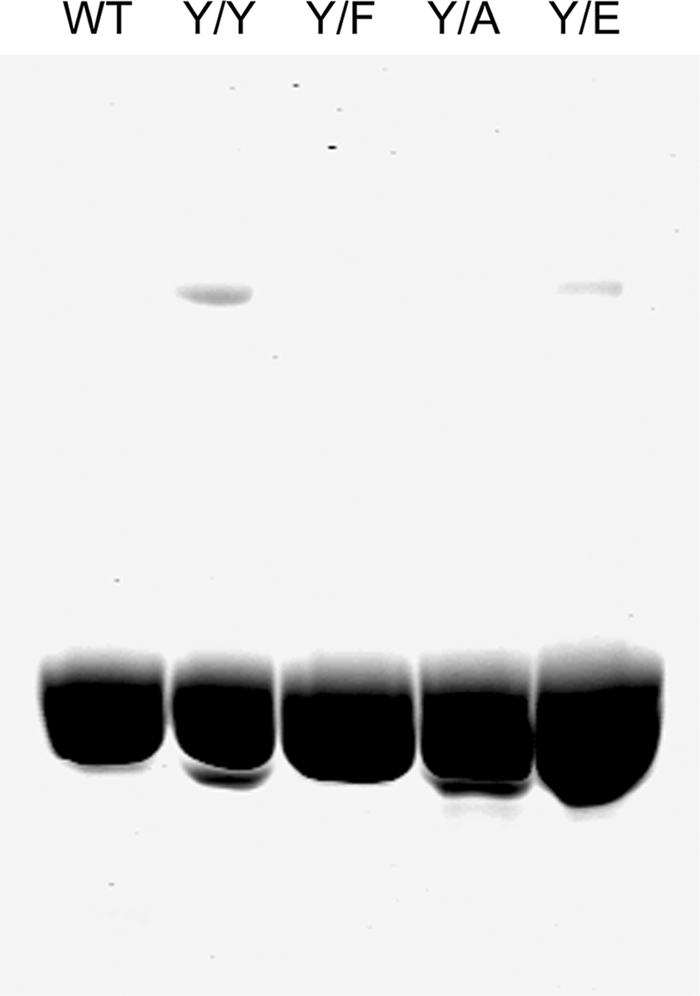
SDS-PAGE of purified actins. Typical preparations of purified endogenous WT actin and expressed Y/Y, Y/F, Y/A, and Y/E actins were analyzed on 10% polyacrylamide gels; 10 μg of proteins was added to each lane.
TABLE 1.
Comparison of calculated and experimental masses of endogenous wild-type and expressed actins
As described under “Results,” WT actin (endogenous Dictyostelium actin) has an N-terminal acetyl group, whereas the expressed actins have an N-terminal glycyl group in addition (except for Y/Y) to the indicated mutation of Tyr-53.
| Actin | Calculated mass | Experimental mass |
|---|---|---|
| Da | Da | |
| WT | 41,657.7 | 41,657.9 |
| Y/Y | 41,672.7 | 41,672.8 |
| Y/F | 41,656.7 | 41,656.6 |
| Y/A | 41,580.6 | 41,580.6 |
| Y/E | 41,638.6 | 41,638.4 |
| Y/W | 41,695.7 | 41,695.4 |
| Y/L | 41,622.7 | 41,622.7 |
Properties of Monomeric Y/F, Y/A, and Y/E Actins
We first studied the effects of the Y/F, Y/A, and Y/E mutations on three properties of monomeric actin: cleavage of the D-loop by subtilisin, inhibition of DNase I activity, and nucleotide exchange. There was little, if any difference, in the rate or the products of subtilisin cleavage of Y/Y or Y/F compared with WT (Fig. 2). Y/A was also cleaved at the same rate as WT, and Y/E was cleaved only slightly more slowly (Fig. 2), but both Y/A and Y/E showed a minor cleavage product in addition to the major product. The cleavage products of Y/Y and the major cleavage products of Y/E had the expected masses (Table 2) for cleavage of the D-loop between Met-47 and Gly-48 (22). The mass of the minor product of subtilisin cleavage of Y/E was consistent with cleavage between residues Leu-67 and Lys-68 (Table 2).
FIGURE 2.
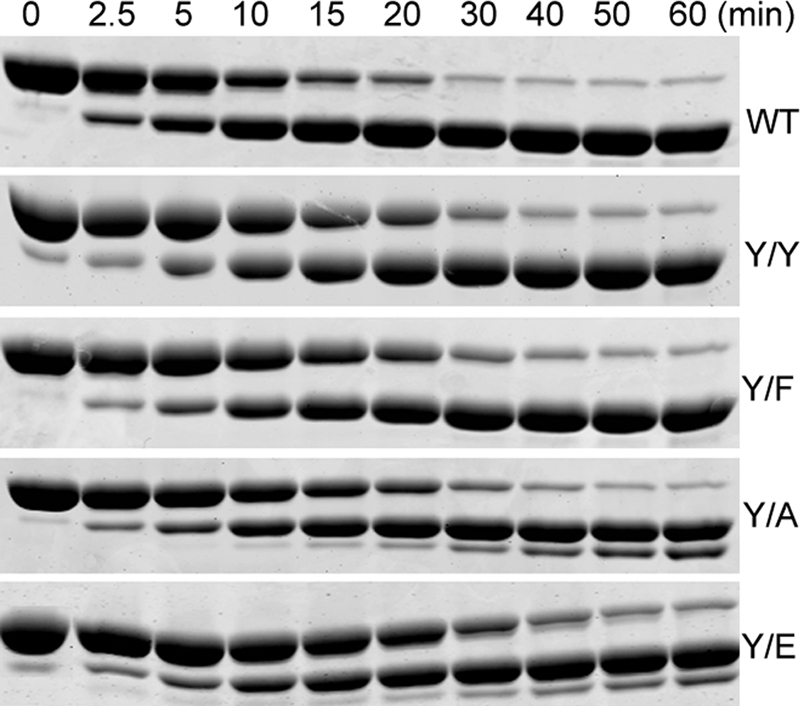
Subtilisin digestion of actins. WT, Y/Y, Y/F, Y/A, and Y/E actins were incubated with subtilisin (see “Experimental Procedures”), and aliquots were taken at the indicated times for SDS-PAGE analysis on 10% polyacrylamide gels.
TABLE 2.
Comparison of calculated and experimental masses of the subtilisin cleavage products of wild-type and Y/E actin
The 60-min digestion mixtures of WT and Y/E (Fig. 2) were analyzed by mass spectrometry. The N- and C-terminal peptides expected from cleavage between Met-47 and Gly-48 were found in both samples. The Y/E sample had an additional, minor C-terminal peptide consistent with cleavage between Leu-67 and Lys-68; a corresponding N-terminal peptide was not detected.
| Actin | Residues | Calculated mass | Experimental mass |
|---|---|---|---|
| Da | Da | ||
| WT | Acetyl-1–47a | 4,844.5 | 4,844.1 |
| 48–375 | 36,831.2 | 36,830.2 | |
| Y/E | Glycyl-1–47b | 4,859.5 | 4,859.2 |
| 48–375 | 36,797.1 | 36,796.7 | |
| 68–375 | 34,683.8 | 34,682.8 |
a Mass includes an N-terminal acetyl group.
b Mass includes an N-terminal glycyl group.
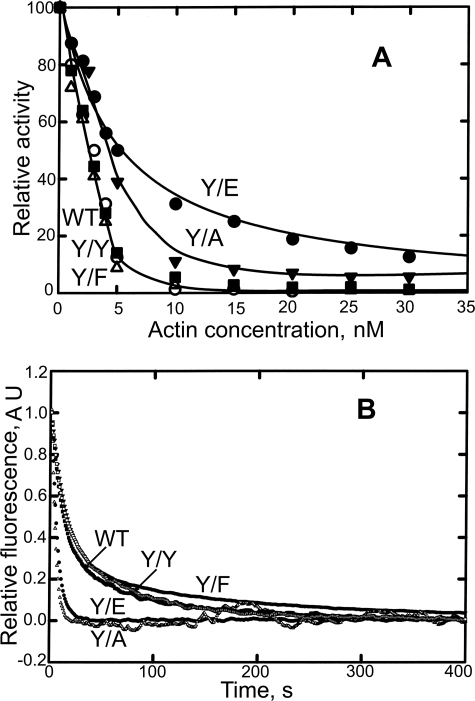
Although the rates and products of subtilisin cleavage provided little evidence for a significant conformational change in the D-loop as a result of the Tyr-53 mutations, there was a substantial effect on the ability of Y/A and Y/E to inhibit DNase I activity. The concentration of actin required for 50% inhibition of 0.7 nm DNase I was the same for WT, Y/Y, and Y/F (2.5 nm), but significantly higher concentrations of Y/A (4.2 nm) and Y/E (5.8 nm) were required for 50% inhibition of DNase I activity (Fig. 3A). Thus, the data for DNase I inhibition demonstrate that the conformation of the D-loops of Y/A and Y/E, but not the D-loop of Y/F, were affected by the mutations and that the N-terminal glycyl group had no effect (Y/Y).
FIGURE 3.
Properties of monomeric actins. A, inhibition of DNase I activity as a function of actin concentration (see “Experimental Procedures”). B, time course of nucleotide exchange. Monomeric actin (3 μm) with bound etheno-ATP was incubated with 0.1 m ATP, and the decrease in fluorescence was monitored.
The rates of nucleotide exchange of monomeric WT, Y/Y, and Y/F were essentially the same, with t½ of 15, 16, and 15 s, respectively, but nucleotide exchange of Y/A and Y/E was greatly accelerated, with t½ of 4.5 and 5.5 s, respectively (Fig. 3B). These data suggest that conformational changes in the D-loops of Y/A and Y/E allosterically affect the conformation of the nucleotide-binding cleft (see “Discussion”).
Polymerization of Y/F, Y/A, and Y/E Actins
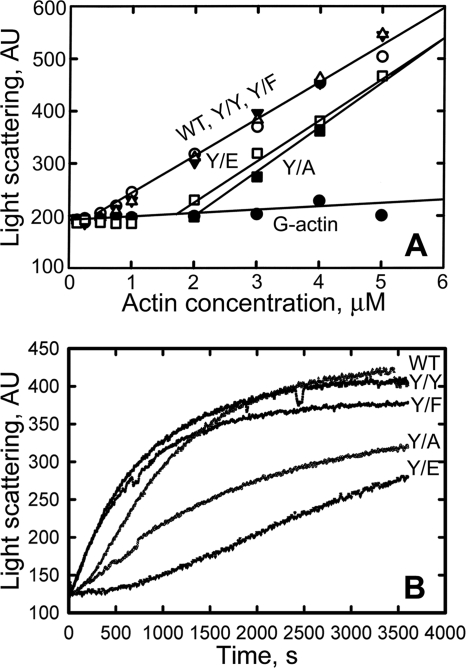
The critical concentrations of WT, Y/Y, and Y/F actins were indistinguishable (0.3 μm), but Y/A and Y/E had significantly higher critical concentrations of 2 and 1.7 μm, respectively (Fig. 4A). The time courses of polymerization of WT, Y/Y, and Y/F were also similar (Fig. 4B); however, Y/A and Y/E polymerized significantly more slowly than WT, Y/Y, and Y/F (Fig. 4B).
FIGURE 4.
Polymerization of actins. A, critical concentration; actin was polymerized overnight. B, time course of polymerization of 6 μm actin. All polymerizations were at room temperature in G-buffer plus 100 mm KCl and 2 mm MgCl2. AU, arbitrary units.
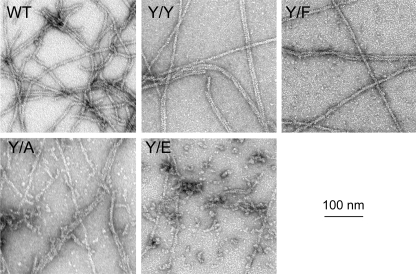
The filaments formed by Y/Y and Y/F were indistinguishable from WT filaments by negative staining electron microscopy; all three had clear helical patterns (Fig. 5). Y/A filaments were less clearly defined, with multiple imperfections, and were mixed with small oligomers. Y/E formed a few, imperfect filaments but mostly polymerized into small aggregates.
FIGURE 5.
Electron microscopy of polymerized actins. Negatively stained images of polymerized actins are shown.
ATP Hydrolysis Accompanying Polymerization of Y/F, Y/A, and Y/E Actins
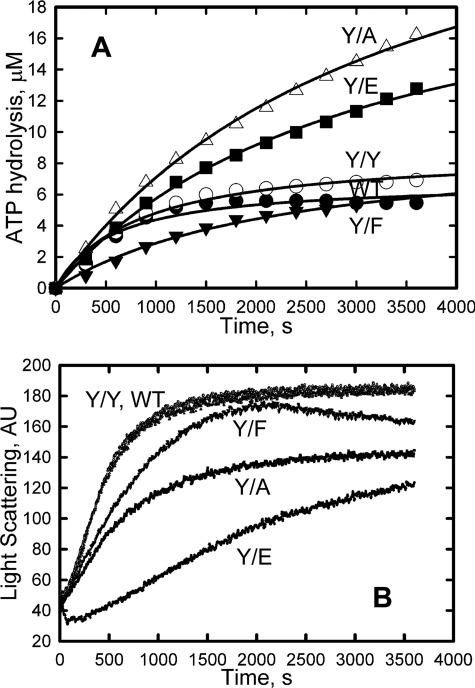
Normally, under the conditions of polymerization used in these experiments, 1 mol of ATP is hydrolyzed per mol of actin polymerized. This was the case for polymerization of WT, Y/Y, and Y/F actins (Fig. 6); 5–6 μm ATP was hydrolyzed (Fig. 6A) during the polymerization of ∼5.7 μm actin (6 μm total actin minus the critical concentrations of 0.3 μm) (Figs. 4A and 6B), and the rate of ATP hydrolysis was very slow after polymerization was complete. In contrast, during the polymerization of ∼6 μm Y/A and Y/E actins (8 μm total actin minus ∼2 μm critical concentration) (Figs. 4A and 6B), 11–13 μm ATP was hydrolyzed, and ATP hydrolysis continued after polymerization was essentially complete (Fig. 6A). These data suggest that the Y53A and Y53E mutations increase the rate of ATP exchange in filamentous actin, as they do for monomeric actin, or, alternatively, the data might indicate a more rapid turnover of actin subunits in Y/A and Y/E. The apparently greater rates of polymerization of actin in the experiment described in Fig. 6B compared with that shown in Fig. 4B were due to the higher Mg2+ concentration (3 mm in Fig. 6B versus 2 mm in Fig. 4B). In a separate experiment, t½ for polymerization of WT actin was 500 s in 2 mm Mg2+ versus 340 s in 3 mm Mg2+.
FIGURE 6.
ATP hydrolysis accompanying polymerization. A, ATP hydrolysis. B, polymerization. The time course of polymerization was followed by the increase in light scattering, and the time course of ATP hydrolysis was followed by an assay of Pi release (see “Experimental Procedures”). Actin concentrations were as follows: WT, Y/Y, and Y/F, 6 μm; Y/A and Y/E, 8 μm. AU, arbitrary units.
Activation of Myosin ATPase and in Vitro Motility Activity of Y/F, Y/A, and Y/E Actins
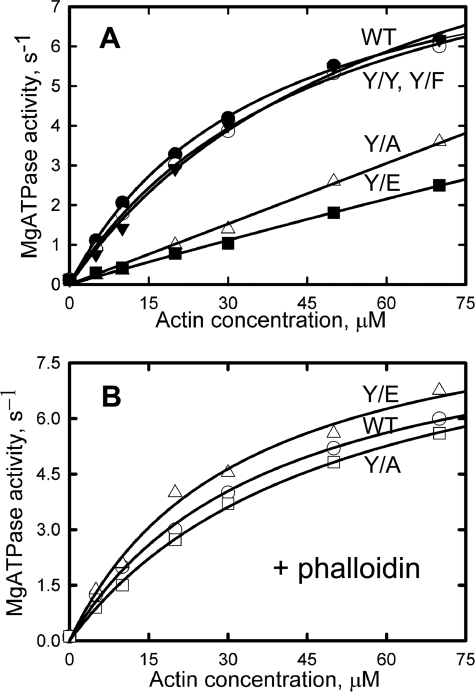
Y/Y and Y/F were equally effective as WT in activating the MgATPase activity of Dictyostelium myosin S1 (Fig. 7A and Table 3), but Y/A and Y/E appeared to activate myosin MgATPase activity less well (Fig. 7A). However, the in vitro motility activities of Y/A and Y/E were indistinguishable from the activities of WT, Y/Y, and Y/F (Table 3). On the assumption that the relatively low activation of myosin MgATPase activity by Y/A and Y/E might have been due to the impaired ability of Y/A and Y/E to form filaments, which would have been stabilized by the phalloidin present in the motility assay, we repeated the actomyosin ATPase experiment in the presence of phalloidin. The results in Fig. 7B and Table 3 indicate this to be the case, and thus, none of the Tyr-53 mutations has a substantial effect on either the in vitro motility of actin or its ability to activate myosin MgATPase.
FIGURE 7.
Actin activation of myosin S1 MgATPase activity. A, assays conducted in the absence of phalloidin. B, assays done in the presence of phalloidin (1:1 molar ratio to actin) to stabilize the actin filaments. The kinetic values from these assays are in Table 3.
TABLE 3.
Actin-activated myosin MgATPase and in vitro motility assays with endogenous wild-type and expressed actins
Dictyostelium myosin S1 was used in the ATPase assays, and full-length Dictyostelium myosin II was used in the in vitro motility assays (see “Experimental Procedures”). ATPase assays were performed with and without added phalloidin, as indicated. The data were calculated from the experiments shown in Fig. 7. n, number of filaments quantified.
| Actin | Actin-activated ATPase |
Motility |
||
|---|---|---|---|---|
| Vmax | Km | n | V | |
| s−1 | μm | μm/s | ||
| WT with/without phalloidina | 9.4 ± 0.1 | 42 ± 0.5 | 62 | 3.66 ± 0.62 |
| Y/Y without phalloidin | 10 | 48 | 99 | 3.53 ± 0.58 |
| Y/F without phalloidin | 12 | 62 | 93 | 3.77 ± 0.76 |
| Y/A with phalloidin | 9.6 | 50 | 85 | 3.86 ± 0.66 |
| Y/E with phalloidin | 9.6 | 32 | 88 | 3.66 ± 0.78 |
a Applies only to ATPase assay; all in vitro motility assays have phalloidin-stabilized actin filaments.
Properties of Y/L and Y/W Actins
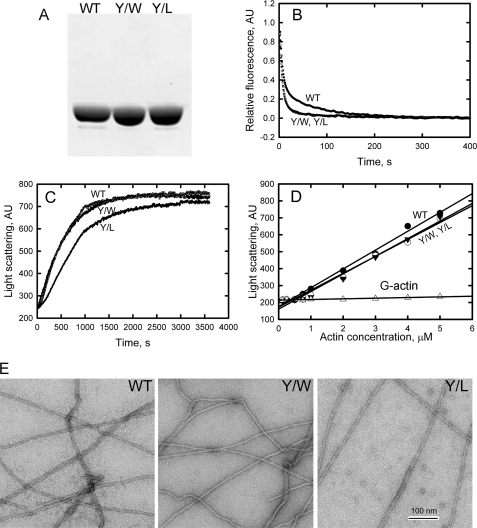
To determine if the ability of Phe to replace Tyr-53 was specific for that amino acid or could be mimicked by any bulky hydrophobic or aromatic amino acid, we expressed and purified Y/L and Y/W actins (Fig. 8A) and confirmed their sequences by mass spectroscopy (Table 1). The rates of nucleotide exchange (Fig. 8B) by monomeric Y/W and Y/L, t½ = 5 s, were significantly faster than WT, t½ = 10 s, and similar to Y/A and Y/E, t½ = 4.5 and 5.5 s, respectively (Fig. 3B). Y/W polymerized at the same rate as WT (Fig. 8C), whereas Y/L polymerized slightly more slowly, requiring 750 s versus 500 s to reach 50% of maximum polymerization (Fig. 8C), but Y/L polymerized substantially faster than Y/A and Y/E (Fig. 4B). The critical concentrations of both Y/W and Y/L did not differ significantly from the critical concentration of WT (Fig. 8D), and, in contrast to the short filaments formed by Y/A and Y/E, the filaments formed by polymerized Y/W and Y/L, like Y/F-filaments, were indistinguishable from WT filaments (Fig. 8E). Thus, neither Trp nor Leu replaced Tyr-53 as well as Phe, but both were much better substitutes for Tyr than Ala or Glu.
FIGURE 8.
Properties of purified Y/W and Y/L actins compared with WT actin. A, SDS-PAGE of purified actins. B, nucleotide exchange of Y/W and Y/L actins is faster than for WT. C, Y/W polymerized at the same rate as WT, but Y/L polymerized more slowly. D, the critical concentrations of Y/W, Y/L, and WT are similar. E, Y/W and Y/L form filaments indistinguishable from filaments of WT. AU, arbitrary units.
Effects of Expression of Mutant Actins on Growth and Development of Dictyostelium
When grown on liquid medium in suspension culture, Dictyostelium amoebae have a generation time of about 12 h and grow to a maximum density of about 2 × 10⁷ cells/ml. Starvation initiates a developmental process, stimulated by waves of cAMP secretion, in which, on a substrate, streams of cells aggregate into mounds of 100,000–200,000 cells. Mounds differentiate into prestalk and prespore cells and then transform into multicellular, motile slugs, and development culminates with the formation of mature fruiting bodies with a spore-containing head supported by a stalk anchored on a basal plate.
Before assaying the effects of the mutant actins on cell growth and development, it was necessary to determine the percentage of cells expressing each of the mutant actins and the level of their expression. Cells expressing constructs with the N-terminal FLAG-TEVCS tag were studied because, with the exception of Y/F, mutant actins without the N-terminal tags were expressed at levels no higher than 1% of the total actin.
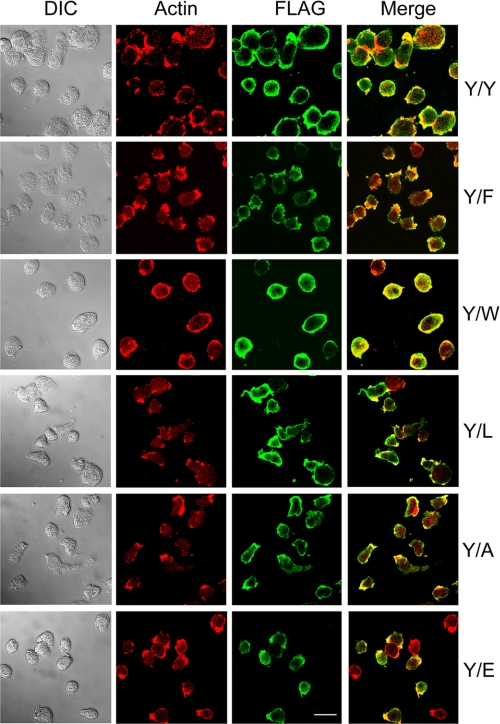
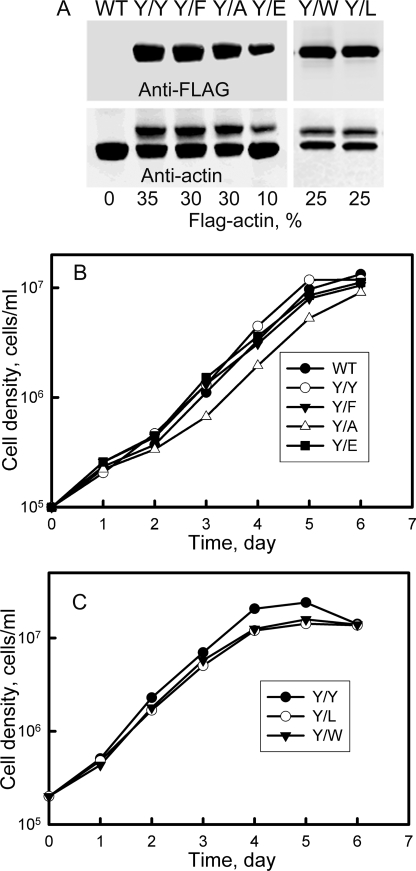
As illustrated in Fig. 9 and quantified in the figure legend, Y/Y, Y/F, Y/W, and Y/A were expressed in 91–94% of cells grown in suspension culture; Y/L was expressed in 83% and Y/E was expressed in only 64% of the cells. In all cases, the mutant actins co-localized with endogenous actin (Fig. 9). The average level of expression of the mutant actins in the total population of cells varied from 10% (Y/E) to 35% (Y/Y) of the total actin (Fig. 10A).
FIGURE 9.
Expression of FLAG-TEVCS-tagged mutant actins and their co-localization with endogenous actin. Cells expressing the mutant actins were grown in suspension culture and then fixed and double-stained with anti-actin antibody (red) to visualize both endogenous and mutant actin and with anti-FLAG antibody (green) to visualize only the mutant actin. DIC, differential interference contrast microscopy. Bar, 10 μm. The percentages of cells that reacted with anti-FLAG antibody, with the number of cells counted in parentheses, were as follows: Y/Y, 95% (143); Y/F, 94% (178); Y/W, 92% (104); Y/L, 83% (198); Y/A, 91% (143); Y/E, 64% (425).
FIGURE 10.
Growth of cells expressing mutant actins. A, immunoblots of SDS-PAGE of total cell proteins of cells expressing FLAG-TEVCS-mutant actins. Upper gel, anti-FLAG antibody; lower gel, anti-actin antibody. B, growth curves of WT cells and cells expressing Y/Y, Y/F, Y/A, and Y/E actin. Cells expressing Y/A grew more slowly than Y/Y cells and to a lower maximum cell density. C, growth curves of cells expressing Y/Y, Y/L, and Y/W actin. Y/L and Y/W cells grew more slowly than Y/Y cells and to a lower maximum density. Because the plots are exponential, differences in growth rates and final cell densities appear to be less than they are (see “Results”).
Expression of Y/Y and Y/F did not significantly affect the rate of growth of the amoebae compared with WT cells (Fig. 10B). Thus, neither the FLAG-TEVCS tag nor the Tyr/Phe mutation affected growth. On the other hand, the doubling times of cells expressing Y/W, Y/L, and Y/A, but not Y/E (most likely because it was expressed in only 64% of the cells and at a relatively low level) were about 20% longer than the doubling time of Y/Y cells (Fig. 10, B and C). Y/W and Y/L cells grew to ∼60% and Y/A cells grew to ∼80% of the maximum density of Y/Y cells (Fig. 10, B and C).
Both Y/Y and Y/F cells formed fruiting bodies with 25% smaller heads than fruiting bodies of WT cells (Fig. 11), average diameters of 98 μm versus 135 μm, respectively. Because the phenotypes of the cells expressing Y/Y and Y/F were indistinguishable, this developmental defect can be attributed to the FLAG-TEVCS peptide fused to the N terminus of the expressed actins, with no additional effect of the replacement of Tyr-53 with Phe.
FIGURE 11.
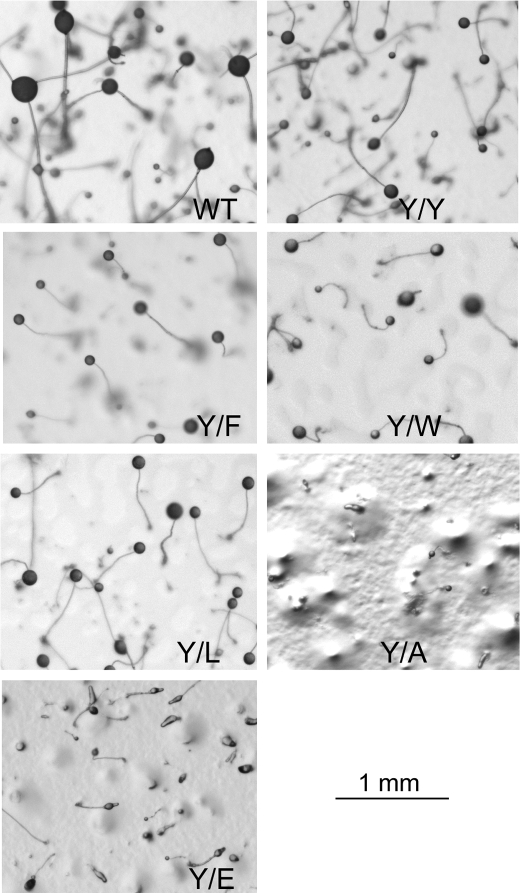
Development of cells expressing mutant actins. Images of the cell lines analyzed in Fig. 9 were taken after development for 48 h. As discussed under “Results,” Y/Y, Y/F, Y/W, and Y/L cells formed mature fruiting bodies similar to those formed by WT cells except that their heads were 25% smaller. Y/A cells never developed beyond the mound stage, and only about half of the mounds of Y/E cells developed into fruiting bodies by 48 h, with heads 25% smaller than those of Y/Y cells.
Development of cells expressing Y/W and Y/L was no different than development of cells expressing Y/Y and Y/F (Fig. 11), with mature fruiting bodies of the same size formed in 48 h. However, development of cells expressing Y/A was dramatically different, never progressing beyond the mound stage (Fig. 11). Cells expressing Y/E were not as severely affected as cells expressing Y/A, most probably because Y/E was expressed in only 64% of the cells and at a relatively low level, but only some of the Y/E mounds matured to fruiting bodies in 48 h, and their heads were 30% smaller than heads of Y/Y cells (Fig. 11), average diameter of 68 μm versus 135 μm. Undeveloped mounds and slugs can be seen in the Y/E panel in Fig. 11.
DISCUSSION
Properties of Purified Mutant Actins
The experimental results are summarized in Table 4. Substitution of Phe for Tyr-53 had no effect on the properties of the purified actin. The Trp and Leu mutations had no significant effect on the critical concentration, but Leu slightly decreased the rate of actin polymerization, and both mutations increased the rate of nucleotide exchange. Substituting either Ala or Glu for Tyr-53 substantially reduced actin inhibition of DNase I, inhibited the rate of actin polymerization, increased the critical concentration and the rate of nucleotide exchange of actin, and dramatically inhibited filament elongation. The properties of Y/A and Y/E actins and, to a much lesser extent, Y/W and Y/L actins are similar but not identical to the properties of pY53-actin (the rate of nucleotide exchange is inhibited by phosphorylation of Tyr-53 but increased by the mutations).
TABLE 4.
Comparison of mutant actins and pY53-actins with Y/Y-actin
Symbols are as follows. ↔, similar to WT; ↓, slightly less than WT; ↓↓, much less than WT; ↑, slightly more than WT; ↑↑, much more than WT; ND, not determined; NA, not applicable because pY53-actin is not present during growth and appears only after 12 h into development.
| Property | Y/F | Y/W | Y/L | Y/A | Y/E | pY53a |
|---|---|---|---|---|---|---|
| DNase I inhibition | ↔ | ND | ND | ↓↓ | ↓↓ | ↓↓ |
| Polymerization rate | ↔ | ↔ | ↓ | ↓↓ | ↓↓ | ↓↓ |
| Critical concentration | ↔ | ↔ | ↔ | ↑↑ | ↑↑ | ↑↑ |
| Filament length | ↔ | ↔ | ↔ | ↓↓ | ↓↓ | ↓↓ |
| ATP exchange rate | ↔ | ↑↑ | ↑↑ | ↑↑ | ↑↑ | ↓↓ |
| Actomyosin ATPase | ↔ | ND | ND | ↔b | ↔b | ↔ |
| In vitro motility | ↔ | ND | ND | ↔ | ↔ | ND |
| Cell growth | ↔ | ↓ | ↓ | ↓ | ↔c | NA |
| Development | ↔ | ↔ | ↔ | ↓↓ | ↓c | NA |
The simplest interpretations of these data for the purified actins are as follows: 1) Tyr and Phe at position 53 and Trp and Leu partially, but not Ala, Glu, or Tyr(P), maintain the functional conformations of the D-loop in both G- and F-actin, and 2) the conformation of the D-loop affects not only the properties directly involving the D-loop, including actin-actin interactions, but also events at the nucleotide-binding cleft.
In the seminal work from the Holmes laboratory on the structure of the G-actin-DNase I complex (2), the DNase I-binding sites were identified as actin residues Gly-42, Val-43, and Met-44, which occur in an unstructured loop, the D-loop. In their accompanying paper (23), in which the structure of G-actin was fit into a model of F-actin based on x-ray diffraction data, the D-loop was also identified as one of the actin-actin interaction sites (i.e. the actin-binding region at the pointed end of the actin monomer overlaps the DNase I-binding region). Recently, analysis of the highest resolution x-ray diffraction pattern of F-actin yet obtained (24) identified an extended (relative to G-actin) D-loop with Val-43 and Met-44 in contact with Leu-346 and Phe-375 of the next actin monomer, consistent with the earlier conclusions.
Furthermore, extensive biochemical evidence supports the conclusion that the interactions between subunits in F-actin involve D-loop residues at the pointed end of the actin subunit. For example, actin cleaved by subtilisin between D-loop residues Met-47 and Gly-48 (22) or by an Escherichia coli protease between D-loop residues Gly-42 and Val-43 (25) polymerizes much more slowly and has a much higher critical concentration than native actin. Filaments of subtilisin- and E. coli protease-cleaved actin appear to be normal by electron microscopy, but at least the latter (26) are less stable than WT filaments. Subtilisin cleavage of the D-loop also reduces the affinity of actin for DNase I (22). Therefore, the simplest explanation for the slower polymerization rates and higher critical concentrations of the Y53A and Y53E mutants (and, to a lesser extent, the Y53W and Y53L mutants) and their reduced affinities for DNase I reported in this paper is that these mutations alter the conformation of the D-loop, inhibiting its interactions with both DNase I and the barbed end of the next actin subunit in F-actin.
The conformation of the D-loop in both G- and F-actin has long been the subject of discussion. The crystal structure of both G-ADP and G-ATP-actin, always as a complex with another protein or with a covalent modification to prevent polymerization, has been determined more than 30 times (27), and the D-loop has usually been found to be disordered in both G-ATP- and G-ADP-actin. Recently, in crystals of G-actin rendered non-polymerizable by reaction of tetramethylrhodamine 5-maleimide with Cys-374, the D-loop was found to be folded into an α-helix in the ADP state (28), although this has been questioned (29), but to be disordered in the ATP state (30). There are five other reports of crystal structures of actin complexes with the D-loop in an ordered conformation, not necessarily α-helical (see references within Ref. 31), at least one of which (31) resembles the extended D-loop recently observed in F-actin (24). Independent molecular dynamic modeling studies of monomeric actin and trimeric actin (as a model of F-actin) (32–34) suggest that folded (helical) and unfolded D-loop conformations co-exist in equilibrium in ADP-G-actin, with equivalent free energy, but in the ADP-trimer the folded D-loop is stable at a free energy minimum (34). In addition to and independent of the structural and modeling data, there is considerable biochemical evidence that the nature of the bound nucleotide affects the conformation of the D-loop. For example, the intensity of fluorescence of a fluorescence-labeled Gln-41 is greater for G-ATP-actin than for G-ADP-actin (35, 36), and the D-loop of G-ADP-actin is less susceptible to proteolytic cleavage than the D-loop of G-ATP-actin (29, 37).
Because the changes in the conformation of the nucleotide-binding cleft with bound ATP or ADP allosterically affect the conformation of the D-loop, it is reasonable to conclude that the increased rate of nucleotide exchange in the four Tyr-53 mutants reported in this paper is an allosteric consequence of conformational changes in the D-loops of the mutant actins (i.e. conformational changes in the D-loop affect the conformation of the nucleotide-binding cleft). Similarly, the continued hydrolysis of ATP after completion of polymerization of Y/A and Y/E may result from a change in the conformation of the nucleotide-binding cleft secondary to a conformational change in the D-loop. Alternatively, the enhanced ATP hydrolysis by F-actin might result from an increased turnover rate of actin subunits in polymerized Y/A and Y/E, as has been reported for filaments of actin with a proteolytically cleaved D-loop (38).
Although the Y/A and Y/E mutant actins and subtilisin-cleaved actins have similar polymerization and DNase I inhibition properties, they differ somewhat in their interactions with myosin. In the actin-activated ATPase assay, Y/A, Y/E (this paper), and subtilisin-cleaved actin (22) have the same Vmax but a much lower affinity for S1 than WT actin and, for subtilisin-cleaved actin, also a reduced affinity for HMM (39). The reduced affinities for S1 of Y/A and Y/E are reversed when phalloidin-stabilized actin is used (this paper), but this was not investigated with subtilisin-cleaved actin. However, whereas Y/A and Y/E have the same in vitro motility activity as WT (this paper), only 30% of subtilisin-cleaved filaments are motile, and their motility rate is only 30% that of intact filaments (39).
It is of some interest that, to the extent they have been studied (40), the properties of Plasmodium falciparum actin, which has Phe, and not Tyr, at position 53, resemble those of the Y53A and Y53E actins. Plasmodium actin binds DNase I much more weakly than yeast actin (KD of 104 nm versus 52 nm) and polymerizes only upon the addition of gelsolin and phalloidin, forming fragmented filaments. These unusual properties for a native actin were attributed to the extensive substitutions in the D-loop of Plasmodium actin compared with most actins (H40N, Q41P, G48E, and Q49E) and not to the presence of Phe at position 53. This interpretation is consistent with our data indicating that the Y53F mutation has no significant effect on the properties of Dictyostelium actin and with the importance of the D-loop conformation (10, 14) (this paper) for polymerization as well as for interaction with DNase I.
Properties of Amoebae Expressing Mutant Actins
Dictyostelium has 32 actin genes, 17 coding for the same protein (41). At least 13 actin genes are expressed, of which 11 are in the group of 17 that code for the same protein (42), which accounts for at least 95% of the total actin (43). Therefore, it is impractical to evaluate the phenotype of cells in which the endogenous actin is replaced by a single actin mutant; the best that can be done is to look for dominant negative phenotypes.
The data summarized in Table 4 show that Y/A was weakly dominant negative for cell growth and strongly dominant negative for development, which did not progress beyond the mound stage. Y/E, whose biochemical properties were similar to those of Y/A, was less dominant negative with no effect on cell growth and milder inhibition of development, most likely because of the lower level of expression of Y/E (64% of cells and 10% of total actin for Y/E versus 91% of cells and 30% of total actin for Y/A).
Y/W and Y/L, although expressed at relatively high levels, were only weakly dominant negative, consistent with the lesser effects of these mutations on the properties of the purified proteins, inhibiting cell growth but with no effect on development. However, it seems likely that all of the Tyr-53 mutant actins would have stronger negative phenotypes in cells growing under unfavorable conditions in the wild or if they were the only actins expressed.
Conclusions
Finally, we address the question of why Phe, which had no negative effects on either the biochemistry of purified actin or cell phenotype, replaces Tyr-53 in so few species. Speculatively, although Phe and Tyr at position 53 seem to be equally able to allow the D-loop and nucleotide-binding cleft to undergo the conformational changes and interactions required for normal actin function, tyrosine has the advantage of providing a mechanism (phosphorylation) for dynamic, reversible changes in the properties of actin resulting from conformational changes in the D-loop and nucleotide-binding cleft.
Acknowledgments
We thank Dr. Rodney L. Levine for performing the mass spectrometry analyses and Dr. James Sellers for assistance in the in vitro motility assays. The experiments with the Y53W and Y53L mutants and on the effects of the mutant actins on growth and development were suggested by an anonymous reviewer.
This work was authored, in whole or in part, by National Institutes of Health staff.
- D-loop
- DNase I-binding loop
- pY53-actin
- Tyr-53-phosphorylated actin
- S1
- myosin subfragment 1
- TEV
- tobacco etch virus
- TEVCS
- TEV cleavage site
- WT
- wild type
- Y/A
- expressed actin with Y53A mutation
- Y/E
- expressed actin with Y53E mutation
- Y/F
- expressed actin with Y53F mutation
- Y/Y
- expressed WT actin
- Y/L
- expressed actin with Y53L mutation
- Y/W
- expressed actin with Y53W mutation
- Mes
- 4-morpholineethanesulfonic acid.
REFERENCES
- 1.Sheterline P., Clayton J., Sparrow J. C. (1998) Protein Profile Actin, 4th Ed., p. 44, Oxford University Press, Oxford [Google Scholar]
- 2.Kabsch W., Mannherz H. G., Suck D., Pai E. F., Holmes K. C. (1990) Nature 347, 37–44 [DOI] [PubMed] [Google Scholar]
- 3.Schweiger A., Mihalache O., Ecke M., Gerisch G. (1992) J. Cell Sci. 102, 601–609 [DOI] [PubMed] [Google Scholar]
- 4.Jungbluth A., von Arnim V., Biegelmann E., Humbel B., Schweiger A., Gerisch G. (1994) J. Cell Sci. 107, 117–125 [DOI] [PubMed] [Google Scholar]
- 5.Jungbluth A., Eckerskorn C., Gerisch G., Lottspeich F., Stocker S., Schweiger A. (1995) FEBS Lett. 375, 87–90 [DOI] [PubMed] [Google Scholar]
- 6.Howard P. K., Sefton B. M., Firtel R. A. (1993) Science 259, 241–244 [DOI] [PubMed] [Google Scholar]
- 7.Gauthier M. L., Lydan M. A., O'Day D., Cotter A. D. (1997) Cell. Signal. 9, 79–83 [DOI] [PubMed] [Google Scholar]
- 8.Kishi Y., Clements C., Mahadeo D. C., Cotter D. A., Sameshima M. (1998) J. Cell Sci. 111, 2923–2932 [DOI] [PubMed] [Google Scholar]
- 9.Sameshima M., Kishi Y., Osumi M., Minamikawa-Tachino R., Mahadeo D., Cotter D. A. (2001) J. Struct. Biol. 136, 7–19 [DOI] [PubMed] [Google Scholar]
- 10.Liu X., Shu S., Hong M. S., Levine R. L., Korn E. D. (2006) Proc. Natl. Acad. Sci. U.S.A. 103, 13694–13699 [DOI] [PMC free article] [PubMed] [Google Scholar]
- 11.Kameyama K., Kishi Y., Yoshimura M., Kanzawa N., Sameshima M., Tsuchiya T. (2000) Nature 407, 37. [DOI] [PubMed] [Google Scholar]
- 12.Kanzawa N., Hoshino Y., Chiba M., Hoshino D., Kobayashi H., Kamasawa N., Kishi Y., Osumi M., Sameshima M., Tsuchiya T. (2006) Plant Cell Physiol. 47, 531–539 [DOI] [PubMed] [Google Scholar]
- 13.Rush J., Moritz A., Lee K. A., Guo A., Goss V. L., Spek E. J., Zhang H., Zha X. M., Polakiewicz R. D., Comb M. J. (2005) Nat. Biotechnol. 23, 94–101 [DOI] [PubMed] [Google Scholar]
- 14.Baek K., Liu X., Ferron F., Shu S., Korn E. D., Dominguez R. (2008) Proc. Natl. Acad. Sci. U.S.A. 105, 11748–11753 [DOI] [PMC free article] [PubMed] [Google Scholar]
- 15.Liu X., Ito K., Lee R. J., Uyeda T. Q. (2000) Biochem. Biophys. Res. Commun. 271, 75–81 [DOI] [PubMed] [Google Scholar]
- 16.Tropea J. E., Cherry S., Waugh D. S. (2009) Methods Mol. Biol. 498, 297–307 [DOI] [PubMed] [Google Scholar]
- 17.Liu X., Shu S., Kovács M., Korn E. D. (2005) J. Biol. Chem. 280, 26974–26983 [DOI] [PMC free article] [PubMed] [Google Scholar]
- 18.Yao X., Grade S., Wriggers W., Rubenstein P. A. (1999) J. Biol. Chem. 274, 37443–37449 [DOI] [PubMed] [Google Scholar]
- 19.Ito K., Liu X., Katayama E., Uyeda T. Q. (1999) Biophys. J. 76, 985–992 [DOI] [PMC free article] [PubMed] [Google Scholar]
- 20.Pollard T. D., Korn E. D. (1973) J. Biol. Chem. 248, 4682–4690 [PubMed] [Google Scholar]
- 21.Laemmli U. K. (1970) Nature 227, 680–685 [DOI] [PubMed] [Google Scholar]
- 22.Schwyter D., Phillips M., Reisler E. (1989) Biochemistry 28, 5889–5895 [DOI] [PubMed] [Google Scholar]
- 23.Holmes K. C., Popp D., Gebhard W., Kabsch W. (1990) Nature 347, 44–49 [DOI] [PubMed] [Google Scholar]
- 24.Oda T., Iwasa M., Aihara T., Maéda Y., Narita A. (2009) Nature 457, 441–445 [DOI] [PubMed] [Google Scholar]
- 25.Khaitlina S. Yu, Collins J. H., Kuznetsova I. M., Pershina V. P., Synakevich I. G., Turoverov K. K., Usmanova A. M. (1991) FEBS Lett. 279, 49–51 [DOI] [PubMed] [Google Scholar]
- 26.Khaitlina S. Y., Moraczewska J., Strzelecka-Gołaszewska H. (1993) Eur. J. Biochem. 218, 911–920 [DOI] [PubMed] [Google Scholar]
- 27.Holmes K. C. (2009) Nature 457, 389–390 [DOI] [PubMed] [Google Scholar]
- 28.Otterbein L. R., Graceffa P., Dominguez R. (2001) Science 293, 708–711 [DOI] [PubMed] [Google Scholar]
- 29.Rould M. A., Wan Q., Joel P. B., Lowey S., Trybus K. M. (2006) J. Biol. Chem. 281, 31909–31919 [DOI] [PubMed] [Google Scholar]
- 30.Graceffa P., Dominguez R. (2003) J. Biol. Chem. 278, 34172–34180 [DOI] [PubMed] [Google Scholar]
- 31.Nair U. B., Joel P. B., Wan Q., Lowey S., Rould M. A., Trybus K. M. (2008) J. Mol. Biol. 384, 848–864 [DOI] [PMC free article] [PubMed] [Google Scholar]
- 32.Chu J. W., Voth G. A. (2005) Proc. Natl. Acad. Sci. U.S.A. 102, 13111–13116 [DOI] [PMC free article] [PubMed] [Google Scholar]
- 33.Zheng X., Diraviyam K., Sept D. (2007) Biophys. J. 93, 1277–1283 [DOI] [PMC free article] [PubMed] [Google Scholar]
- 34.Pfaendtner J., Branduardi D., Parrinello M., Pollard T. D., Voth G. A. (2009) Proc. Natl. Acad. Sci. U.S.A. 106, 12723–12728 [DOI] [PMC free article] [PubMed] [Google Scholar]
- 35.Kim E., Motoki M., Seguro K., Muhlrad A., Reisler E. (1995) Biophys. J. 69, 2024–2032 [DOI] [PMC free article] [PubMed] [Google Scholar]
- 36.Moraczewska J., Strzelecka-Gołaszewska H., Moens P. D., dos Remedios C. G. (1996) Biochem. J. 317, 605–611 [DOI] [PMC free article] [PubMed] [Google Scholar]
- 37.Strzelecka-Gołaszewska H., Moraczewska J., Khaitlina S. Y., Mossakowska M. (1993) Eur. J. Biochem. 211, 731–742 [DOI] [PubMed] [Google Scholar]
- 38.Khaitlina S. Y., Strzelecka-Gołaszewska H. (2002) Biophys. J. 82, 321–334 [DOI] [PMC free article] [PubMed] [Google Scholar]
- 39.Schwyter D. H., Kron S. J., Toyoshima Y. Y., Spudich J. A., Reisler E. (1990) J. Cell Biol. 111, 465–470 [DOI] [PMC free article] [PubMed] [Google Scholar]
- 40.Schüler H., Mueller A. K., Matuschewski K. (2005) FEBS Lett. 579, 655–660 [DOI] [PubMed] [Google Scholar]
- 41.Joseph J. M., Fey P., Ramalingam N., Liu X. I., Rohlfs M., Noegel A. A., Müller-Taubenberger A., Glöckner G., Schleicher M. (2008) PloS ONE 3, e2654. [DOI] [PMC free article] [PubMed] [Google Scholar]
- 42.Romans P., Firtel R. A., Saxe C. L., 3rd (1985) J. Mol. Biol. 186, 337–355 [DOI] [PubMed] [Google Scholar]
- 43.Vandekerckhove J., Weber K. (1980) Nature 284, 475–477 [DOI] [PubMed] [Google Scholar]


