

Abstract
Tumor suppressor p53 is known to activate certain sets of genes while suppressing others. However, whether p53 can both activate and suppress the same gene is unclear. To address this question, concentration-dependent p53 effect on the manganese superoxide dismutase (MnSOD) gene was investigated. By transfecting p53 in PC-3 cells, we demonstrate that low concentrations of p53 increase while high concentrations suppress MnSOD expression. The physiological relevance of this effect was determined in vitro and in vivo using combined UVB-mediated activation and small interference RNA-mediated suppression of p53. Results were consistent with the bi-directional effect of p53 on MnSOD expression. MnSOD-promoter/enhancer analysis demonstrates that p53 is suppressive to the promoter activity regardless of the presence or absence of putative p53 binding sites. However, a low level of p53 increases MnSOD gene transcription in the presence of the intronic-enhancer element, and this effect is dependent on nuclear-factor κB (NF-κB) binding sites. Expression of p53 enhances nuclear levels of p65 with corresponding increase in the DNA-binding activity of NF-κB as detected by electrophoretic mobility shift and chromatin immunoprecipitation assays. Transfection of p65 small interference RNA reduces the positive effect of p53 on MnSOD gene transcription. These data suggest that p65 can overcome the negative effect of p53 on MnSOD expression. However, when the level of p53 was further increased, the suppressive effect of p53 outweighed the positive effect of p65 and led to the suppression of MnSOD gene transcription. These results demonstrated that p53 can both suppress and induce MnSOD expression depending on the balance of promoter and enhancer binding transcription factors.
Keywords: Gene/Regulation, Gene/Transcription, Transcription, Transcription/NF-κB, Transcription/p53, Transcription/Sp1, Apoptosis, p53, MnSOD, p65, Sp1, Gene Expression, Chip Assay, Reporter Gene Activity
Introduction
The tumor suppressor protein p53 can function as a transcription factor through sequence-specific DNA binding or a sequence nonspecific mechanism (1, 2). p53 recognizes a specific DNA consensus sequence consisting of two copies of a 10-bp p53-response motif that are separated by 0–13 bp. The two copies of this 10-bp motif are occupied by two p53 dimers of a tetrameric protein leading to transactivation of p53 target genes (3). In addition, p53 can also repress a wide variety of cellular and viral genes that lacks p53 consensus binding sites (4, 5). The molecular basis for such transcriptional regulation by p53 is poorly understood. p53 can repress its target genes by two mechanisms. First, p53 can block the access of other transcription factors to the transcription machinery through protein-protein interactions in the absence of direct DNA binding (6). Second, p53 represses transcription of target genes by binding to the DNA-binding site, which overlaps with the binding site of another transactivator protein (7). For instance, p53-mediated repression of the α-fetoprotein gene occurs by the displacement of an adjacent overlapping transcription factor, hepatocyte nuclear factor-3 (8). p53 suppresses the expression of the human manganese superoxide dismutase (MnSOD)2 gene by interfering with the binding of specificity protein 1 (Sp1) (9).
Typical p53 target genes are involved in the regulation of cell growth, DNA repair, and apoptosis (10). However, recent studies have also shown that p53 target genes are potentially involved in the control of other cell functions, including muscle differentiation by regulating phosphoglycerate mutase (11), extracellular matrix production by regulating plasminogen activator inhibitor-1 (12), membrane protein trafficking by regulating caveolin and oxidative stress response through glutathione peroxidase (13), cystathionine-β-synthase (14), and superoxide dismutase (15).
Studies have shown that p53 can exhibit both pro-oxidant and anti-oxidant properties mediated by modulating the expression of pro- and anti-apoptotic genes or directly by acting on the mitochondria and modulating mitochondrial integrity. As a transcription factor, p53 can participate in the modulation of reactive oxygen species (ROS) in a number of ways (16), including the following: 1) induction of ROS-generating enzymes, such as quinine oxidoreductases (NQO1) and proline oxidase; 2) induction of genes involved in mitochondrial injury, including Bax, PUMA, and p66SHC, that create oxidative stress; 3) induction of ferredoxin reductase, an enzyme that transfers electrons from NADPH to cytochrome P450 via ferredoxin in mitochondria; and 4) up-regulation of anti-oxidant enzymes such as the microsomal glutathione transferase homologue and aldehyde dehydrogenase 4, mammalian sestrin homologues, which encode anti-oxidant modulators of peroxiredoxins, and GPX1, a major peroxide removal enzyme. However, although the transcriptional modification of distinct pro- and anti-oxidant proteins by p53 may contribute to the pro-oxidant and anti-oxidant function of p53, none of these proteins are known to be able to mediate both the pro- and anti-oxidant functions of p53. Studies by us and others suggest a contradictory role of p53 in the transcription of MnSOD. In an early study, Drane et al. reported that overexpression of p53 suppresses MnSOD transcription and that the level of MnSOD increased in the absence of p53 (17). We have subsequently confirmed this finding and extended it to demonstrate the p53 suppresses the expression of MnSOD by complexing with Sp1 and decreasing its binding to the MnSOD promoter (9). However, Hussain et al. reported that increased expression of p53, using a tetracycline (tet)-regulated expression system, induces the transcription of MnSOD via a putative p53 binding site in a region far upstream from the transcriptional start site (18).
Thus, while the above reports demonstrate a seemingly contradictory role of p53 on MnSOD transcription, it is possible to envision that positive and negative regulation of MnSOD may represent a unique link between the observed pro- and anti-oxidant functions of p53. Therefore, it is possible that, depending on the stress levels, p53 may activate MnSOD as an adaptive response to mild stress condition. However, when the stress intensity or damage level is beyond repair, p53 executes a cell death program in part by suppressing MnSOD. In this study we assess the potential for the bi-directional effects of p53 on MnSOD expression under stress conditions and investigate the mechanisms mediating the observed effects of p53 on MnSOD expression. Our results demonstrate for the first time that p53 exerts a positive or negative effect on a single gene depending on the levels of Sp1 and NF-κB.
EXPERIMENTAL PROCEDURES
Cell Culture
PC-3 (p53−/−) cells were purchased from American Type Culture Collection (Manassas, VA) and grown in RPMI 1640 media supplemented with 10% fetal bovine serum (HyClone Inc., Logan, UT), 1% penicillin-streptomycin-neomycin, 1% sodium pyruvate, 1% non-essential amino acid mixture, and 1% vitamin mixture (Invitrogen). The mouse skin epithelial cell line was originally provided by Dr. Nancy H. Colburn at NCI, National Institutes of Health (Frederick, MD), and maintained and cultured in modified Eagle's medium supplemented with 10% fetal bovine serum, 200 μm l-glutamine, and 1% penicillin-streptomycin-neomycin (Invitrogen). Both cells were grown in 5% CO2 at 37 °C.
Reagents
Unless otherwise stated, all antibodies were purchased from Santa Cruz Biotechnology (Santa Cruz, CA). The anti-β-actin monoclonal antibody was purchased from Sigma. Rabbit polyclonal MnSOD antibody and GAPDH antibody were purchased from Upstate Biotechnologies (Lake Placid, NY). The p53 and p65 expression vectors were kindly provided by Dr. Yi Sun (University of Michigan) and Dr. Vivek Rangnekar (University of Kentucky), respectively. All siRNAs were purchased from Santa Cruz Biotechnology.
Transient Transfection
Cells were grown for 24 h with no antibiotics to obtain 70–80% confluency. The cells were then transfected with plasmids following a Lipofectamine® transfection protocol as directed by the manufacturer. Cells were transfected with various concentration of pcDNA3.1/p53 (equilibrated to the same amount of DNA by adding pcDNA3.1 vector) or pcDNA3.1 (−p53) vector alone as a control. Twenty-four hours after transfection, the cells were washed twice with phosphate-buffered saline (PBS) and incubated in fresh medium for another 24 h. Cells were then processed for nuclear extract or whole cell lysate preparation. Similarly, siRNAs were transfected using Transfectin® (Santa Cruz Biotechnology) according to the manufacturer's protocol. Cells were exposed to the siRNA for 72 h. The siRNA sequences targeting p53 gene silencing were as follows: strand 1, sense (5′-GAGUCACAGUCGGAUAUCAtt-3′) and antisense (5′-UGAUGGUAAGGAUAGGUCGTT-3′); strand 2, sense (5′-CGACCUAUCCUUACCAUCCAtt-3′) and antisense (5′-UGAUGGUAAGGAUAGGUCGTT-3′); strand 3, sense (5′-CAGCUUUGAGGUUCGUGUUtt-3′) and antisense (5′-AACACGAACCUCAAAGCUGTT-3′); and strand 4, sense (5′-GUUGGGGAAUAGGUUGAUAtt-3′) and antisense (5′-UAUCAACCUAUUCCCCAACTT-3′). The siRNA sequence targeting NF-κB p65 gene silencing was as follows: sense strand, 5′-GCCCUAUCCCUUUACGUC-3′, and antisense strand, 5′-GACGUAAAGGGAUAGGGC-3′. The siRNA (ON-TARGET plus SMART poolTM) for MnSOD gene silencing was purchased from Dharmacon (Thermo Scientific). The control siRNAs used in this study were pooled from three different non-targeted small RNA fragments.
Promoter Constructs and Luciferase Assay
The original promoter and enhancer-reporter constructs were prepared in our laboratory as described previously (19, 20). For reporter gene activity, a luciferase assay was performed by co-transfecting the cells with the p53 expression vector and vector containing the enhancer (I2E) and the promoter (−3400/+24, −555/+24, or −210/+24) of the human MnSOD gene in the pGL3 reporter vector. β-Galactosidase containing luciferase cDNA was also co-transfected with the firefly luciferase reporter vector as an internal control at a tenth the concentration. Twelve hours after transfection, the cells were washed twice with PBS and incubated in fresh medium. Another 12 h later, transfected cells were trypsinized and replated in a 12-well plate at a density of 1.5 × 10⁵ cells per well. After an additional 24 h, cells were lysed in passive lysis buffer, cell lysates were collected, and the samples were analyzed by the luciferase reporter assay system, in accordance with the manufacturer's instructions, in a TD-20/20 luminometer.
p53-tet-on Stable Clone
p53 cDNA was inserted into the pTRE-tet-on expression vector and stably transfected into PC-3 cells following a Lipofectamine transfection protocol. The tet-on-positive clones were screened based on the induction ability of the reporter gene activity upon doxycycline treatment. Positive clones were propagated and used for the experiment.
Nuclear Extract Preparation
Nuclei were isolated from cells as follows. Briefly, cells was collected and centrifuged at 100 × g for 2 min at 4 °C to obtain a cell pellet. Cell pellets were then re-suspended in buffer A containing 10 mm HEPES (pH 7.9), 1.5 mm MgCl2, 10 mm KCl, 0.5 mm dithiothreitol, and 0.2 mm phenylmethylsulfonyl fluoride (PMSF) plus protease inhibitors (pepstatin, aprotinin, leupeptin) at a concentration of 1 μg/ml. The phosphatase inhibitors NaF (5 mm) and Na3VO4 (1 mm) were also included. The cell suspension was incubated on ice for 15 min. Then 12.5 μl of 10% Nonidet P-40 was added and the mixture was vigorously vortexed for 15 s. The cytoplasmic and nuclear fractions were separated by centrifugation at 17,000 × g at 4 °C for 30 s. Subsequently, the nuclear pellets were re-suspended in buffer B containing 20 mm HEPES (pH 7.9), 1.5 mm MgCl2, 420 mm NaCl, 0.2 mm EDTA, 35% glycerol, 0.5 mm dithiothreitol, 0.2 mm phenylmethylsulfonyl fluoride, and protease inhibitors (pepstatin, aprotinin, leupeptin) at a concentration of 1 μg/ml, followed by a 20 min incubation on ice. Nuclear proteins in the supernatant fraction were collected by centrifugation at 14,000 × g at 4 °C for 2 min.
Western Analysis
Proteins were analyzed by Western blotting. Samples were boiled with 1 x Laemmli buffer and subjected to 10% sodium dodecyl sulfate (SDS)-polyacrylamide gel electrophoresis and transferred to a nitrocellulose membrane. The transfer efficiency was assessed by incubation with 0.1% Ponceau solution. The membrane was washed with distilled water until the dye disappeared completely. The membranes were then blocked with 5% nonfat dried milk in a Tris-buffered saline Tween-20 (TBS-T; 10 mm Tris-HCl, pH 7.8, 150 mm NaCl, and 0.05% [v/v] Tween 20) buffer pH (7.8) for at least 1 h at room temperature. After a short wash with TBS-T buffer, the membranes were incubated in the primary antibody for at least 2 h at room temperature or overnight at 4 °C. The primary antibodies were diluted in TBS-T buffer containing 5% nonfat dried milk at a dilution range of 1,000 to 5,000. The membranes were then washed three times, each for 10 min with TBS-T. The membranes were incubated with the secondary antibody at a dilution range of 2,000 to 10,000 for 1 to 2 h at room temperature. The membranes were washed twice with TBS-T buffer for 10 min and once with PBS for 5 min. Proteins were detected using the enhanced chemi-luminescence detection system (ECL®, Amersham Biosciences). The Quantity One® Image Analyzer software program (Bio-Rad) was used for quantitative densitometric analysis.
RNA Isolation, cDNA Synthesis, and RT-PCR
Total RNA was isolated using TRIzol reagent (Invitrogen), according to the manufacturer's protocol. Briefly, the cells were suspended in 1 ml of TRIzol reagent and incubated at room temperature for 15 min. Chloroform (0.2 ml) was added to the sample, vortexed, and then incubated at room temperature for 10 min. The RNA-containing aqueous phase was extracted after centrifugation at 12,000 × g for 15 min at 4 °C. RNA was precipitated with isopropyl alcohol, and the pellet was washed with 70% ethanol and air-dried. RNA samples having A260:A280 ratios of 18.0 ± 0.5 were used for reverse transcription (RT)-PCR. cDNA was generated using 0.4 μg of total RNA, oligo(dT) primer, and Moloney murine leukemia virus reverse transcriptase, according to the manufacturer's instructions (RT-for-PCR kit, Clontech Laboratories, Mountain View, CA), in a total volume of 20 μl. Two microliters of cDNA was amplified using primer sets for MnSOD and GAPDH (primer sequences are available upon request). PCR products were separated on an agarose gel and visualized by ethidium bromide.
Real-time PCR
Real-time PCR was performed with a Light Cycle System (Roche Applied Science) according to the manufacturer's protocol. Two microliters of cDNA was amplified using the primer sets for MnSOD and GAPDH (primer sequences are available upon request).
Electrophoretic Mobility Shift Assay
The consensus double-stranded oligonucleotides of the NF-κB sequence (5′-AGTTGAGGGGACTTTCCCAGGC-3′) and Sp1 sequence (5′- ATTCGATCGGGGCGGGGCGAGC-3′; Promega, Madison, WI) were radioactively labeled with [γ-32P]ATP and T4 polynucleotide kinase. The probes were purified on 20% native polyacrylamide gel and eluted in 600 μl of TE buffer (pH 7.4) containing 10 mm Tris HCl and 1 mm EDTA. The activity of the radiolabeled probes was counted, and the labeled probes were stored at −80 °C. Probes were used within 2 weeks after preparation. In each reaction, 5 μg of nuclear protein and 6 μl of 5× binding buffer containing 20% glycerol (v/v), 5 mm MgCl2, 2.5 mm EDTA, 5 mm dithiothreitol, 50 mm Tris-HCl (pH 7.5), 0.25 mg/ml poly(dI-dC), and 50,000 cpm of the radiolabeled probe were used. Samples were incubated for 20 min at room temperature. To determine the components of the complex bound to the consensus element, supershift experiments were performed by adding 1 μg of the primary antibody to the binding reaction and extending the incubation to 1 h at room temperature. DNA-protein complexes were separated from unbound probes on 6% polyacrylamide native gel.
ChIP Assays
One million PC-3 cells were grown on a 10-cm dish for 24 h followed by transfection with the p53 expression vector for 48 h. Histone to DNA cross-linking was performed as described previously (21) by adding formaldehyde directly to the culture media to a final concentration of 1%. Cells were then washed twice using ice-cold PBS containing protease inhibitors (1 mm phenylmethylsulfonyl fluoride, 1 μg/ml aprotinin, and 1 μg/ml pepstatin). Cells were pelleted by centrifuging at 2000 × g for 4 min at 4 °C and resuspended in protease inhibitor containing SDS lysis buffer (50 mm Tris-HCl (pH 8.1), 10 mm EDTA, and 1% SDS). Crossed-linked chromatin was sonicated on ice to shear DNA to lengths between 200 and 1000 bp. Sonicated cross-linked chromatin was centrifuged at 13,000 × g for 10 min to remove the insoluble materials. The protein concentration of the supernatant was estimated. An equal amount of soluble chromatin from each sample was then diluted 10-fold in ChIP dilution buffer (16.7 mm Tris, 167 mm NaCl, 1.1% Triton X-100, and 0.01% SDS). The diluted soluble chromatin fraction was pre-cleaned by using 20 μl of salmon sperm DNA/protein A-agarose beads. Pre-cleaned chromatin was mixed with the appropriate antibodies (2 μg of p65 (Santa Cruz Biotechnology) and 2 μg of Sp1 (Santa Cruz Biotechnology)). A parallel pre-immune control precipitation was performed using normal IgG. Antibodies and chromatin were allowed to mix and were rotated overnight at 4 °C and precipitated with the appropriate amounts of (60 μl) salmon sperm DNA/protein A-agarose slurry for 2 h at 4 °C with rotation to collect the antibody-chromatin complex. Beads were then washed by rotation at 4 °C with 1 ml of buffer in the following order of washing: low salt immune complexes wash buffer (20 mm Tris-HCl (pH 8.1), 150 mm NaCl, 2 mm EDTA, 1%Triton X-100, 1% SDS), high salt immune complex wash buffer (20 mm Tris-HCl (pH 8.1), 500 mm NaCl, 2 mm EDTA, 1%Triton X-100, 1% SDS), LiCl immune complex wash buffer (10 mm Tris-HCl (pH 8.1), 0.25 mm LiCl, 1% deoxycholate, 1% Nonidet P-40, 0.1% SDS), followed by two washes with TE buffer (10 mm Tris-HCl (pH 8.1), 1 mm EDTA (pH 8.1)). Precipitated immunocomplexes were eluted twice for 15 min each at room temperature with 250 μl of elution buffer (1% SDS, 0.1 m NaHCO3). Reversal of cross-linking was performed by heating the elution mixture at 65 °C for 4 h in the presence of 20 μl of 5 m NaCl. Proteins were digested with proteinase K by incubating for 1 h at 45 °C in the presence of EDTA. DNA was then recovered by phenol:chloroform extraction and ethanol precipitation followed by resuspension in nuclease-free water for PCR amplification. Immunoprecipitated DNA was analyzed by PCR amplification. For amplification of enhancer (1742–2083) elements of the MnSOD gene, the primer sets were: 5′-CGGGGTTATGAAATTTGTTGAGTA-3′ (forward primer, +1742) and 5′-CCACAAGTAAAGGACTGAAATTAA-3′ (reverse primer, +2083), and for −154 to +6 the primers were 5′-ACAGGCACGCAGGGCACCCCCGGGGTT-3′ (forward primer, −154) and 5′-TCCTGCGCCGCCCGCGGGGCCTTAAGAAA-3′ (reverse primer, −6). Amplified PCR products were subjected to 1% agarose gel electrophoresis and visualized by ethidium bromide staining.
MnSOD Activity Assay
MnSOD activity was measured in PC-3 cell homogenate by nitro blue tetrazolium reduction using xanthine and xanthine oxidase for superoxide generation, as described previously (21).
TUNEL Assay
A TUNEL assay was performed as described previously (22). PC-3 cells were plated (1 × 10⁴) in an 8-chambered polystyrene vessel tissue culture-treated glass slide (BD Biosciences) in 400 μl of medium, and the cells were grown for 24 h. Cells were transfected with siRNAs for 48 h and then treated with UVB at a dose of 50 mJ/cm2. After 24 h, the apoptotic cells were detected by using terminal deoxynucleotidyl transferase (In situ Cell Death Detection Kit, Fluorescein, Roche Applied Science) assay kit, which catalyzes polymerization of leveled nucleotides to free 3′-OH ends of DNA in a template-dependent manner (TUNEL reaction). Briefly, cells were fixed with 4% paraformaldehyde for 1 h, followed by the permeabilization of cells with 0.1% Triton X-100 and 0.1% sodium citrate solution. After washing the cells with 1× PBS (pH 7.4), TUNEL reaction mixture was added, and the slides were then incubated for 60 min in the dark in a humidified atmosphere at 37 °C. TUNEL-positive cells were counted using fluorescence microscopy (Axioplan, Zeiss, Germany). The apoptotic cell numbers were scored by counting 3 × 300 cells for each group in a random manner. The experiment was repeated at least three times to ensure reproducibility.
Measurement of Cellular ROS Level
Cells were transfected with MnSOD siRNA for 48 h. Culture media was then removed and washed two times with 1 × PBS, and the cells were labeled with 20 μm 5-(and 6)-carboxy-2,7-dichlorodihydrofluorescein diacetate (H2DCFDA, Molecular Probes) in PBS for 30 min at 37 °C. Cells were then washed with PBS, and the excitation (488 nm) and emission (530 nm) were measured by fluorescence spectrophotometry. Cells were also similarly treated with DCFDA alone for cellular uptake and ester cleavage between different groups.
Statistical Analysis
Data were analyzed using one-way analysis of variance for comparison. A Bonferroni post-test multiple comparisons procedure was used to determine the statistical significance. Data shown represent mean ± S.D.
RESULTS
p53 Modulates MnSOD Expression
To determine the role of p53 on MnSOD expression, we expressed p53 in PC-3 cells, which are p53-null. Full-length p53 cDNA was transfected into PC-3 cells at concentrations ranging from 0.05 to 2.0 μg for 48 h, and cell extracts were collected to determine the endogenous protein level of MnSOD and p53 by Western blot. The results show that MnSOD levels were increased when low levels of the p53 expression vector were used. However, when the expression of p53 was further increase, the level of MnSOD decreased, as demonstrated by densitometric quantification of multiple Western blots of p53 and MnSOD (Fig. 1A, panels a and b). Consistent with the protein level, the MnSOD activity is significantly increased following p53 overexpression at a dose of 0.2 μg, but MnSOD activity was significantly decreased when p53 concentration was increased by 10-fold (Fig. 1A, panel c). To determine whether the changes in the MnSOD levels associated with p53 overexpression occur at the transcription level, we determined the MnSOD mRNA level by semiquantitative RT-PCR and real-time RT-PCR. MnSOD mRNA levels were increased when 0.1 and 0.2 μg of the p53 expression vector were used (Fig. 1B). This increase in MnSOD mRNA was lost when the concentration of the plasmid was further increased. Interestingly, while the same trends were observed, the relative -fold changes in MnSOD mRNA levels were less obvious when the RNA levels were quantified by the semiquantitative method compared with that obtained from real-time PCR (Fig. 1B, panels a and b, versus Fig. 1B, panel c). The suppressive effect of p53 was not seen on the mRNA level of p21 or Bax. These results demonstrate the selective bi-directional concentration-dependent effects of p53 on MnSOD expression.
FIGURE 1.

Bi-directional effects of p53 on MnSOD expression. In A: a, endogenous MnSOD levels were detected by Western blot following overexpression of p53 in PC-3 cells. Dose-dependent expression of p53 following p53 transfection was also confirmed by the same Western blot. Equal loading was assured by detecting the GAPDH level. b, both MnSOD and GAPDH bands were measured densitometrically, and the relative band intensities are graphed as a function of p53 cDNA concentration. c, endogenous MnSOD activity following overexpression of either p53 expression vector or empty vector. In B: a, the bi-directional effect of p53 on MnSOD was verified at the mRNA level. The mRNA for p21, Bax, and MnSOD was detected by semiquantitative RT-PCR followed by agarose gel electrophoresis. Total RNA loading was monitored by amplification of GAPDH. b, both MnSOD and GAPDH RT-PCR band intensity were measured by densitometry and normalized with graphed as a function of p53 cDNA concentration. c, mRNA levels of MnSOD and GAPDH were measured by real-time PCR and normalized to GAPDH. Each data point represents the mean ± S.D. of three independent samples. Each data point represents the mean ± S.D. of three independent samples. Significant differences from the control are indicated as follows: *, p < 0.05 and **, p < 0.01. C, MnSOD and p53 levels were detected by Western blot following treatment of tetracycline-regulated p53 stable cells with different concentrations of doxycycline (Dox). GAPDH was also detected as a loading control.
To further verify the observed bi-directional effect of p53 on MnSOD, we generate stable cells expressing p53 under tet-regulated conditions. The expression of p53 was activated by treating the cells with doxycycline, and the expression of p53 increased with increasing concentrations of doxycycline (Fig. 1C). Consistent with the transient transfection results, a low level of p53 enhanced MnSOD expression, whereas this positive effect was reversed at high levels of p53.
UV-mediated Increase in p53 Levels Alters MnSOD Gene Expression in Vitro and in Vivo
To probe whether the bi-directional effect of p53 on MnSOD expression occurs under physiologically relevant conditions, we irradiate JB6 cells, which contain wild-type p53 (23), with UVB radiation at doses ranging from 12.5 to 200 mJ/cm2. Twenty-four hours after UVB exposure, cell extracts were prepared and the protein levels of MnSOD and p53 were determined by Western blot. At low doses of UVB radiation, MnSOD protein levels increased and remained elevated up to 50 mJ/cm2 (Fig. 2A, panels a and b). MnSOD levels dropped down to below the level of the control when the UVB dose was further increased. In contrast to MnSOD, the level of p21, a p53 target gene, increased in a dose-dependent manner. These results support the unique bi-directional effect of p53 on MnSOD expression, which was further verified by the increased in MnSOD level when p53 was suppressed by siRNA (Fig. 2A, panel c). We also verified the above finding in PC-3 cells (p53 null) by transfecting various levels of p53 expression vector followed by mock exposure or exposure to UVB radiation. Consistent with the results obtained in JB6 cells, the MnSOD levels were increased significantly following UVB radiation alone and suppressed after a high level of p53 expression (Fig. 2B, panels a and b). These results further support the bi-directional effect of p53 on MnSOD expression in cultured cells. To further validate the bi-directional effect of p53 on MnSOD expression in vivo, we expose the skin of wild-type B6C3 mice to UVB radiation at doses ranging from 1 to 25 kJ/m2. Twenty-four hours after UVB exposure, skin tissue was harvested, tissue homogenates were prepared, and RNA was isolated. The p53 and MnSOD protein levels in tissue homogenates were analyzed by Western blot (Fig. 2C, panel a). UVB radiation dose-dependently increased p53 levels. However, compared with the untreated control, MnSOD levels increased at the UVB dose of 1 kJ/m2 and reach statistical significance at 2.5 kJ/m2 but were reduced when the UVB dose reached 5 kJ/m2 or higher. The expression level of p53 and MnSOD were confirmed at the mRNA level by RT-PCR (Fig. 2C, panel b).
FIGURE 2.

UVB-mediated bi-directional effects of p53 on MnSOD expression in vitro and in vivo. A, JB6 cells were treated with UVB at doses range of 12.5 to 200 mJ/cm2. After 24 h of treatment, cell lysates were prepared and subjected to SDS-PAGE. a, p53, p21, and MnSOD protein levels were detected by Western blot. The same membrane was probed with a β-actin antibody to assess total protein loading. b, p53 and MnSOD band intensities were determined by densitometry and normalized to β-actin. The relative band intensities are graphed as a function of UVB dose. Each data point represents the mean ± S.D. of three independent samples. Significant differences from the control are indicated; *, p < 0.05 and **, p < 0.01. c, JB6 cells were transfected with either control siRNA (0.4 nm) or p53 siRNA (0.4 nm) for 48 h followed by UVB treatment. Twenty-four hours after UVB treatment, cell lysates were prepared, and the proteins were analyzed by Western blot using antibodies against p53, p21, MnSOD, and β-actin. B, PC-3 cells were transfected with p53 expression vector and treated with UVB radiation at a dose of 50 mJ/cm2. a, MnSOD, p53, and GAPDH were detected by Western blotting using antibodies against MnSOD, p53, and GAPDH, respectively. b, triplicate data sets are densitometrically scanned and normalized with GAPDH as loading control. Each data point represents the mean ± S.D. of three independent samples. Significant differences from the control are indicated; *, p < 0.05 and **, p < 0.01. C, the dorsal side of the B6C3 mouse skin was shaved and irradiated for 24 h with UVB at doses ranging from 1 to 25 kJ/m2. a, tissue homogenates were prepared, and the protein levels of p53, MnSOD, and GAPDH were detected by Western blot. Densitometry of the p53 and the MnSOD band intensities were normalized against GAPDH and graphed as a function of UVB dose. b, total RNA was isolated, and the levels of p53, MnSOD, and GAPDH mRNA were detected by RT-PCR. p53 and MnSOD mRNA bands were determined by densitometry and normalized to GAPDH, which was used as a loading control. Each data point represents the mean ± S.D. of four to five individual animals in each group. Significant differences from the control are indicated; *, p < 0.05 and **, p < 0.01.
p53-mediated MnSOD Transcription Is Independent of Its Binding Site
Previous studies have suggested that putative p53 binding sites are located in the MnSOD promoter region at 328 and 2032 bp upstream to the transcriptional start site (17, 18). Therefore, we tested whether the effects of p53 on MnSOD gene transcription are dependent on these putative p53 binding sites by co-transfecting PC-3 cells with the p53-expression vector and various MnSOD promoter (−3400/+24, −555/+24, or −210/+24)-driven luciferase constructs. As shown in Fig. 3A, expression of p53 suppresses the promoter-driven luciferase activity in a dose-dependent manner. These results demonstrate that the suppressive effect of p53 on MnSOD promoter activity is independent of the presence of these putative p53 binding sites (Fig. 3A). Addition of the enhancer element to the MnSOD promoter construct led to the bi-directional effect of p53 as observed with the endogenous MnSOD gene (Fig. 3B). These results suggest that the positive effect of p53 on MnSOD expression is dependent on the presence of the intronic enhancer element of the MnSOD gene. We have previously demonstrated that the nuclear factor κB (NF-κB) site in this enhancer element is essential for the induction of MnSOD by cytokines and tumor promoters (24). Therefore, we wanted to determine whether the observed p53-mediated increase in MnSOD transcription is dependent on the NF-κB site. To address this, we mutated the NF-κB site in this enhancer element and determined the reporter gene activity. As shown in Fig. 3C, mutation of the NF-κB site in the enhancer element abolished the observed p53-mediated induction of MnSOD gene transcription. These results demonstrate that the NF-κB site in the enhancer element is necessary for p53-mediated induction of MnSOD gene transcription and suggest that members of the NF-κB family may participate in the observed positive effect of p53 on MnSOD expression.
FIGURE 3.

p53 effect on MnSOD promoter and enhancer activities. MnSOD gene transcription was measured based on the luciferase activity of a MnSOD promoter (−555 to 24) or a promoter/enhancer (−555 to +24/1742 to 2083)-driven pGL3 reporter vector. A, luciferase activity of the MnSOD promoter-driven pGL3-reporter vector. B, luciferase activity of the MnSOD promoter/enhancer-driven pGL3-reporter vector. C, luciferase activity of the MnSOD promoter/enhancer in the presence of a functional (left) or a nonfunctional (right) NF-κB binding site in the enhancer region. Each data point represents the mean ± S.D. of three individual experiments. Significant differences from control are indicated, *, p < 0.05 and **, p < 0.01.
Identification of Transcription Factors That Participate in p53-mediated MnSOD Expression
We have previously shown that the presence of Sp1 is essential for the constitutive expression of MnSOD, whereas the presence of NF-κB is essential for the inducible expression of MnSOD (9). To investigate the mechanism underlying the bi-directional effects of p53 on MnSOD transcription, we transfected 0.2 or 2.0 μg of p53 cDNA into PC-3 cells and determined the nuclear level, as well as the activity level of both NF-κB/p65 and Sp1 by Western blot and EMSA, respectively. Transfection of 0.2 μg of p53 led to an increase in the protein and DNA-binding activity of p65 but not of Sp1 (Fig. 4A, panels a–e). However, an increase in p65 alone was insufficient to overcome the suppressive effects of p53 when it is expressed at a higher level. At these levels of p53, the Sp1 protein level remained unchanged. However, Sp1-binding activity was dose-dependently suppressed with the expression of p53 (Fig. 4A, panels d and e). Similar results were obtained using nuclear extracts isolated from PC3 cells stably expressing p53 under tet regulation (Fig. 4A, panel f). The nuclear level of Sp1 remained unchanged at all doses of Doxycycline used. At the 0.5 μg/ml concentration of Doxycycline, the level of p65 protein increased while 5 μg/ml of Doxycycline did not further increase the p65 levels in the nuclear extract (Fig. 4A, panel f). To verify the role of p65 and Sp1, we performed a ChIP assay with antibodies directed against p65 and Sp1. Using purified DNA as the template for the ChIP assay, the enhancer and promoter fragments were detected by a p65 antibody and a Sp1 antibody, respectively (Fig. 4B, panel a–d). Template DNA obtained from a parallel ChIP using non-immune IgG did not yield any PCR products (Fig. 4B). The amount of DNA used for each sample was verified by PCR amplification of the input controls (Fig. 4B). The PCR product obtained from the cells transfected with 0.2 μg of p53 showed the highest amount of the enhancer fragment with the p65 antibody. The promoter fragment amplified after p53 overexpression was decreased when the ChIP was preformed with the Sp1 antibody. These results are consistent with the DNA-binding data obtained by EMSA, suggesting that p65 binding to the MnSOD enhancer may contribute to the induction of MnSOD gene transcription.
FIGURE 4.

Identification of transcription factors following p53 overexpression. A, nuclear extracts were prepared and purified following transfection of a p53 expression vector into PC-3 cells. a, Western blot analysis of p53, p65, and Sp1 was performed using nuclear extracts. The same membrane was reprobed with a GAPDH antibody as the loading control. b, triplicate data sets were densitometrically scanned and normalized with GAPDH as loading control. Each data point represents the mean ± S.D. of three independent samples. Significant differences from the control are indicated; *, p < 0.05. c, EMSA was performed with an NF-κB probe as described under “Experimental Procedures.” For supershift experiments, EMSA reaction mixtures were incubated with 1 μg of an antibody specific for p65. The arrows point to protein-DNA complexes and supershift complexes. d, EMSA was performed with a Sp1 probe from the same nuclear extracts as described in d, and DNA-protein complexes were supershifted by incubating with 1 μg of the Sp1 antibody. The protein-DNA complexes and supershift complexes are indicated by arrows. e, DNA-protein complex bands were densitometrically scanned and graphed as a function of p53 concentration. Significant differences from the control are indicated; *, p < 0.05. f, nuclear extracts were also prepared and purified from tetracycline-regulated p53 stable cells. Nuclear levels of p53, p65, and Sp1 were detected by Western blot following doxycycline (Dox) treatment. The same membrane was reprobed with a GAPDH antibody as a loading control. B, the binding of transcription factors to the enhancer or promoter region of the MnSOD gene was evaluated by a ChIP assay after transfection with p53 as described under “Experimental Procedures.” Chromatins were immunoprecipitated by p65 and Sp1 antibodies or an IgG control. a, the p65-immunoprecipitated DNA was amplified by PCR using primers targeted to the enhancer element (1742–2083). b, the PCR bands of enhancer fragment were densitometrically scanned and normalized with input control. Each data point represents the mean ± S.D. of three independent samples. Significant differences from the control are indicated; *, p < 0.05. c, the Sp1-immunoprecipitated DNA was amplified by PCR using primers targeted to the promoter region (−154 to −6). DNA amplified by PCR from the corresponding samples without ChIP was used as an input control. d, the PCR bands of promoter fragment were densitometrically scanned and normalized with input control. Each data point represents the mean ± S.D. of three independent samples. Significant differences from the control are indicated; *, p < 0.05.
p65 siRNA Reduces the Positive Effect of p53 on MnSOD Transcription
To verify the role of p65 on p53-mediated MnSOD transcription, we used an siRNA approach. PC-3 cells were transfected with control siRNA or p65 siRNA with concomitant transfection of low or high amounts of the p53 expression vector. As shown in Fig. 5B (panels a and b), p65 siRNA suppresses p65 protein in the presence or absence of p53. Suppression of endogenous p65 by p65 siRNA had a significant effect on MnSOD expression as measured by MnSOD-driven reporter gene activity and MnSOD protein levels (Fig. 5, A and B). Expression of p65 siRNA significantly decreased both basal and p53-induced luciferase activity (Fig. 5A). Consistent with the luciferase activity data, p65 siRNA also suppressed the MnSOD protein levels without affecting the level of GAPDH (Fig. 5B). These results demonstrate that the observed p53-induced MnSOD induction is mediated through the presence of p65.
FIGURE 5.

Knockdown of p65 diminishes p53-mediated MnSOD induction. PC-3 cells were transfected with control siRNA (0. 4 nm) or p65 siRNA (0.4 nm) along with the MnSOD promoter (−555 to +24)/enhancer-driven luciferase reporter vectors and two concentrations of the p53 expression vector. Forty-eight hours after transfection, cell lysates were prepared. A, luciferase activity was used to estimate MnSOD gene transcription. In B: a, the endogenous level of MnSOD protein was detected by Western blot using an antibody specific to MnSOD. The suppression of p65 protein by p65 siRNA and the increase in p53 protein after transfection of the p53 expression vector were determined by reprobing the membrane and subsequent Western blotting with a p65 or a p53 antibody, respectively. The same membrane was reprobed with a GAPDH antibody to assess the loading. b, the Western blot bands were densitometrically scanned and normalized with GAPDH. Each data point represents the mean ± S.D. of three independent set of experiments. Significant differences from the control are indicated; *, p < 0.05.
Increased Expression of p65 Can Overcome the Suppressive Effect of p53 on MnSOD Expression When p53 Is Present at a High Level
To validate the ability of p65 to overcome the suppressive effects of p53 on MnSOD gene transcription, PC-3 cells were co-transfected with the MnSOD promoter/enhancer as well as the p65 and p53 expression vectors. The amount of DNA was adjusted to ensure that the same final amount of DNA was used in all samples. Overexpression of p53 and p65 led to increased p53 and p65 protein levels, as shown in Fig. 6A. As expected, p65 dose-dependently increased MnSOD protein levels. The levels of GAPDH remain unaffected with the overexpression of the expression vectors (Fig. 6, B and C). Consistent with the protein level, MnSOD promoter/enhancer-mediated reporter gene activity was increased with increased levels of p65, whereas overexpression of p53 alone significantly suppressed MnSOD gene transcription. These results demonstrate that overexpression of p65 can increase MnSOD expression even in the presence of p53.
FIGURE 6.

Overexpression p65 overrides the negative effect of p53 on MnSOD. PC-3 cells were transfected with either pcDNA3. 1 or pcDNA3.1/p65 along with the MnSOD promoter (−555 to +24)/enhancer-driven luciferase reporter vectors and a high concentration of the p53 expression vector. Forty-eight hours after transfection, cell lysates and nuclear extracts were prepared. A, Cell lysates were used to measure the luciferase activity. B, a, the endogenous level of MnSOD protein was detected by Western blot of the cell lysate. Overexpression of p65 was detected by reprobing the membrane with a p65 antibody. The same membrane was reprobed with a GAPDH antibody to assess loading. b, the band intensities of p65 and MnSOD were normalized with GAPDH. Each data point represents the mean ± S.D. of three independent set of experiments. Significant differences from the respective control group are indicated; *, p < 0.05 and **, p < 0.01. C, the nuclear level of p65 and p53 was determined by Western blot following transfection with p65 and p53. The same membrane was reprobed with a GAPDH antibody that was used as a loading control. D, a ChIP assay was carried out as described under “Experimental Procedures.” DNA-precipitated from PC-3 cells by a p65 antibody, was analyzed by PCR using primers specific to the MnSOD enhancer element (1742–2083).
To further verify the effect of p65 on p53-mediated MnSOD transcription, we performed a ChIP assay in the presence of increasing levels of p65. Overexpression of p65 increased p65 levels in the nucleus with or without co-transfection of p53. Expression of p53 also increased p53 levels in the nucleus (Fig. 6C). Overexpression of p65 increased p65 binding to the enhancer region, and the presence of p53 did not interfere with DNA binding of p65 to the MnSOD enhancer (Fig. 6D).
Knockdown of MnSOD Increases ROS Production and Accelerate Apoptosis
To verify the biological significance of MnSOD suppression, we transfect MnSOD siRNA in PC-3 cells and performed TUNEL assay following UVB radiation. We also measured the H2DCFDA fluorescence level as a measure of ROS generation. Cells transfected with MnSOD siRNA had a significant increase in H2DCFDA fluorescence level (Fig. 7A, panel c), which is consistent with the suppression of MnSOD protein and activity levels (Fig. 7A, panels a and b). Low levels of UVB radiation alone or suppression of MnSOD alone did not alter the apoptosis level significantly. However, reduction in MnSOD level led to a significant increase in apoptosis upon exposure to low dose UVB radiation (Fig. 7B). This result demonstrates that MnSOD deficiency enhances cellular sensitivity to UV radiation.
FIGURE 7.
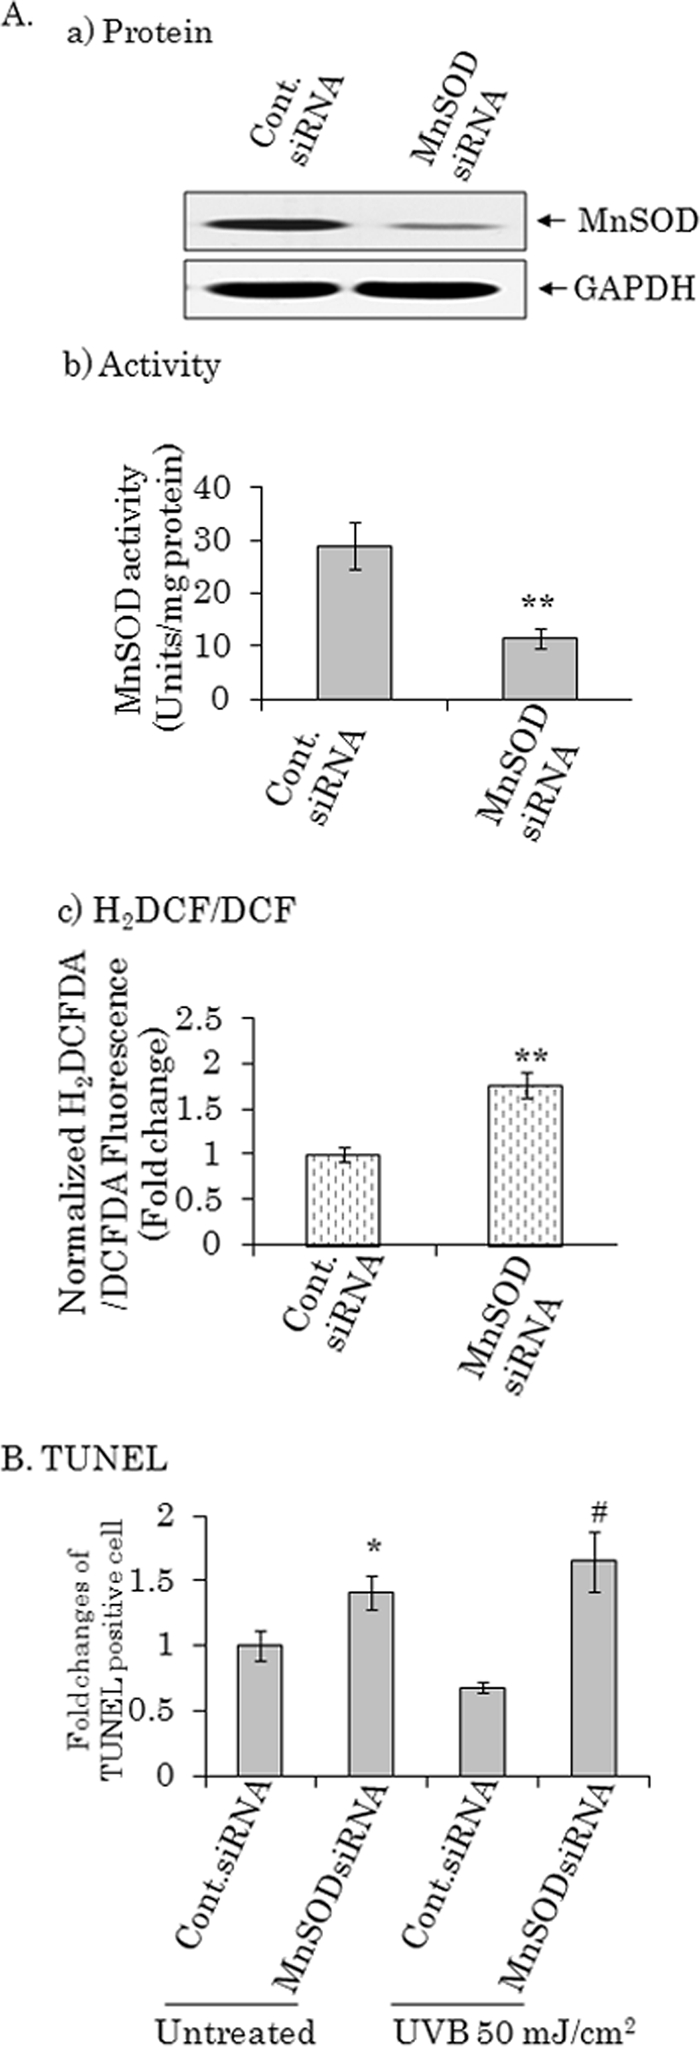
Low level of MnSOD enhances UVB-mediated apoptosis. PC-3 cells were transfected either with MnSOD siRNA or control siRNA. After 48 h cells were either mock treated or treated with UVB radiation at a dose of 50 mJ/cm2 for an additional 24 h. In A: a, MnSOD protein levels were detected by Western blotting; b, MnSOD activity; and c, H2DCFDA levels. B, TUNEL quantification following siRNA transfection and low dose UVB radiation. Each data point represents the mean ± S.D. of three independent set of experiments. Significant different from UVB-treated control siRNA group; #, p < 0.05.
DISCUSSION
The present study demonstrates the ability of the tumor suppressor p53 to either activate or repress the expression of a single target gene. Previously, we have shown that overexpression of p53 in hepatocellular carcinoma (HepG2) cells harboring wild-type p53 suppresses MnSOD gene transcription by interfering with the positive effect of Sp1 on MnSOD expression (9). Results from the present study confirm our previous findings and extend them to demonstrate that, under appropriate conditions, p53 can also enhance MnSOD expression. We further demonstrate that this bi-directional effect of p53 on MnSOD expression can occur under certain pathological conditions, such as exposure to UVB radiation.
In general, the mechanism by which p53 mediates transcriptional activation of its target gene is dependent on direct DNA binding to the promoter region. For example, p53 binds to its consensus DNA binding sites and activates transcription of p21, Bax, and PUMA (25–27). Our finding that p53 can also activate transcription of MnSOD is consistent with the observation reported by Hussain et al. (18). A computer-based F-match search of the MnSOD gene and published reports suggest that a p53 binding region is located at 328 bp and at 2032 bp upstream of the transcriptional start site in the MnSOD gene (17, 18). Our results suggest that transcriptional activation of the MnSOD gene is independent of direct binding of p53 with any of these sites, because p53 is suppressive to MnSOD gene transcription regardless of the length of the promoter (Fig. 3A) and p53-mediated transactivation of the MnSOD reporter gene occurs only when the intronic enhancer element is present (Fig. 3B). Interestingly our results also demonstrate that, when p53 is express at a high level, it suppresses MnSOD expression even when the enhancer is present.
While expression of p53 exerts a positive effect on nuclear levels of p65, the effect is not dependent on the concentration of p53 but is more effective at relatively low levels of p53. The mechanism by which p53 caused an increase in p65-binding activity is unclear. The induction of MnSOD transcription in response to the activation of NF-κB is well documented (19, 24, 28). In fact, we have previously shown that the NF-κB site in the enhancer element of the MnSOD gene is essential for the induction of MnSOD by tumor promoters and cytokines (24). Therefore, it is possible that overexpression of p53 creates a stress-like condition, which, in turn, increases the response of NF-κB (a stress-responsive transcription factor).
p53 is a versatile transcription factor that has been linked to other transcription factors, including NF-κB and Sp1, by virtue of its structure and amino acid composition. NF-κB is an important modulator of p53 transcriptional activity and vice versa. Thus, cross-talk between p53 and NF-κB exist. However, the contribution of NF-κB to cell fate by antagonizing or cooperating with p53 is complex (29). NF-κB competes with p53 for co-activators, such as p300 and CBP. CBP/p300 are functional integrators of multiple signal transduction pathways, and many diverse transcriptional factors compete with each other to interact with a limited pool of CBP/p300 within the cell (30, 31). Thus the relative contribution of p53 or p65 in the transcriptional regulation of a target gene depends on the recruitment of co-activators such as CBP/p300. Huang et al. showed that p300/CBP directly binds preferentially to NF-κB, but not p53, thereby favoring proliferation and survival over p53-dependent apoptosis (32). Thus, p300-mediated cell fate is related to its binding preference for NF-κB (33). We found that p53 overexpression increases the DNA-binding activity of NF-κB (Fig. 4). The increase in MnSOD transcription mediated by p53 was completely abolished after the suppression of p65 (Fig. 5) or mutation of the NF-κB binding site in the enhancer element (Fig. 3). These data suggest that p53 exerts its positive effect on MnSOD by increasing NF-κB binding to the recognition site. This possibility is consistent with our previous studies demonstrating that NF-κB is essential for the induction of MnSOD (19, 24).
The finding that high levels p53 suppress MnSOD transcription confirms our previous observation that p53 represses MnSOD transcription (9). Various mechanisms have been proposed for p53-mediated transcriptional repression, including interfering with transcription initiation (34), binding of the p53 response element (8), and forming complexes with other proteins (36). An additional mechanism, predicted by the recruitment inhibition model, involves p53 interacting with activators at the promoter level and then interfering with the function of the activator by forming a complex leading to the suppression of gene transcription (37). Our previous study demonstrated that p53 forms complexes with Sp1 and then suppress MnSOD expression (9). Others have shown that p53-dependent suppression involves p53 interfering with basal transcription machinery outside of gene-specific activators and the binding site (38). Reports have also indicated that p53-dependent suppression involves the alteration of chromatin structure and recruitment of proteins to the promoter (39). Our results indicate that high levels of p65 are required to overcome the suppressive effects of p53 on MnSOD gene expression. Our EMSA data showed that overexpression of p53 dose-dependently displaces Sp1 from its binding sites on the MnSOD promoter without affecting the protein level of Sp1. These results are consistent with the data obtained from a combined ChIP assay and are again supportive of the notion that high levels of p53 significantly affects Sp1 binding to the promoter (Fig. 4B, panel b). Our results are consistent with the possibility that low p53 levels favor cell survival by increasing MnSOD expression, whereas higher p53 levels may override this pathway and trigger p53-mediated apoptosis by reducing pro-survival genes, such as MnSOD. It has also been demonstrated that suppression of MnSOD is directly implicated in excessive production of ROS and mitochondrial injury (40). Our findings, which demonstrate that suppression of MnSOD increases ROS production, are consistent with this previous observation and extend to demonstrate that suppression of MnSOD sensitizes cells to low doses of UVB radiation that do not cause apoptosis. Low dose UVB irradiation has been reported to trigger a protective effect via the p53-dependent gene activation program leading to increased cell survival of human keratinocyte (35). Our data demonstrate that the low level of stress produced by a low dose of UVB exposure increases MnSOD expression, while expression of MnSOD was significantly suppressed upon high dose UVB exposure and is correlated with the higher level of p53 induction caused by high dose UVB exposure (Fig. 2).
Overall our data demonstrate that p53 can both activate and repress a single gene. The interplay between the enhancer- and promoter-binding proteins determines the transactivation or transrepression role of p53 on MnSOD gene transcription. These findings are very interesting and biologically relevant. The bi-directional function of p53 may contribute to the cellular decision to survive or die by transactivating or transrepressing a single gene, such as MnSOD.
Acknowledgments
We thank Dr. Nancy H. Colburn, NCI-NIH (Frederick, MD), for the generous gift of the JB6 cell line. We also thank Dr. Yi Sun, University of Michigan, and Dr. Vivek Rangnekar, University of Kentucky, for the kind gifts of the p53 and p65 expression vectors, respectively. We also thank Dr. Ravikumar Rangaswamy Rao for assisting in image acquisition by microscope following TUNEL staining.
This work was supported, in whole or in part, by National Institutes of Health Grants CA49797 and CA73599 (to D. K. S. C.).
- MnSOD
- manganese superoxide dismutase
- NF-κB
- nuclear factor κB
- Sp1
- specificity protein 1
- GAPDH
- glyceraldehyde-3-phosphate dehydrogenase
- PC-3
- prostate cancer cell-3
- ChIP
- chromatin immunoprecipitation
- siRNA
- small interference RNA
- TUNEL
- terminal deoxynucleotidyl transferase dUTP nick-end labeling
- H2DCFDA
- 5-(and 6)-carboxy-2,7-dichlorodihydrofluorescein diacetate
- ROS
- reactive oxygen species
- tet
- tetracycline
- PBS
- phosphate-buffered saline
- RT
- reverse transcription
- EMSA
- electrophoretic mobility shift assay
- CBP
- CREB-binding protein.
REFERENCES
- 1.Kern S. E., Kinzler K. W., Bruskin A., Jarosz D., Friedman P., Prives C., Vogelstein B. (1991) Science 252, 1708–1711 [DOI] [PubMed] [Google Scholar]
- 2.Miyashita T., Harigai M., Hanada M., Reed J. C. (1994) Cancer Res. 54, 3131–3135 [PubMed] [Google Scholar]
- 3.el-Deiry W. S., Kern S. E., Pietenpol J. A., Kinzler K. W., Vogelstein B. (1992) Nat. Genet. 1, 45–49 [DOI] [PubMed] [Google Scholar]
- 4.Werner H., Karnieli E., Rauscher F. J., LeRoith D. (1996) Proc. Natl. Acad. Sci. U.S.A. 93, 8318–8323 [DOI] [PMC free article] [PubMed] [Google Scholar]
- 5.Subler M. A., Martin D. W., Deb S. (1992) J. Virol. 66, 4757–4762 [DOI] [PMC free article] [PubMed] [Google Scholar]
- 6.Liu X., Miller C. W., Koeffler P. H., Berk A. J. (1993) Mol. Cell. Biol. 13, 3291–3300 [DOI] [PMC free article] [PubMed] [Google Scholar]
- 7.Budhram-Mahadeo V., Morris P. J., Smith M. D., Midgley C. A., Boxer L. M., Latchman D. S. (1999) J. Biol. Chem. 274, 15237–15244 [DOI] [PubMed] [Google Scholar]
- 8.Lee K. C., Crowe A. J., Barton M. C. (1999) Mol. Cell. Biol. 19, 1279–1288 [DOI] [PMC free article] [PubMed] [Google Scholar]
- 9.Dhar S. K., Xu Y., Chen Y., St. Clair D. K. (2006) J. Biol. Chem. 281, 21698–21709 [DOI] [PMC free article] [PubMed] [Google Scholar]
- 10.Vogelstein B., Lane D., Levine A. J. (2000) Nature 408, 307–310 [DOI] [PubMed] [Google Scholar]
- 11.Ruiz-Lozano P., Hixon M. L., Wagner M. W., Flores A. I., Ikawa S., Baldwin A. S., Jr., Chien K. R., Gualberto A. (1999) Cell Growth Diff. 10, 295–306 [PubMed] [Google Scholar]
- 12.Kunz C., Pebler S., Otte J., von der Ahe D. (1995) Nucleic Acids Res. 23, 3710–3717 [DOI] [PMC free article] [PubMed] [Google Scholar]
- 13.Tan M., Li S., Swaroop M., Guan K., Oberley L. W., Sun Y. (1999) J. Biol. Chem. 274, 12061–12066 [DOI] [PubMed] [Google Scholar]
- 14.Robert K., Nehmé J., Bourdon E., Pivert G., Friguet B., Delcayre C., Delabar J. M., Janel N. (2005) Gastroenterology 128, 1405–1415 [DOI] [PubMed] [Google Scholar]
- 15.Nakano T., Oka K., Taniguchi N. (1996) Cancer Res. 56, 2771–2775 [PubMed] [Google Scholar]
- 16.Liu B., Chen Y., St. Clair D. K. (2008) Free Radic. Biol. Med. 44, 1529–1535 [DOI] [PMC free article] [PubMed] [Google Scholar]
- 17.Drane P., Bravard A., Bouvard V., May E. (2001) Oncogene 20, 430–439 [DOI] [PubMed] [Google Scholar]
- 18.Hussain S. P., Amstad P., He P., Robles A., Lupold S., Kaneko I., Ichimiya M., Sengupta S., Mechanic L., Okamura S., Hofseth L. J., Moake M., Nagashima M., Forrester K. S., Harris C. C. (2004) Cancer Res. 64, 2350–2356 [DOI] [PubMed] [Google Scholar]
- 19.Xu Y., Kiningham K. K., Devalaraja M. N., Yeh C. C., Majima H., Kasarskis E. J., St. Clair D. K. (1999) DNA Cell Biol. 18, 709–722 [DOI] [PubMed] [Google Scholar]
- 20.Dhar S. K., Lynn B. C., Daosukho C., St. Clair D. K. (2004) J. Biol. Chem. 279, 28209–28219 [DOI] [PMC free article] [PubMed] [Google Scholar]
- 21.Dhar S. K., Xu Y., Noel T., St. Clair D. K. (2007) Carcinogenesis 28, 2605–2613 [DOI] [PMC free article] [PubMed] [Google Scholar]
- 22.Dhar S. K., St. Clair D. K. (2009) J. Biol. Chem. 284, 16409–16418 [DOI] [PMC free article] [PubMed] [Google Scholar]
- 23.Sun Y., Nakamura K., Hegamyer G., Dong Z., Colburn N. (1993) Mol. Carcinog. 8, 49–57 [DOI] [PubMed] [Google Scholar]
- 24.Kiningham K. K., Xu Y., Daosukho C., Popova B., St. Clair D. K. (2001) Biochem. J. 353, 147–156 [PMC free article] [PubMed] [Google Scholar]
- 25.el-Deiry W. S., Tokino T., Velculescu V. E., Levy D. B., Parsons R., Trent J. M., Lin D., Mercer W. E., Kinzler K. W., Vogelstein B. (1993) Cell 75, 817–825 [DOI] [PubMed] [Google Scholar]
- 26.Miyashita T., Reed J. C. (1995) Cell 80, 293–299 [DOI] [PubMed] [Google Scholar]
- 27.Nakano K., Vousden K. H. (2001) Mol. Cell 7, 683–694 [DOI] [PubMed] [Google Scholar]
- 28.Jones P. L., Ping D., Boss J. M. (1997) Mol. Cell. Biol. 17, 6970–6981 [DOI] [PMC free article] [PubMed] [Google Scholar]
- 29.Perkins N. D. (2007) Nat. Rev. Mol. Cell Biol. 8, 46–62 [DOI] [PubMed] [Google Scholar]
- 30.Ravi R., Mookerjee B., van Hensbergen Y., Bedi G. C., Giordano A., El-Deiry W. S., Fuchs E. J., Bedi A. (1998) Cancer Res. 58, 4531–4536 [PubMed] [Google Scholar]
- 31.Webster G. A., Perkins N. D. (1999) Mol. cell Biol. 19, 3485–3495 [DOI] [PMC free article] [PubMed] [Google Scholar]
- 32.Huang W. C., Ju T. K., Hung M. C., Chen C. C. (2007) Mol. Cell 26, 75–87 [DOI] [PMC free article] [PubMed] [Google Scholar]
- 33.Goodman R. H., Smolik S. (2000) Genes Dev. 14, 1553–1577 [PubMed] [Google Scholar]
- 34.Farmer G., Friedlander P., Colgan J., Manley J. L., Prives C. (1996) Nucleic Acids Res. 24, 4281–4288 [DOI] [PMC free article] [PubMed] [Google Scholar]
- 35.Decraene D., Smaers K., Maes D., Matsui M., Declercq L., Garmyn M. (2005) J. Invest. Dermatol. 125, 1026–1031 [DOI] [PubMed] [Google Scholar]
- 36.Murphy M., Ahn J., Walker K. K., Hoffman W. H., Evans R. M., Levine A. J., George D. L. (1999) Genes Dev. 13, 2490–2501 [DOI] [PMC free article] [PubMed] [Google Scholar]
- 37.Ho J., Benchimol S. (2003) Cell Death Differ. 10, 404–408 [DOI] [PubMed] [Google Scholar]
- 38.Yamabe Y., Shimamoto A., Goto M., Yokota J., Sugawara M., Furuichi Y. (1998) Mol. Cell. Biol. 18, 6191–6200 [DOI] [PMC free article] [PubMed] [Google Scholar]
- 39.Krause K., Wasner M., Reinhard W., Haugwitz U., Dohna C. L., Mössner J., Engeland K. (2000) Nucleic Acids Res. 28, 4410–4418 [DOI] [PMC free article] [PubMed] [Google Scholar]
- 40.Hu Y., Rosen D. G., Zhou Y., Feng L., Yang G., Liu J., Huang P. (2005) J. Biol. Chem. 280, 39485–39492 [DOI] [PubMed] [Google Scholar]