

Abstract
Protein Kinase C (PKC) is a family of serine/threonine kinases that play a central role in cellular signal transduction. The second messenger diacylglycerol having two long carbon chains acts as the endogenous ligand for the PKCs. Polyphenol curcumin, the active constituent of Curcuma longa is an anticancer agent and modulates PKC activity. To develop curcumin derivatives as effective PKC activators, we synthesized several long chain derivatives of curcumin, characterized their absorption and fluorescence properties and studied their interaction with the activator-binding second cysteine-rich C1B subdomain of PKCδ, PKCε and PKCθ. Curcumin (1) and its C16 long chain analog (4) quenched the intrinsic fluorescence of PKCδC1B, PKCεC1B and PKCθC1B in a manner similar to that of PKC activator 12-O-tetradecanoylphorbol 13-acetate (TPA). The EC50s of the curcumin derivatives for fluorescence quenching varied in the range of 4-11 μM, whereas, EC50s for TPA varied in the range of 3-6 μM. Fluorescence emission maxima of 1 and 4 were blue shifted and the fluorescence anisotropy values were increased in the presence of the C1B domains similar to that shown by the fluorescent analog of TPA, sapintoxin–D, confirming that they were bound to the proteins. Molecular docking of 1 and 4 with novel PKC C1B revealed that both the molecules form hydrogen bonds with the protein residues. The present result shows that curcumin and its long chain derivatives bind to the C1B subdomain of novel PKCs and can be further modified structurally to improve its binding and activity.
1. Introduction
Protein kinase C (PKC) is a family of serine/threonine protein kinases involved in the regulation of various aspects of cell functions, including cell growth, differentiation, metabolism, and apoptosis.1 During the past three decades, it has become clear that PKC isoforms play important role in the pathology of several diseases such as cancer, diabetes, stroke, heart failure, and Alzheimer’s disease.2-8 Therefore, PKC has been a subject of intensive research and drug development9, particularly in cancer research.
The PKC family has been divided into three main groups: conventional isoforms (α, βI, βII and γ) that require Ca2+ and diacylglycerol (DAG) for activation; novel isoforms (δ, ε, η, θ and μ) that require only DAG and atypical isoforms (ζ, ι and λ) that require neither Ca2+ nor DAG.10 DAG is a second messenger which is generated by the phospholipase C-catalyzed hydrolysis of membrane phosphatidylinositol-4,5-bisphosphate (PIP2)11 and selectively interacts with proteins containing a C1 domain and induces their translocation to discrete subcellular compartments. In the classical and novel PKC isoenzymes, the DAG-sensitive C1 domain is duplicated into a tandem C1 domain consisting of C1A and C1B subdomains. Atypical PKCs contain a single C1 domain that does not bind DAG. Along with the PKC family, there are six additional families of proteins that contain a DAG-responsive C1 domain.12,13 The C1 domains have become an attractive target in designing the PKC based drugs. Recently it has been found that alcohol and anesthetics also bind to the PKC C1 domains.14,15,16
Several classes of high-affinity ligands that target the DAG binding C1 domain have been previously described.17 Naturally occurring tumor promoters, phorbol esters, were the first ligands that were found to bind to the C1 domain of PKC.18 The phorbol ester binding site in PKCδ C1B domain has been characterized by X-ray crystallography.19 In addition to phorbol esters, naturally occurring C1 domain ligands include bryostatins, teleocidins, aplysiatoxins, ingenols, and iridals.18 Most of these C1 domain ligands from natural sources are highly complex in their chemical structure. Indolactam and benzolactam derivatives act as selective activators of novel PKC isoenzymes although they are also laborious to synthesize and modify.20,21 Therefore it is essential to find simpler template for ligand synthesis, whose structure could be easily modified and fine-tuned in order to achieve selectivity. Using this concept very recently it was found that isophthalic acid derivatives bind to the C1 domain and modulate PKC.18
Natural polyphenol curcumin (1), the active constituent of Curcuma longa, is one of the best studied natural compounds.22,23 Curcumin has been used as a spice to give a specific flavor and yellow color to curry, which is consumed daily by millions of people. Curcumin has been used as traditional medicine for liver disease (jaundice), indigestion, urinary tract diseases, rheumatoid arthritis and insect bites.23 This phytochemical has also demonstrated both anti-cancer and anti-angiogenic properties. Its anti-tumor properties include growth inhibition and apoptosis induction in a variety of cancer cell lines in vitro, as well as the ability to inhibit tumerogenesis in vivo.24-30 Curcumin has also been shown to modulate the activity of protein kinases,31,32 membrane ATPases33-36 and transcription factors.37,38 The positive interference of curcumin with the tumor promoting effects of phorbol esters has presumably been attributed to its effect of curcumin on the phorbol ester receptor, PKC.39 There is also well documented modulation of PKC activity by curcumin in vivo31 and in vitro40 using membrane-free systems. This specificity suggests that curcumin interacts with common domain(s) on target proteins. However, the molecular mechanism behind the physiological effects of curcumin is not well understood.
In the present study, we describe design, synthesis and binding properties of curcumin and its derivatives to the C1B subdomains of PKCδ, PKCε and PKCθ using fluorescence spectroscopy and molecular modeling studies. Curcumin (1) and its C16 long chain derivative (4) bind to the protein with the EC50 of 4-11 μM, whereas, PKC activator 12-O-tetradecanoylphorbol-13-acetate (TPA) binds with EC50 of 3-6 μM under the similar experimental condition. Fluorescence emission maxima of 1 and 4 were blue-shifted and anisotropy values were increased in the presence of proteins similar to that of TPA. In agreement with the binding results, the molecular modeling indicated that the curcumin derivatives form hydrogen bonds with the residues at the activator binding site of the proteins.
2. Results and discussion
We selected curcumin for our studies because it is commercially available, easily derivatizable and known to modulate PKC activity.36,41 The compound also contains two of the phorbol ester pharmacophores, namely the hydroxyl and the carbonyl functionalities within the same molecule. To investigate the hydrophobicity of the compounds that was necessary for binding, we also prepared one additional hydrophilic derivative and compared its binding properties with that of the long chain hydrophobic compounds. Because it is unclear how C1 domain interacts with the membrane, hydrophobic interactions are difficult to model. We therefore prepared derivatives having different side chains in order to investigate the length and shape of the alkyl chains required for binding with the C1B subdomain of PKC. The crystal structure of the ligand bound C1B domain of PKCδ, a novel PKC is known. Therefore we limited our study only to the C1B domain of novel PKCs.
2.1. Curcumin and its derivatives
We synthesized the long chain derivatives of curcumin because of the fact that the physiological PKC activator diacylglycerol contains two oleoyl long chains. The synthesis of the derivatives of curcumin (Fig. 1) was started from curcumin (1), which was obtained by recrystallization of commercially available (purity 75-80%) curcumin (Aldrich, Inc).
Fig.1.
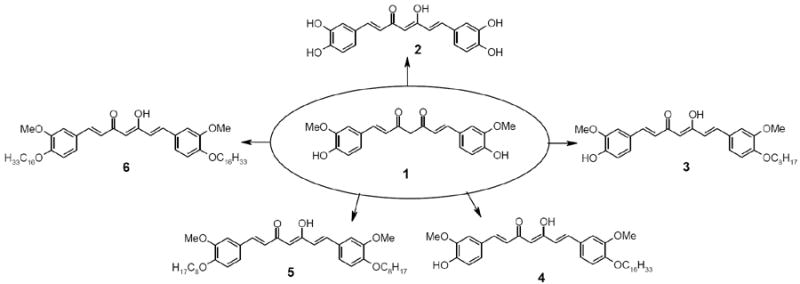
Curcumin (1) and its analogues (2-6).
Curcumin (1), possesses two phenolic OH groups and an α,β-unsaturated-β-diketone moiety in its chemical structure. The β-diketone structure can undergo keto-enol tautomerism in solutions.42,43 The relative contributions of the keto and enolic tautomers depend on several factors such as solvent characteristics, temperature and substitution on curcumin. In general, many of the diketones exist in solutions predominantly in the enolic form at room temperature.42,44 The enolic form can exist in different cis and trans isomeric forms depending on the temperature, polarity or hydrogen bonding nature of the solvents.45,46 The cis-enolic form should be energetically more stable because of strong intramolecular hydrogen bonding. In the present studies, all compounds were found to exist in the enol form because of its higher thermodynamic stability.
2.2. Spectral characteristics
Curcumin is poorly soluble in water and shows differential solubility in several organic solvents. Its solubility is high in polar organic solvents but it is only sparingly soluble in aliphatic organic solvents like hexane. Absorption maxima of curcumin (1) was solvent dependent and large red shift was observed in more polar solvents, e.g. the maxima are 404 nm and 427 nm in hexane and methanol, respectively (Table 1). Demethylated compound (2) also showed red shift in ethanol (432 nm) and water (426 nm) compared to hexane (406 nm). The same trend was observed for the long chain derivatives 3-6. Addition of long chain to cucumin did not show any major changes in the absorption maxima in acetonitrile and hexane. In ethanol and water, however addition of a single chain shifted the absorption maxima towards blue as compared to curcumin. Addition of the second chain blue shifted the absorption maxima further (Table 1). Fig. 2A shows the absorption spectra of curcumin derivative 4 recorded in different solvents. A strong and intense absorption band was observed in the 350–450 nm wavelength regions. The largest red shifts were observed in polar solvents capable of forming hydrogen bond. In non-polar solvents, as proposed for simple β- diketones, curcumin may exist in keto–enol equilibrium. The enol forms are most soluble in polar solvent than non polar solvent, and its contribution may result in blue shifted absorption maxima. The presence of long aliphatic chains can make the environment more non polar. Therefore, with increasing the number of the hexadecyl aliphatic chain in curcumin, absorption maxima shifted more towards blue. The extinction coefficient of curcumin47,48 and its derivatives in most of these solvents is in the range ~19,900–66,060 M−1 cm−1 (Table 1). Addition of two chains decreased the solubility of curcumin drastically. Therefore, determination of the extinction coefficient was not possible for 5 and 6.
Table 1.
Absorptiona and fluorescenceb properties of curcumin and its derivatives in different solvent at 25°C.
| Compound | Absorbance maximum (λabs), nm | Emission maximum (λem), nm | ||||||
|---|---|---|---|---|---|---|---|---|
| EtOH | CH3CN | Hexane | Water | EtOH | CH3CN | Hexane | Water | |
| 1c | 427(61,864) | 417(66,060 | 404(65,136) | 425(23,800) | 560 | 518 | 474,449 | 572 |
| 2 | 432(51,818) | 416(55,109) | 406(35,700) | 426(31,082) | 540 | 525 | 494,470 | 560 |
| 3 | 421(46,227) | 417(51,482) | 408(54,745) | 405(22,245) | 542 | 519 | 473,445 | 581 |
| 4 | 421(44,855) | 417(48,055) | 409(53,427) | 389(19,900) | 543 | 535 | 472,443 | 590 |
| 5d | 419(ND) | 419(ND) | 408(ND) | 406(ND) | 539 | 522 | 474,445 | 512 |
| 6d | 418(ND) | 419(ND) | 408(ND) | 280,318(ND) | 544 | 536 | 476,446 | 514 |
Conc., 2×10⁻⁶ M. Molar extinction coefficient values in M-1cm-1 are in parenthesis.
Conc., 10×10-6 M in water and 2×10⁻⁶ M in other solvents.
Extinction coefficient not determined due to of poor solubility.
ND, not determined
Fig. 2.
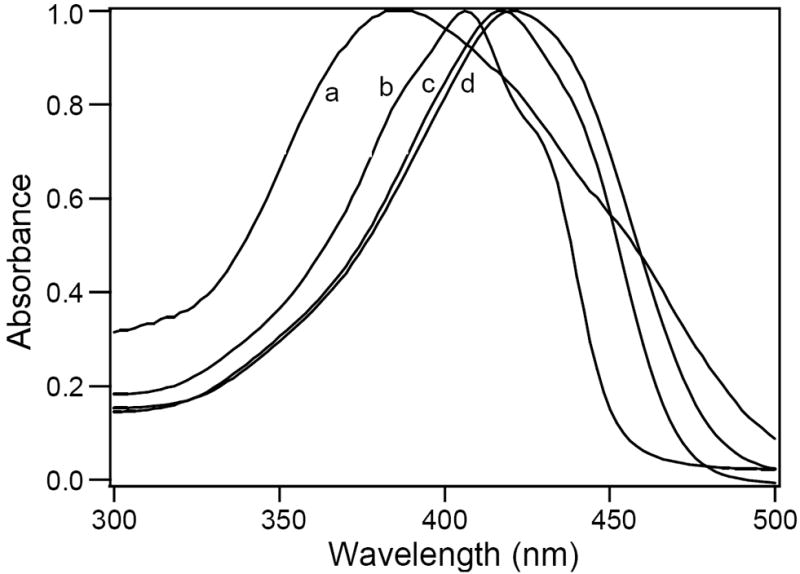
A) Effect of solvent polarity on the absorption properties of curcumin and its derivatives. Normalized absorption spectra of (1E, 4Z, 6E)-7-(4-(hexadecyloxy)-3-methoxyphenyl)-5-hydroxy-1-(4-hydroxy-3-methoxyphenyl)hepta-1, 4, 6-trien-3-one (4), 2×10⁻⁶ M in a) water, b) hexane, c) acetonitrile and d) ethanol.
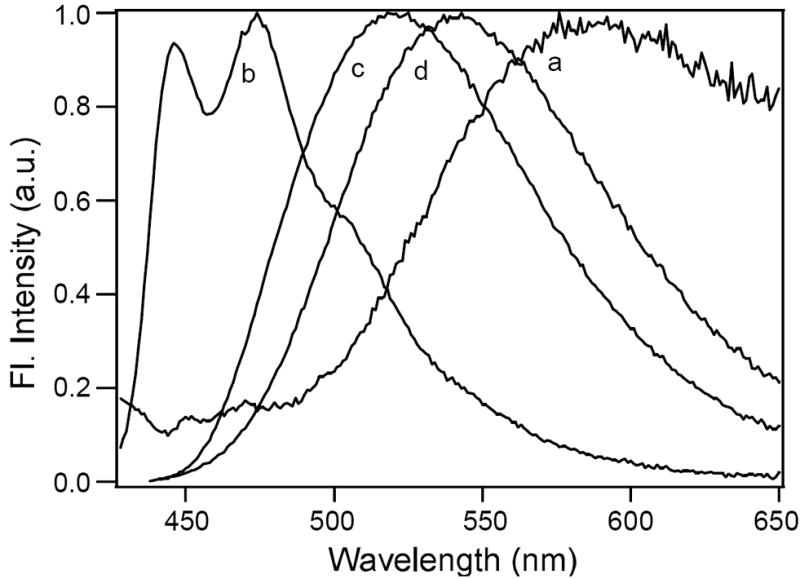
B) Effect of solvent on the emission properties of curcumin and its derivatives. Normalized fluorescence emission spectra of (1E, 4Z, 6E)-7-(4-(hexadecyloxy)-3-methoxyphenyl)-5-hydroxy-1-(4-hydroxy-3-methoxyphenyl)hepta-1, 4, 6-trien-3-one (4) in a) water, b) hexane, c) acetonitrile and d) ethanol. The concentration of 4 is 10×10-6 M in water and 2×10⁻⁶ M in other solvents.
The curcumin and its derivatives also showed significant solvent-dependent shifts in their fluorescence emission maxima (Table 1). The emission spectra of curcumin and its derivatives (1-6) in hexane were significantly different from other solvents showing two fluorescence maxima at 449 nm and 474 nm. In hexane, for compounds with single or double chains, there was not much difference in the absorption spectra. In aprotic solvents like acetonitrile, curcumin and its derivatives showed emission maxima in the region of 518–536 nm. In these solvents, the polarity affected the intramolecular hydrogen bonding. In polar solvents like alcohols, addition of long chain derivatives showed blue shifted emission maxima from 560 nm to 539-544 nm. These solvents, due to intermolecular hydrogen bonding, may induce change in conformations and thereby shifting the emission maxima towards blue. Thus the solvent dependent fluorescence spectral shifts confirmed that the photo-excitation of curcumin and its derivatives were influenced both by the intramolecular and intermolecular proton transfer reactions. In water, curcumin and its derivative showed much lower fluorescence intensity compared to the organic solvents indicating lower quantum yields in water. Emission spectra were also very broad in water. Fig. 2B represents the emission spectra of 4 in different solvents. The fluorescence maximum red shifted from 472 nm and 443 nm in hexane to 590 nm in water. For compounds 3 and 4, the emission maxima followed the order: water > ethanol > acetonitrile > hexane. Addition of a second chain showed large blue shift in the emission maxima at 512 nm and 514 nm in compounds 5 and 6 respectively and followed the order: ethanol > acetonitrile > hexane > water.
2.3. Binding of curcumin and its derivatives with PKC C1B
To determine the binding affinity of curcumin and its derivatives with the PKC C1B subdomain, we used fluorescence quenching technique and measured the EC50 for each of the compounds. The results were compared with the values obtained for known PKC activator diacylglycerol (DAG) such as 1,2-dioleoyl-sn-glycerol (DiC18) and 1,2-dioctanoyl-sn-glycerol (DiC8) and phorbol ester such as 12-O-tetradecanoylphorbol-13-acetate (TPA).18,19,49 Curcumin and its derivatives quench the protein intrinsic fluorescence in a concentration dependent manner similar to those of DAG and phorbol esters. The intrinsic fluorescence of the PKC C1B subdomains is due to the presence of a single tryptophan (Trp-252 in delta, Trp-264 in epsilon and Trp-253 in theta) and tyrosine residues (Tyr-236 and Tyr-238 in delta, Tyr-250 in epsilon and Tyr-249 and Tyr-251 in theta). Fig. 3 shows the plot of fluorescence quenching data for PKCδ C1B in the presence of different concentrations of 1, 4, and TPA. The EC50 values determined by fitting the fluorescence data using Hill equation are shown in Table 2. Among all the compounds studied, TPA was found to bind to the C1B subdomain with highest affinity having the EC50 in the range of 3-6 μM. Among the three PKC subtypes, the binding affinity was slightly higher for the PKCθ C1B as compared to the PKCδ C1B and PKCε C1B. For all the proteins, binding affinity for curcumin was less compared to TPA. This can be explained by inspecting the molecular model of the ligand bound protein that showed there were five possible hydrogen bonds between phorbol 13-OAc and PKCδ C1B, on the contrary, only two hydrogen bonds were possible for curcumin (Fig.5). Addition of the long chain to the curcumin moiety improved its affinity for the delta and theta. Both curcumin (1) and its long chain derivative (4) showed two possible hydrogen bonds and the C score of 2 when docked into delta (Fig 5, Table 5). In theta, however, there was an additional hydrogen bond, although the C score value was 5 for both. No significant difference was observed for 3 having eight carbon chains and 4 having sixteen carbon chains. Demethylated compound 2 showed improved binding with theta and epsilon as compared to delta. For epsilon and theta, the long chain derivative 4 showed comparable binding to that of DiC8, but showed higher binding than that of DiC18. On the other hand, in delta, it showed comparable binding to that of DiC18, but showed lowed binding than that of DiC8.
Fig. 3.
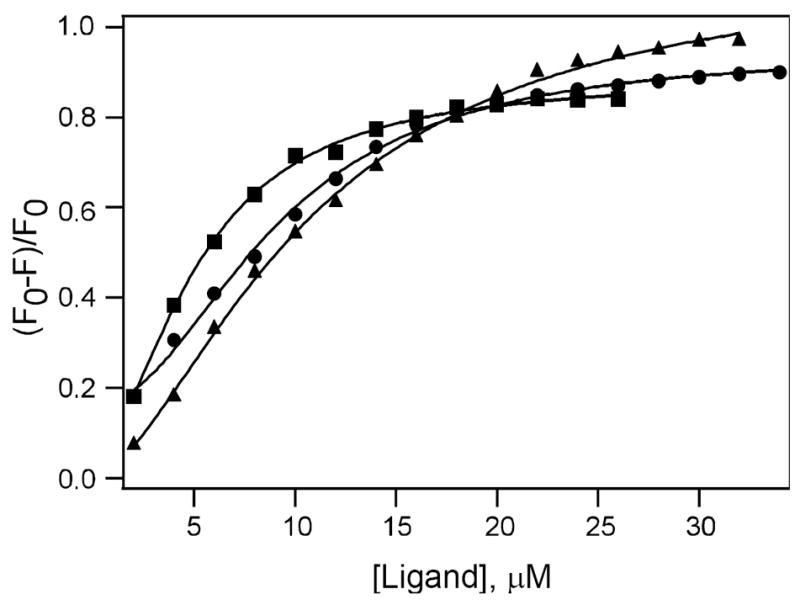
Binding of curcumin and its derivatives with PKCδ C1B. Plot of fluorescence intensity of PKCδ C1B (2 μM) in buffer (50 mM Tris, 150 mM NaCl, 2 mM DTT, 50 μM ZnSO4, pH = 7.2) in the presence of varying concentration of 1 (filled triangle), 4 (filled circle), and TPA (filled square), where F and F0 are fluorescence intensity in the presence and absence of the ligand, respectively. Solid lines indicate the fit using Hill equation. The corresponding EC50 of 1, 4 and TPA are 10.6, 8.9 and 5.1 μM and corresponding Hill coefficients are 1.6, 2 and 1.8 respectively. Excitation wavelength used was 280 nm.
Table 2.
EC50 values for the binding of curcumin and its derivatives and PKC activators with the C1Ba subdomains of PKCε, PKCδ and PKCθ measured by fluorescence quenching.
| Compound | EC50, μM | ||
|---|---|---|---|
| Delta (δ) | Epsilon (ε) | Theta (θ) | |
| 1 | 10.67 ± 0.35 | 8.81 ± 0.21 | 11.08± 0.76 |
| 2 | 12.50 ± 0.22 | 11.14 ± 0.21 | 6.57 ± 0.71 |
| 3 | 8.69 ± 0.22 | 9.79 + 0.20 | 4.00 + 0.0 |
| 4 | 8.98 ± 0.25 | 10.64 + 0.31 | 5.95 ± 0.21 |
| TPA | 5.17 ± 0.28 | 5.56 + 0.11 | 3.19 ± 0.56 |
| DiC8 | 16.15 | 8.19 + 0.30 | 5.24 ± 0.51 |
| DiC18 | 7.49 ± 0.59 | 14.27 + 0.77 | 8.67 ± 2.13 |
Protein concentration is 2 μM in buffer (50 mM Tris, 150 mM NaCl, 2 mM DTT, 50 μM ZnSO4, pH = 7.2).
Fig. 5.
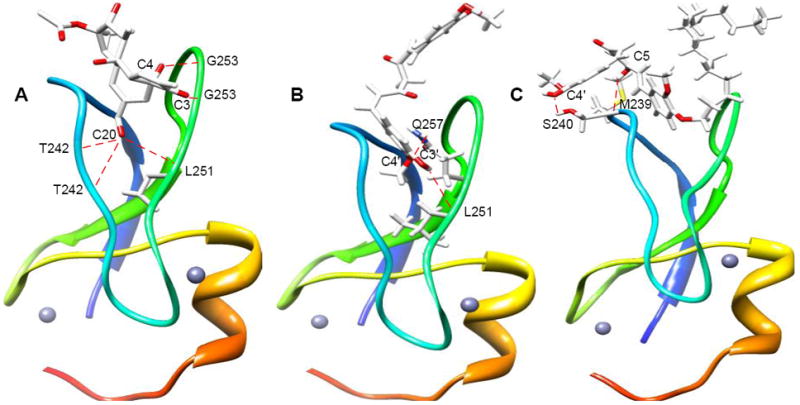
Structures of ligand bound PKC δC1B. A) Crystal structure of phorbol 13-O-acetate bound PKCδ C1B; B) modeled structure of curcumin (1) docked into PKCδ C1B; C) modeled structure of long chain curcumin derivative (4) docked into PKCδ C1B. The modeled structures are generated using the autodock module of Sybyl 7.3. The oxygen atoms in the ligand structures are shown in red. The dotted line indicates possible hydrogen bonds, small spheres indicate Zn atoms.
Table 5.
C score values obtained from the docking of curcumin (1) and its derivatives (2-4), TPA, DiC8 and DiC18 into the PKC C1B domains using Surflex dock module of Sybyl 7.3.
| Compound | δ C1B | ε C1B | θ C1B |
|---|---|---|---|
| 1 | 2 | 4 | 5 |
| 2 | 3 | 5 | 5 |
| 3 | 4 | 4 | 3 |
| 4 | 2 | 4 | 5 |
| Phorbol-13-OAc | 3 | 2 | 3 |
| DiC8 | 2 | 4 | 5 |
| DiC18 | 3 | 2 | 3 |
To further investigate the binding of curcumin (1) and its long chain derivative (4) with the PKC C1B subdomains, the effect of proteins on their emission maxima and fluorescence anisotropies were studied and compared with the fluorescent PKC activator sapintoxin-D (SAPD). In the presence of 10-fold excess each of the PKC C1B subdomains, the emission maxima of 1 and 4 were blue shifted. The emission maximum of 1 shifted from 572 nm in buffer to 559 nm in the presence of PKCδ C1B, and for 4 it shifted from 590 nm in buffer to 560 nm. SAPD also showed blue shift from 442 nm in buffer to 423 nm in the presence of the C1B subdomain. Emission maxima of curcumin 1 and its derivative 4 also were blue shifted in the presence of epsilon and theta (Fig. 4, Table 3). Among the three compounds studied, 4 showed largest blue shift of 30 nm indicating strongest interaction amongst the three. These observations indicated that addition of long chain improved the binding affinity.
Fig. 4.
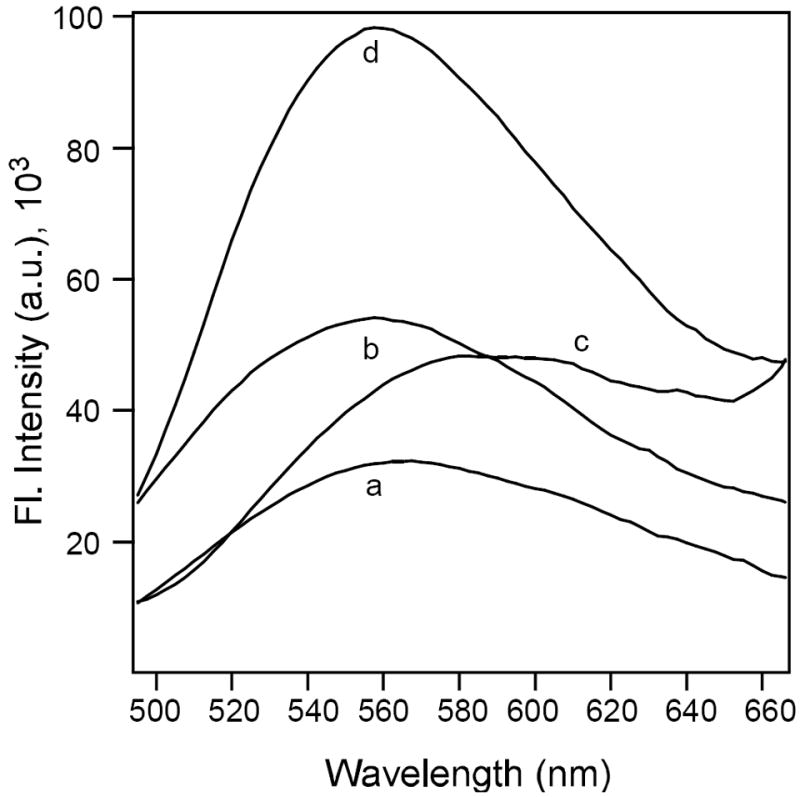
Blue shift in emission maxima of 1 and 4 (5×10⁻⁶ M) in the presence of PKCδ C1B (50×10-6 M). Emission maximum of a) 1 in buffer, b) 1 in the presence of PKCδ C1B, c) 4 in buffer, d) 4 in the presence of PKCδ C1B. Buffer used, 50 mM Tris, 150 mM NaCl, 2 mM DTT, 50 μM ZnSO4, pH = 7.2.
Table 3.
Emmison maxima (λem in nm) of 1, 4 and SAPD in the presence of PKC C1B domains
1 & 4, 5×10⁻⁶ M and protein, 50×10-6 M;
SAPD, 0.5×10⁻⁶ M and protein, 5×10⁻⁶ M;
Spectra were recorded after incubating the compound for 1 hr at 25°C.
Further, the observation that the fluorescence anisotropy values of 1 and 4 increased in the presence of proteins supported that 1 and 4 bind to the proteins. For 1, anisotropy changed from 0.3994 in buffer to 0.4341 in PKCε C1B, 0.4501 in PKCδ C1B and 0.4407 in PKCθ C1B respectively, whereas for 4, the changes were from 0.2638 in buffer to 0.3355 in PKCε C1B, 0.3117 in PKCδ C1B and 0.3206 in PKCθ C1B (Table 4). In the presence of 10-fold excess of proteins, the anisotropy value of SAPD increased from 0.072 in buffer to 0.1142 in PKCε C1B, 0.1051in PKCδ C1B and 0.1163 in PKCθ C1B. Although the value of anisotropy and the magnitude of the increment were different for the curumin and its derivatives and SAPD, this experiment clearly showed that in the presence of the proteins the curcumin and its derivatives experienced restricted motion in the protein environment by binding to it in a manner similar to that of SAPD. Similar increase in anisotropy of curcumin was observed when it bound to serum albumins. 47,50
Table 4.
Anisotropy valuesa of 1, 4 and SAPD in the presence and absence of the C1B domain of PKCε, PKCδ and PKCθ at 25°C
| Compound | Bufferc | δ C1B | ε C1B | θ C1B |
|---|---|---|---|---|
| 1b | 0.3994(0.0066) | 0.4501(0.0068) | 0.4341(0.0044) | 0.4407(0.0072) |
| 4b | 0.2638(0.0060) | 0.3117(0.0056) | 0.3355(0.0077) | 0.3206(0.0072) |
| SAPDc | 0.0720(0.0018) | 0.1051(0.0014) | 0.1142(0.0024) | 0.1163(0.0033) |
Values in the parenthesis indicate standard deviations.
1 and 4, 5×10⁻⁶ M; protein, 50×10-6 M in buffer (50 mM Tris, 150 mM NaCl, 2 mM DTT, 50 μM ZnSO4, pH = 7.2). Incubation was done for 30 min at 25°C.
SAPD, 0.5×10⁻⁶ M; protein, 5×10⁻⁶ M in the same buffer.
Usually the dissociation constants (Kd) for the PKC and its ligands are determined using radioactive phorbol ester binding assays in presence of membrane.51 In this case however, we used a lipid free system that also showed the binding of the ligands. Although the binding constant values are expected to be different in the presence of lipid, our fluorescence binding assay clearly indicate that curcumin and its derivatives can bind to the C1 domain of PKC. These results further indicated that curcumin derivatives interact differently with the three different PKCs and suitably modified curcumin derivative could bind to the C1 domain and modulate PKC enzymes specifically.
In the crystal structure19 of phorbol ester (phorbol-13-O-acetate) bound PKCδ C1B, the hydroxyl groups attached to C20 and C4 and the carbonyl group on C3 formed hydrogen bonds with the protein residues. Phorbol ester hydroxyl group (C-20) was hydrogen bonded to the backbone amide proton of Thr-242 and the carbonyls of Thr-242 and Leu-251. The C3 carbonyl group formed hydrogen bond with the backbone amide proton of Gly-253. Another hydrogen bond was observed with C-4 hydroxyl group with the backbone carbonyl of Gly-253 (Fig. 5A). We conducted molecular docking experiments to verify if the phorbol ester-like hydrohen bonding with protein residues was feasible for curcumin and its derivatives. Our docked model with δC1B domain showed that hydroxyl group of 1 is hydrogen bonded to the carbonyl of backbone Leu-251. Another hydrogen bond was observed between –OMe of 1 and amide proton of Gln-257 (Fig. 5B). Docked model of 4 with δC1B domain showed hydrogen bond between hydroxyl group of 4 and backbone hydroxyl of Ser-240. Another hydrogen bond was observed between the enol of 4 and backbone carbonyl of Met-239 (Fig. 5C). Molecular docking of curcumin and its derivatives into the PKC C1B subdomains was carried out using Surflex dock module of Sybyl 7.3. The C score values are presented in Table 5, where higher C score value indicates higher binding. When phorbol 13-OAc was docked into the unliganded PKCδC1B, four hydrogen bonds were observed with a C score value of 3, in contrast to five hydrogen in the crystal structure (Table 5). The observation that the C score values obtained from the models do not always corroborate with the experimental binding data indicate the fact that both the proteins and ligands can undergo conformational changes in solutions.
3. Conclusion
We described here the synthesis, spectral properties and binding of curcumin and its derivatives to the C1B subdomains of novel protein kinase C. Our results showed that curcumin and its long chain derivatives can bind to the activator-binding domain of PKC by forming hydrogen bonds with the residues at the activator binding site. Our results also indicated that curcumin and its derivatives can influence PKC activation and its membrame translocation properties differently depending on the nature of the PKC subtype. In contrast to phorbol esters, which are tumorogenic, curcumin is non toxic and has anticancer properties. Therefore, development of suitable curcumin derivative as target for specific PKC isozyme has high potential to be used as drug. On the basis of the results presented here, we are currently working towards improving the affinity and selectivity of the curcumin derivatives for the C1 domain containing proteins.
4. Experimental
4.1. General
Sapintoxin-D (SAPD) was purchased from LC Laboratories, Woburn, MA. Curcumin and TPA were from Sigma. 1,2-dioleoyl-sn-glycerol (DiC18), 1,2-dioctanoyl-sn-glycerol (DiC8) were purchased from Avanti Polar Lipids. Solvents were purchased from VWR and Fisher. All other reagents were purchased from Sigma-Aldrich and used without further purification. Progress of chemical reaction was monitored through thin layer chromatography (TLC) on pre-coated glass plates (silica gel 60 F254, 0.25mm thickness) purchased from EMD chemicals. 1H NMR and 13C NMR spectra were recorded on a GE QE-300 spectrometer. Unless otherwise specified, all NMR spectra were obtained in deuterated chloroform (CDCl3) and referenced to the residual solvent peak; chemical shifts were reported in parts per million (ppm), and coupling constants in hertz (Hz). Multiplicities were reported as follows: s (singlet), d (doublet), t (triplet), m (multiplet) and br (broadened). Mass spectra were obtained on either a VG 70-S Nier Johnson or JEOL Mass Spectrometer. Absorption spectra were recorded on Hitachi U-2910 spectrophotometer and fluorescence spectra were recorded on PTI LPS 220B.
4.2. General procedure for preparation of 2
Under nitrogen atmosphere, a suspension of curcumin (368 mg, 1 mmol) in 15 mL of anhydrous dichloromethane was cooled to -78°C using a dry ice/acetone bath. To this stirred suspension was added 0.57 mL (6 eqiuv.) boron tribromide. After 20 minutes the cooling bath was removed and solution was left to stir for 5 h. The reaction mixture was then carefully poured into saturated sodium bicarbonate solution with stirring. Water and dichloromethane layers were separated and the water layer was extracted twice with diethyl ether. The dichloromethane layer was removed by rotary evaporator and the resulting solid redissolved in diethyl ether. The combined ether layer was washed with water until the extracts were neutral and dried over anhydrous sodium sulfate. After filtration, the diethyl ether was removed under reduced pressure using a rotary evaporator. The compound was purified by column chromatography (Hexane: EtOAc: MeOH; 60:38:2 %).
2. (1E, 4Z, 6E)-1,7-bis(3, 4-dihydroxyphenyl)-5-hydroxyhepta-1, 4, 6-trien-3-one
Yield 80%; 1H NMR (CD3OD): δ 7.58 (2H, d, J = 16.5 Hz), 7.23 (2H, d, J = 2.0 Hz), 7.12 (2H, dd, J = 8.0, 2.0 Hz), 6.92 (2H, d, J = 8.0 Hz), 6.65 (2H, d, J = 16.5 Hz), 6.02 (1H, s); ESI-MS m/z 341 [M+H]+.
4.3. General procedure for preparation of compound 3, 4, 5 and 6
Bromooctane (1 equiv for 3 and 2 equiv for 5) or bromohexadecane (1 equiv for 4 and 2 equiv for 6) were added to a stirred solution of curcumin (368 mg, 1mmol) and K2CO3 (1 equiv for 3 and 4 and 2 equiv. for 5 and 6) in dry acetone (10 ml) and the mixture was refluxed for 24 h. After cooling the mixture to room temperature and filtering, solvent was removed in vacuo. The resulting residue was subjected to column chromatography (n-hexane-EtOAc) to purify the corresponding products.
3. (1E, 4Z, 6E)-5-hydroxy-1-(4-hydroxy-3-methoxyphenyl)-7-(3-methoxy-4-(octyloxy)phenyl)hepta-1, 4, 6-trien-3-one
Yield 56%; 1H NMR (CDCl3): δ 7.65 (2H, d, J = 16.2 Hz), 7.20 (2H, dd, J = 8.2, 2.0 Hz), 7.15 (1H, dd, J = 8.2, 2.0 Hz), 7.12(1H, d, J = 2.0 Hz), 7.00 (1H, d, J = 8.2 Hz), 6.94 (1H, d, J = 8.2 Hz), 6.59 (1H, d, J = 16.2 Hz), 6.54 (1H, d, J = 16.2 Hz), 5.80 (1H, s), 5.88 (1H, br), 4.04 (2H, t, J = 7.0 Hz), 3.93 (3H, s), 3.91 (3H, s), 1.85 (2H, m), 1.23-1.45 (10H, m), 0.88 (3H, t, J = 6.0 Hz); 13C NMR (CDCl3): δ 183.3, 183.2, 150.7, 149.4, 146.7, 140.5, 140.4, 127.7, 122.8, 122.6, 121.7, 114.8, 112.3, 110.1, 109.5, 101.2, 69.0, 56.0, 55.9, 31.7, 29.3, 29.1, 29.0, 25.9, 22.64, 14.0; ESI-MS m/z 481 [M+H]+.
4. (1E, 4Z, 6E)-7-(4-(hexadecyloxy)-3-methoxyphenyl)-5-hydroxy-1-(4-hydroxy-3-methoxyphenyl)hepta-1, 4, 6-trien-3-one
Yield 49%; 1H NMR (CDCL3): δ 7.59 (2H, d, J = 16.0 Hz), 7.12 (2H, dd, J = 8.0, 2.0 Hz), 7.09 (1H, dd, J = 8.0, 2.0 Hz), 7.04 (1H, d, J = 2.0 Hz), 6.94 (1H, d, J = 8.0 Hz), 6.84 (1H, d, J = 8.0 Hz), 6.50 (1H, d, J = 16.2 Hz), 6.45 (1H, d, J = 16.2 Hz), 5.84 (1H, brs), 5.79 (1H, s), 4.03 (2H, t, J = 7.1 Hz), 3.93 (3H, s), 3.90 (3H, s), 1.84 (2H, m), 1.24-1.44 (26H, m),0.86 (3H, t, J = 6.2 Hz); 13C NMR (CDCl3): δ 183.5, 183.3, 150.7, 149.4, 141.3, 140.5, 129.9, 129.2, 122.8, 122.6, 122.4, 121.7, 115.9, 114.7, 112.3, 110.3, 100.5, 69.0, 56.0, 53.1, 31.9, 29.6, 29.5, 29.3, 29.0, 25.9, 23.0, 22.6, 14.0; ESI-MS m/z 593 [M+H]+.
5. (1E, 4Z, 6E)-5-hydroxy-1,7-bis(3-methoxy-4-(octyloxy)phenyl)hepta-1,4,6-trien-3-one
Yield 52%; 1H NMR (CDCl3): δ 7.60 (2H, d, J = 15.6 Hz), 7.10 (2H, dd, J = 8.1, 1.8 Hz), 7.07 (2H, d, J = 1.8 Hz), 6.87 (2H, d, J = 8.1 Hz), 6.48 (2H, d, J = 15.6 Hz), 5.81 (1H, s), 4.05 (4H, t, J = 6.9 Hz), 3.91 (3H, s), 1.85 (4H, m), 1.25-1.49 (20H, m), 0.88 (6H, t, J = 6.3 Hz); 13C NMR (CDCl3): δ 183.2 (2), 150.69, 149.4, 140.45, 127.8, 122.6, 121.8, 112.3, 110.1, 101.2, 69.0, 56.0 (2), 34.2, 31.7, 29.3, 29.1, 29.0, 25.9, 22.6, 14.0; ESI-MS m/z 593 [M+H]+.
6. (1E, 4Z, 6E)-1,7-bis(4-(hexadecyloxy)-3-methoxyphenyl)-5-hydroxyhepta-1,4,6-trien-3-one
Yield 59%; 1H NMR (CDCl3): δ 7.60 (2H, d, J = 15.6 Hz), 7.12 (2H, dd, J = 8.1, 1.8 Hz), 7.07 (2H, d, J = 1.8 Hz), 6.87 (2H, d, J = 8.1 Hz), 6.48 (2H, d, J = 15.6 Hz), 5.81 (1H, s), 4.04 (4H, t, J = 6.9 Hz), 3.91 (6H, s), 1.85 (4H, m), 1.23-1.41 (52H, m), 0.87(3H, t, J = 6.3 Hz); 13C NMR (CDCl3): δ 183.2 (2), 150.6, 149.4, 140.4, 127.8, 122.6, 121.8, 112.3, 110.1, 101.3, 69.0, 55.9 (2), 31.9, 29.6 (2), 29.5(2), 29.4, 29.3, 29.0, 25.9, 22.6, 21.0, 14.1; ESI-MS m/z 816 [M]+.
4.4. Bacterial expression and purification of the PKC εC1B, δC1B and θC1B subdomains
The PKC C1B subdomains fused with glutathione S-transferase (GST) were expressed in BL21(DE3) gold E. coli and purified as described earlier.16 Briefly, cell pellets were treated with 1% Triton X-100 and lysozyme (1 mg/ml), followed by sonication and centrifugation. The clarified supernatant was then applied to a glutathione-Sepharose column. The bound protein was thoroughly washed with phosphate buffer saline, released by thrombin cleavage, eluted with phosphate-buffered saline, and concentrated by ammonium sulfate precipitation (80%). Proteins were further purified by fast performance liquid chromatography (Akta Purifier) using a Superdex™ 75 column (GE Healthcare Biosciences), a mobile phase of 50 mm Tris, 100 mm NaCl, pH 7.2, and a flow rate of 0.5 ml/min.
4.5. Fluorescence studies
Fluoresence spectra were recorded on PTI LPS 220B equipped with temperature and stirring control systems. A 1.5-ml cuvette (Hellma) with a Teflon stopper was used for fluorescence measurements. For fluorescence quenching experiments, protein (2μM) and varying concentration of ligands (2-34 μM) were incubated in a buffer solution (50 mM Tris, 150 mM NaCl, 2 mM DTT, 50 μM ZnSO4, pH = 7.2) at 25°C. Protein was excited at 280 nm and emission spectra were recorded from 300 nm to 650 nm. Fluorescence intensity data, (F0-F)/F were plotted against the ligand concentration to generate the binding curves, where F and F0 represented the fluorescence intensity at 350 nm in the presence and in the absence of ligand respectively. For EC50 measurement, all curves were fitted with the Hill equation using Igor Pro 4. Effect of proteins on the emission maxima of the compounds was measured by using 5 μM each of 1 and 4 with 50 μM protein and for phorbol ester, 0.5 μM SAPD and 5 μM protein in buffer (50 mM Tris, 150 mM NaCl, 2 mM DTT, 50 μM ZnSO4, pH = 7.2). 1, 4 and SAPD were incubated with the proteins for 1h and excited at 425 nm, 389 nm and 355 nm respectively. The wavelength maxima of the emission spectra were determined by fitting the symmetrical top of the spectra to a Gaussian function with Igor Pro 4 (WaveMetrics, Inc., Lake Oswego, OR).
Fluorescence anisotropy was measured in the same fluorimeter using parallel and perpendicular polarizers. The steady-state anisotropy, (r), is defined as
where III and IA are the polarized fluorescence intensities in the directions parallel and perpendicular, respectively, to the excitation polarization.
4.6. Generation of 3D models of PKC C1B subdomains and molecular docking
Three-dimensional structures of curcumin and its derivatives were generated using ChemDraw Ultra 7.0 and Cactus, a web based program (http://cactus.nci.nih.gov/services/translate/). The structures were subjected to pre-dock energy minimization using another free web application (http://bioserv.rpbs.jussieu.fr/cgi-bin/Frog).
The crystal structures of PKCδ (PDB code: 1PTQ), and the phorbol-13-OAc bound PKCδ (PDB code: 1PTR).19 NMR structure of the PKC theta C1B (PDB code: 2ENZ)52 and a homology modeled structure of PKCε C1B have been used as the receptors for molecular docking studies. The average structure from the combined 20 structures for the PKCθC1B was selected using INSIGHT II.
Homology model for PKCεC1B has been generated using UNIPROT (http://www.uniprot.org/) and Expasy SWISS Model workspace (http://swissmodel.expasy.org/workspace/), the web based tools for the automatic homology model generation. PKCθ C1B (PDB code: 2ENZ) has nearly 66% sequence homology with PKCεC1B and thus used as a template. Energy minimization (-1741.670 KJ/mol) was done using the same program. The model was validated using VERIFY3D and all the amino acids residues had an acceptable score above zero. The model space analysis for PKCεC1B was done using the Ramachandran Plot (http://dicsoft1.physics.iisc.ernet.in/rp/index.html). The plot indicated that 100% residues were within the allowed region (52.08% in the Fully Allowed Region (FAR), 35.42% in the Additional Allowed Region (AAR) and 12.50% were in the Generously Allowed Region (GAR)) thereby, validating the model.
Molecular docking was performed on Surflex module of Sybyl 7.3 using Threshold-0.5, Bloat-2.0 and Radius-3 Å for the protomol generation. Residues Tyr-239, Lys-240, Ser-241, Pro-242, Thr-243, Phe-244, Leu-251, Leu-252, Trp-253, Gly-254, Leu-255 and Glu-258 of PKC theta; Tyr-238, Met-239, Ser-240, Pro-241, Thr-242, Phe-243, Leu-250, Leu-251, Trp-252, Gly-253, Leu-254 and Gln-257 for PKC delta and Tyr-250, Lys-251, Val-252, pro-253, Thr-254, Phe-255, Leu-262, Leu-263, Trp-264, Gly-265, Leu-266 and Gln-269 for PKC epsilon were used. These residues were selected by comparing the PKC activator phorbol ester binding site in PKC delta C1B.53 Ring flexibility and Post Dock energy minimization were applied on each structure. Higher C-score values represent better fitting.
Acknowledgments
This research has been supported by the National Institutes of Health grant G096452. Molecular docking studies were performed at the Center for Experimental Therapeutics and Pharmaco Informatics at the College of Pharmacy, University of Houston.
Footnotes
Publisher's Disclaimer: This is a PDF file of an unedited manuscript that has been accepted for publication. As a service to our customers we are providing this early version of the manuscript. The manuscript will undergo copyediting, typesetting, and review of the resulting proof before it is published in its final citable form. Please note that during the production process errors may be discovered which could affect the content, and all legal disclaimers that apply to the journal pertain.
References and notes
- 1.Battaini F, Mochly-Rosen D. Pharmacol Res. 2007;55:461. doi: 10.1016/j.phrs.2007.05.005. [DOI] [PMC free article] [PubMed] [Google Scholar]
- 2.Koivunen J, Aaltonen V, Peltonen J. Cancer Lett. 2006;235:1. doi: 10.1016/j.canlet.2005.03.033. [DOI] [PubMed] [Google Scholar]
- 3.Griner EM, Kazanietz MG. Nat Rev Cancer. 2007;7:281. doi: 10.1038/nrc2110. [DOI] [PubMed] [Google Scholar]
- 4.Evcimen N, King GL. Pharmacol Res. 2007;55:498. doi: 10.1016/j.phrs.2007.04.016. [DOI] [PubMed] [Google Scholar]
- 5.Bright R, Mochly-Rosen D. Stroke. 2005;36:2781. doi: 10.1161/01.STR.0000189996.71237.f7. [DOI] [PubMed] [Google Scholar]
- 6.Chou WH, Messing RO. Trends Cardiovasc Med. 2005;15:47. doi: 10.1016/j.tcm.2005.01.003. [DOI] [PubMed] [Google Scholar]
- 7.Sabri A, Steinberg SF. Mol Cell Biochem. 2003;251:97. [PubMed] [Google Scholar]
- 8.Alkon DL, Sun MK, Nelson TJ. Trends Pharmacol Sci. 2007;28:51. doi: 10.1016/j.tips.2006.12.002. [DOI] [PubMed] [Google Scholar]
- 9.Hofmann J. Curr Cancer Drug Targets. 2004;4:125. doi: 10.2174/1568009043481579. [DOI] [PubMed] [Google Scholar]
- 10.Newton AC. Chem Rev. 2001;101:2353. doi: 10.1021/cr0002801. [DOI] [PubMed] [Google Scholar]
- 11.Nishizuka Y. Science. 1992;258:607. doi: 10.1126/science.1411571. [DOI] [PubMed] [Google Scholar]
- 12.Colon-Gonzalez F, Kazanietz MG. Biochim Biophys Acta. 2006;1761:827. doi: 10.1016/j.bbalip.2006.05.001. [DOI] [PubMed] [Google Scholar]
- 13.Yang C, Kazanietz MG. Trends Pharmacol Sci. 2003;24:602. doi: 10.1016/j.tips.2003.09.003. [DOI] [PubMed] [Google Scholar]
- 14.Das J, Addona GH, Sandberg WS, Husain SS, Stehle T, Miller KW. J Biol Chem. 2004;279:37964. doi: 10.1074/jbc.M405137200. [DOI] [PubMed] [Google Scholar]
- 15.Das J, Zhou X, Miller KW. Protein Sci. 2006;15:2107. doi: 10.1110/ps.062237606. [DOI] [PMC free article] [PubMed] [Google Scholar]
- 16.Das J, Pany S, Rahman GM, Slater SJ. Biochem J. 2009;421:405. doi: 10.1042/BJ20082271. [DOI] [PubMed] [Google Scholar]
- 17.Blumberg PM, Kedei N, Lewin NE, Yang D, Czifra G, Pu Y, Peach ML, Marquez VE. Current Drug Targets. 2008;9:641. doi: 10.2174/138945008785132376. [DOI] [PMC free article] [PubMed] [Google Scholar]
- 18.Gennas GB, Talman V, Aitio O, Ekokoski E, Finel M, Tuominen RK, Yli-Kauhaluoma J. J Med Chem. 2009;52:3969. doi: 10.1021/jm900229p. and references cited therein
- 19.Zhang G, Kazanietz MG, Blumberg PM, Hurley JH. Cell. 1995;81:917. doi: 10.1016/0092-8674(95)90011-x. [DOI] [PubMed] [Google Scholar]
- 20.Irie K, Nakagawa Y, Ohigashi H. Chem Rec. 2005;5:185. doi: 10.1002/tcr.20044. [DOI] [PubMed] [Google Scholar]
- 21.Yanagita RC, Nakagawa Y, Yamanaka N, Kashiwagi K, Saito N, Irie K. J Med Chem. 2008;51:46–56. doi: 10.1021/jm0706719. [DOI] [PubMed] [Google Scholar]
- 22.Aggarwal BB, Sung B. Trends in Pharmacological Sciences. 2009;30:85. doi: 10.1016/j.tips.2008.11.002. [DOI] [PubMed] [Google Scholar]
- 23.Singh S. Cell. 2007;130:765. doi: 10.1016/j.cell.2007.08.024. [DOI] [PubMed] [Google Scholar]
- 24.Mehta K, Pantazis P, McQueen T, Aggarwal BB. Anti-Cancer Drugs. 1997;8:470. doi: 10.1097/00001813-199706000-00010. [DOI] [PubMed] [Google Scholar]
- 25.Kuo ML, Huang TS, Lin JK. Biochim Biophys Acta. 1996;1317:95. doi: 10.1016/s0925-4439(96)00032-4. [DOI] [PubMed] [Google Scholar]
- 26.Jee SH, Shen SC, Tseng CR, Chiu HC, Kuo ML. J Invest Dermatol. 1998;111:656. doi: 10.1046/j.1523-1747.1998.00352.x. [DOI] [PubMed] [Google Scholar]
- 27.Kawamori T, Lubet R, Steele VE, Kelloff GJ, Kaskey RB, Rao CV, Reddy BS. Cancer Res. 1999:597. [PubMed] [Google Scholar]
- 28.Singletary K, MacDonald C, Iovinelli M, Fisher C, Wallig M. Carcinogenesis. 1998;19:1039. doi: 10.1093/carcin/19.6.1039. [DOI] [PubMed] [Google Scholar]
- 29.Ruby AJ, Kuttan G, Babu KD, Rajasekeharan KN, Kuttan R. Cancer Lett. 1995;94:79. doi: 10.1016/0304-3835(95)03827-j. [DOI] [PubMed] [Google Scholar]
- 30.Kuttan R, Bhanumathy P, Nirmala K, George MC. Cancer Lett. 1985;29:197. doi: 10.1016/0304-3835(85)90159-4. [DOI] [PubMed] [Google Scholar]
- 31.Liu JY, Lin SJ, Lin JK. Carcinogenesis. 1993;14:857. doi: 10.1093/carcin/14.5.857. [DOI] [PubMed] [Google Scholar]
- 32.Hasmeda M, Polya GM. Phytochemistry. 1996;42:599. doi: 10.1016/0031-9422(96)00091-x. [DOI] [PubMed] [Google Scholar]
- 33.Zheng J, Ramirez VD. Br J Pharmacol. 2000;130:1115. doi: 10.1038/sj.bjp.0703397. [DOI] [PMC free article] [PubMed] [Google Scholar]
- 34.Logan-Smith ML, Lockyer PJ, East JM, Lee AG. J Biol Chem. 2001;276:46905. doi: 10.1074/jbc.M108778200. [DOI] [PubMed] [Google Scholar]
- 35.Sumbilla C, Lewis D, Hammerschmidt T, Inesi G. J Biol Chem. 2002;277:13900. doi: 10.1074/jbc.M111155200. [DOI] [PubMed] [Google Scholar]
- 36.Mahmmoud YA. Br J Pharmacol. 2005;145:236. doi: 10.1038/sj.bjp.0706185. [DOI] [PMC free article] [PubMed] [Google Scholar]
- 37.Singh S, Aggarwal BB. J Biol Chem. 1995;270:24995. doi: 10.1074/jbc.270.42.24995. [DOI] [PubMed] [Google Scholar]
- 38.Choi H, Chun Y-S, Kim S-W, Kim M-S, Park J-W. Mol Pharmacol. 2006;70:1664. doi: 10.1124/mol.106.025817. [DOI] [PubMed] [Google Scholar]
- 39.Lin JK, Chen YC, Huang YT, Lin-Shiau SY. J Cell Biochem. 1997;28-29:39. [PubMed] [Google Scholar]
- 40.Reddy S, Aggarwal BB. FEBS Lett. 1994;341:19. doi: 10.1016/0014-5793(94)80232-7. [DOI] [PubMed] [Google Scholar]
- 41.Garg R, Ramchandani AG, Maru GB. Carcinogenesis. 2008;29:1249. doi: 10.1093/carcin/bgn114. [DOI] [PubMed] [Google Scholar]
- 42.Markov P. In: The Chemistry of Enols. Rapport Z, editor. Wiley; Chichester: p. 69. [Google Scholar]
- 43.Claramunt RM, Lopez C, Maria MDS, Sanz D, Elguero J. Prog Nucl Magn Reson Spectrosc. 2006;49:169. [Google Scholar]
- 44.St Nikolov G, Markov P. J Photochem Photobiol A: Chem. 1981;16:93. [Google Scholar]
- 45.Arnaut LG, Formosinno SJ. J Photochem Photobiol A: Chem. 1993;75:1. [Google Scholar]
- 46.Arnaut LG, Formosinno SJ. J Photochem Photobiol A: Chem. 1993;75:21. [Google Scholar]
- 47.Barik A, Priyadarsini KI, Mohan H. Photochem and Photobiol. 2003;77:597. doi: 10.1562/0031-8655(2003)077<0597:psoboc>2.0.co;2. [DOI] [PubMed] [Google Scholar]
- 48.Priyadarsini KI. Journal of Photochemistry and Photobiology C: Photochemistry Reviews. 2009;10:81. [Google Scholar]
- 49.Marquez VE, Blumberg PM. Acc Chem Res. 2003;36:434. doi: 10.1021/ar020124b. and references cited therein
- 50.Moreno F, Cortijo M, Gonzalez-Jimenez J. Photochem and Photobiolo. 1999;69:8. [PubMed] [Google Scholar]
- 51.Nancy EL, Blumberg PM. In: Methods in Molecular Biology. Alexandra CN, editor. Vol. 233. p. 129. [Google Scholar]
- 52.Solution structure of the second C1 domain from human protein kinase C theta. Nagashima T, Hayashi F, Yokoyama S. To be published, PDB code: 2ENZ. [Google Scholar]
- 53.Quest AF, Bardes ES, Xie WQ, Willott E, Borchardt RA, Bell RM. Methods Enzymol. 1995;252:153. doi: 10.1016/0076-6879(95)52018-x. [DOI] [PubMed] [Google Scholar]