Abstract
A cataract is a clouding of the lens in the eye that affects vision. Phacoemulsification is the mostly common surgical method for treating cataracts, and determining that the optimal phacoemulsification energy is dependent on measuring the hardness of the lens. This study explored the use of an ultrasound needle transducer for invasive measurements of ultrasound attenuation coefficient to evaluate the hardness of the cataract lens. A 47 MHz high-frequency needle transducer with a diameter of 0.9 mm was fabricated by a polarized PMN-33%PT single crystal in the present study. The attenuation coefficients at different stages of an artificial porcine cataract lens were measured using the spectral shift approach. The hardness of the cataract lens was also evaluated by mechanical measurement of its elastic properties. The results demonstrated that the ultrasonic attenuation coefficient was increased from 0.048 ± 0.02 to 0.520 ± 0.06 dB mm−1 MHz−1 corresponding to an increase in Young’s modulus from 6 ± 0.4 to 96 ± 6.2 kPa as the cataract further developed. In order to evaluate the feasibility of combining needle transducer and phacoemulsification probe for real-time measurement during cataract surgery, the needle transducer was mounted on the phacoemulsification probe for a vibration test. The results indicated that there was no apparent damage to the tip of the needle transducer and the pulse–echo test showed that a good performance in sensitivity was maintained after the vibration test.
1. Introduction
A cataract is a clouding of the crystalline lens that reduces the amount of incoming light and impairs visual perception. In most cases, the appearance of a cataract seems to be a result of a certain biochemical change in the lens, associated with aging, but some eye injuries, certain medications and diseases such as diabetes and alcoholism can also cause cataracts (Kanski 2006). Symptoms of cataracts include blurred vision, sensitivity to light and glare, distortion and dimming of colors and vision. Phacoemulsification is a very common surgical procedure for treating cataracts. During the surgical operation, a surgeon makes a small incision about 3 mm wide on the cornea, near the limbus, and inserts a needle-thin probe with a diameter of around 1.2 mm into the cataract lens following removal of the anterior portion of the lens capsule. Lens fragmentation (emulsification) is then achieved by linear vibrations of the tip of the phacoemulsification, created by ultrasound waves, and the lens fragments are aspirated. The lens capsule remains in place to provide support for the artificial lens implant (Wilson et al 2005). The use of an optimal energy level at the phacoemulsification tip—which depends on the hardness of the cataract lens—both reduces the injury to the lens capsule and corneal endothelium, and improves the efficiency of the surgery. Consequently, it is crucial to be able to determine the hardness of the cataract lens in order to estimate the optimal phacoemulsification energy prior to commencing cataract surgery.
Several ultrasound-based methods have been explored for evaluating the hardness of the cataract lenses due to their real-time capability and noninvasive nature (Oksala and Lehtinen 1958, Jansson and Kock 1962, Oguchi et al 1975, Thijssen 1993). The ultrasound attenuation coefficient of human and porcine eye tissue have been measured in the frequency range from 17 to 23 MHz, with the results indicating that the porcine eye can serve as a good animal model for the human eye (De Korte et al 1994). Furthermore, some cataract studies have been achieved by evaluating the hardness changes in lenses using the ultrasound attenuation coefficient (Shiina and Sugata 1992, Tabandeh et al 2000, Paunksnis et al 2003, Raitelaitiené et al 2004, Kurapkiené et al 2005). In these studies, a single-element transducer was placed outside of the eye ball or lens, and two echo signals from the anterior and posterior interfaces of the lens were acquired to calculating the ultrasound attenuation coefficient by using the difference between two power spectra of echoes in the ultrasound frequency range from 7 to 10 MHz. The experimental results indicated that the ultrasound attenuation coefficient increased with an increase in the hardness of the cataract lens. However, most of these studies did not yield data on the quantitative relationship between ultrasound attenuation and the hardness of the cataract lens that determines the energy used in phacoemulsification, and the accuracy of measurements may be influenced by such factors as the properties of cornea, capsules, age of patient and the thickness of the crystalline lens.
In our pervious study, ultrasonic parameters of sound velocity and frequency-dependent attenuation ranging from 25 to 45 MHz were measured for evaluating the hardness of lenses in cataract surgery in vitro (Huang et al 2007a). The correlation between the phacoemulsification energy level and the stiffness of the cataract lens was found. The results showed that measuring ultrasound attenuation may provide surgeons with an objective means with excellent reproducibility for selecting an optimal energy during phacoemulsification. However, this in vitro method is not suitable for clinical measurement because it needs a reflector in back of the lens. In order to overcome this problem, two novel ultrasonic methods were previously studied: ultrasound statistical parameter image (Tsui et al 2007) and invasive measurement of ultrasound attenuation using a needle transducer making an angle of 45° relative to the needle axis (Huang et al 2007b). Even though it was shown that the ultrasound statistical parameter image may provide the hardness properties of the lens before cataract surgery, it is still difficult to be used during surgery. On the other hand, combining a needle transducer (with a reflector, Huang et al 2007b, figure 1(b)) with a phacoemulsification probe may facilitate real-time measurements of ultrasound attenuation during cataract surgery. However, only regional lens properties surrounding the phacoemulsification probe between the needle transducer and the reflector can be measured, implying that this method cannot detect the hardness properties of the cataract lens in front of the phacoemulsification probe. This observation prompted us to institute the spectral shift method for a direct estimation of the ultrasound attenuation coefficient by calculating the changes in the backscattered signal along the transducer beam in the lens for providing the hardness information during cataract surgery.
Figure 1.
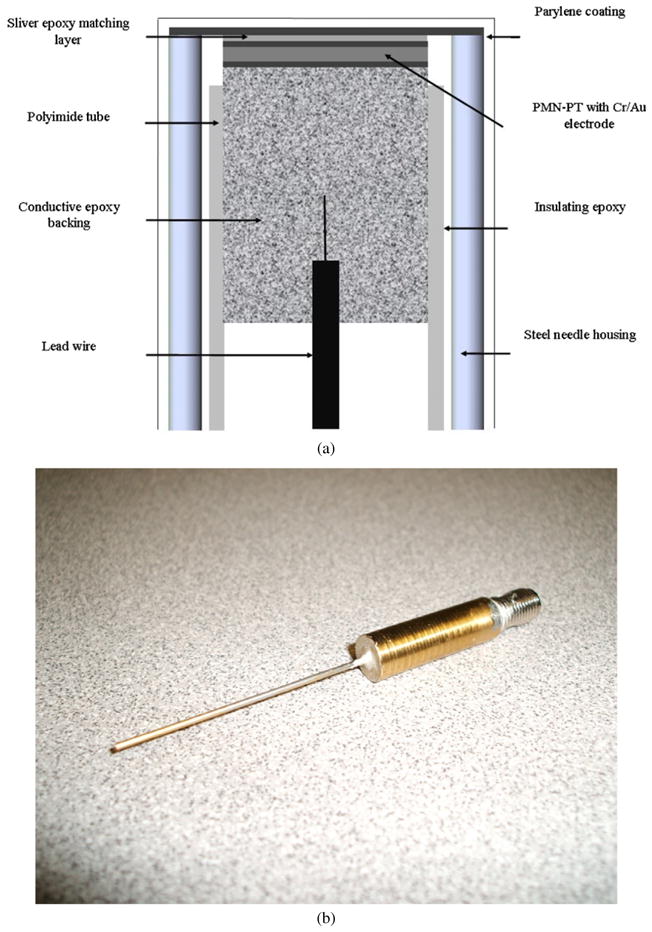
Design cross section of the needle transducer (a) and photograph of the transducer (b).
In this study, a 47 MHz high-frequency non-focused needle transducer with a housing diameter of 0.9 mm was designed and fabricated for invasive measurements of the ultrasound attenuation coefficient in the cataract lens. The small diameter of the needle transducer allows it to be combined with a phacoemulsification probe and inserted into the anterior chamber via a small, 3 mm wide incision in the peripheral cornea. The high-frequency ultrasound attenuation coefficient was measured with the needle transducer in the porcine lens with artificially induced cataracts at different cataract stages. Finally, the relationship between the attenuation coefficient and different hardness stages of the cataract lens was found to be consistent with previous results (Huang et al 2007a, 2007b), confirming the performance of this method.
2. Materials and methods
2.1. Transducer fabrication
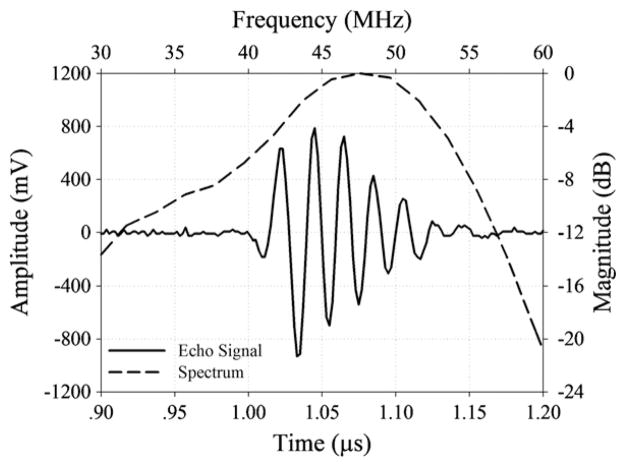
In this study, PMN-33%PT was chosen as the active transducer element due to its high electromechanical coupling coefficient (kt), low dielectric loss and high relative clamped dielectric constant, which in combination make it an ideal candidate for fabricating very sensitive, small aperture, high-frequency transducers. A polarized PMN-33%PT (H.C. Materials, Bolingbrook, IL, USA) piece was lapped to 45 μm. A matching layer made of Insulcast 501 and Insulcure 9 (American Safety Technologies, Roseland, NJ, USA) and 2–3 μm silver particles (Sigma-Aldrich Inc., St Louis, MO, USA) was cured over the PMN-PT and lapped to 9 μm. A conductive backing material, E-solder 3022 (VonRoll Isola, New Haven, CT, USA), was cured over the opposite side of the PMN-PT and lapped to 3 mm. Active element plugs were diced out at 0.4 × 0.4 mm aperture size, using a mechanical dicing saw (Tcar 864-1 Thermocarbon, Inc., Casselberry, FL, USA) and housed using Epotek 301 (Epoxy Technology Inc., Billerica, MA, USA) within a polyimide tube with an inner diameter of 0.57 mm (MedSource Technologies, Trenton, GA, USA). An electrical connector was fixed to the conductive backing using a conductive epoxy. The polyimide tube provided electrical isolation from the 20-gauge needle (20 GA 1–1/2″, McMaster-Carr Supply Company, Atlanta, GA, USA) housing with an inner diameter of 0.66 mm and an outer diameter of 0.91 mm. An electrode was sputtered across the silver matching layer and the needle housing to form the ground plane connection. Vapor-deposited parylene with a thickness of 12 μm was used to coat the aperture and the needle housing. A cross section of the non-focused needle transducer and photograph are shown in figures 1(a) and (b). Figure 2 shows the pulse–echo waveform and spectrum from the reflector in the distill water. The center frequency of the transducer was about 47 MHz and the bandwidth at −6 dB was measured to be approximately 53%. When the transducer was excited by a high bandwidth pulser/receiver (PR5900, Olympus NDT Inc., Waltham, MA, USA) with the 1 μJ energy setting, the maximum output voltage (Vp-p) of the unamplified echo signal was close to 1.5 V. The pressure and intensity of the non-focused PMN-PT needle transducer at the center frequency of 47 MHz were measured by a needle hydrophone (HPM04/01, Precision Acoustics, UK). The Pr.3, ISPTA.3, ISPPA.3 and MI were 0.32 MPa, 1.3 mW cm−2, 3.3 W cm−2 and 0.05 at 1.7 mm, respectively. The value of the lateral dimension was approximately 0.4 mm at the transition point from the near-field zone to the far-field zone and the axial resolution was approximately 53 μm. The characteristics of the needle transducer are listed in table 1.
Figure 2.
The pulse–echo waveform and spectrum of the 47 MHz needle transducer.
Table 1.
Characteristics of the needle transducer.
| Piezoelectric material | PMN-33%PT |
|---|---|
| Center frequency | 47 MHz |
| F-Number | 3 |
| Focal length | 1.2 mm |
| Housing diameter | 0.9 mm |
2.2. Lens samples
All of the experiments were performed on fresh porcine eyes within 24 h after they were collected from a local slaughterhouse. A surgical knife was used to incise the eye and remove the lens and its covering capsule; care was taken to not damage the lens capsule. The lens was then irrigated carefully with a saline buffer solution to remove the tissue fluid and iris tissue that adhered to the lens surface. Subsequently, the capsule was moved from the lens by a surgical tweezer. A total of 30 lens samples were used in this study. The thickness and weight of the lenses were approximately 7.76 ± 0.11 (mean ± SD) mm and 0.487 ± 0.009 g, respectively, as measured by a vernier caliper and electronic balance. Cataracts were induced by soaking the lens in a mixture of ethanol:2-propanol:formalin in the ratio of 3:3:4, in which its hardness increased with the immersion time (Sugiura et al 1999). In the present study, the immersion time was up to 160 min. The hardness of the cataract lens was evaluated by measuring Young’s modulus using a commercial mechanical device (ElectroForce 3100 Test Instrument, Bose Corporation, MN). The lens placed on a flat holder was compressed by a circular metal disk, which is driven by a linear motor. Then, the compression force and resulting deformation of the lens were measured using the built-in sensors in the device. The strain rate of the measurement system is 0.02 s−1. The relationship between the stress and strain was calculated with the strain defined as the ratio of the total deformation to the initial thickness. Young’s modulus for each specimen at the immersion times of 40, 60, 80, 120 and 160 min was computed from the slope of the stress–strain curve (Huang et al 2007a).
2.3. Experimental arrangement and procedures
The experimental arrangement is shown in figure 3. Prior to the measurements, the lens was placed on a rectangular polyurethane board with a circular hole. The high-frequency non-focused needle transducer was used in the measurements at a room temperature of 20.0 ± 0.5 °C. The needle transducer was mounted on a three-axis holder. A pulser/receiver (PR5900, Olympus NDT Inc., Waltham, MA, USA) with a 200 MHz bandwidth was used to drive the transducer for transmitting and receiving ultrasound signals with a pulse repetition frequency of 200 Hz. The received signals backscattered from the cataract lens were amplified 40 dB by a built-in amplifier and filtered by a bandpass filter in the pulser/receiver. The PRF trigger of the pulser/receiver was used to synchronize the acquisition of the backscattered echoes at a sampling frequency of 400 MHz by a 14-bit analog-to-digital converter (ADC) (CS14200, Gage Applied Technologies, Inc., Lachine, QC, Canada) housed in a personal computer. Note that an electronic limiter (Matec Instruments Company, Northborough, MA) was placed in front of the ADC for protection purposes. Both backscattering and triggering signals were also monitored on-line by a digital oscilloscope (9350AL, LeCeoy, Chestnut Ridge, NY).
Figure 3.
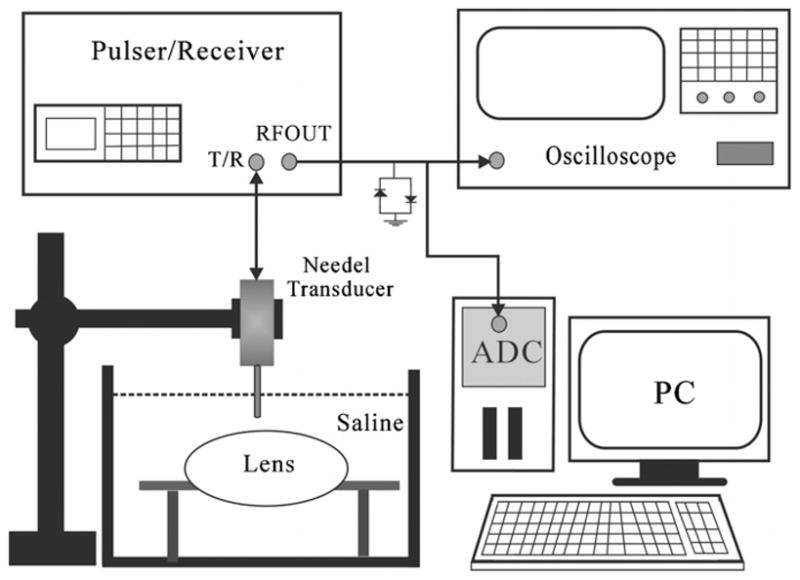
Block diagram of the experimental setup.
The experimental procedure was as follows. (1) For all measurements, the lenses were placed on a rectangular polyurethane board in a saline solution. (2) The three-axis holder was adjusted to keep the sample volume to be located at the far field of the needle transducer (the distance between the transducer and the lens was 1.2 mm). (3) A total of 500 A-lines of RF signals were acquired at the same position; each A-line corresponded to a sample volume of 4 μs assuming a speed of sound in the lens of 1600 m s−1 (Huang et al 2007b) and a sample volume length of approximately 3.2 mm. (4) For each cataract lens specimen, five independent measurements were carried out to obtain a mean value of the acoustic parameter. (5) The measurements of the ultrasound attenuation coefficient in cataract lenses were performed at immersion times of 40, 60, 80, 120 and 160 min, respectively.
2.4. Attenuation coefficient estimation
The spectral-shift measurement approach was used for calculating the attenuation coefficient in this study (Shung 2006). Estimation of the attenuation coefficient in an ultrasound pulse–echo arrangement is achieved by ascertaining the frequency-dependent attenuation of different frequency components in soft tissue. Because higher frequency components exhibit increased attenuation than low frequency, the center frequency of the spectrum from the backscattering signal obtained following Fourier analysis was demonstrated to shift downward (to lower frequency) with depth. Due to the linear increase in the attenuation coefficient with frequency, the slope of the center frequency downshift versus depth is proportional to the attenuation coefficient. Assuming that a Gaussian-shaped transmit pulse propagates in a soft tissue along depth, the ultrasound attenuation coefficient (β) can be determined from the slope of the downshift of the center frequency versus depth which is given by Shung and Thieme (1993):
| (1) |
where f(d) is the center frequency of the backscattered echo at a certain depth d in tissue, and σ is the Gaussian bandwidth of the pulse. The slope Δ f̄/Δd is estimated from a straight line fit to the plot of Δ f̄ where the bar represents averaging over a number of lines from the backscattered echo in tissue. The sample volume length of approximately 3.2 mm (Δd) was used to calculate the attenuation coefficient. For each backscattering signal, the gated window size was set to equal the length of the incident pulse, with a 50% window overlap used to calculate the spectrum. A 1024-point fast Fourier transform was applied to the data from each windowed segment to compute the spectrum. Due to the properties of both ultrasonic transducer and scatterers, it is difficult to obtain the reflected signal with a Gaussian shape. If the spectra of reflected signals are not Gaussian, a correction procedure must be incorporated. In order to obtain the Gaussian spectra, a shaping filter was used to convert the non-Gaussian spectra into Gaussian (Kuc 1983).
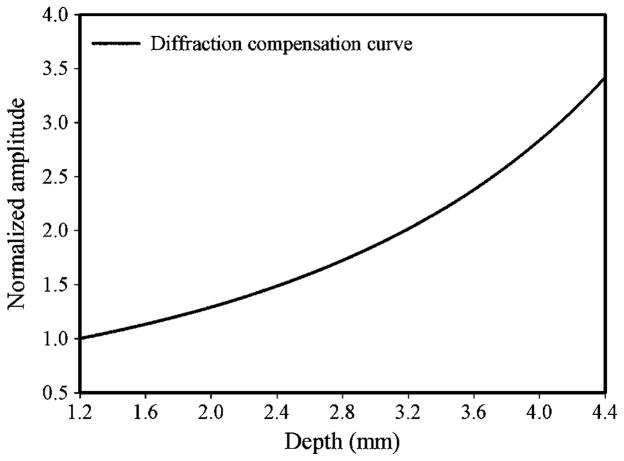
Due to beam diffraction effects, the spectral properties of the spectra are distorted and attenuation estimate obtained is also affected as the ultrasound signal propagates along the beam direction. Consequently, the correction of beam diffraction compensation needs to be performed before calculating the acoustic parameter. The diffraction compensation curve was obtained by measuring the pulse–echo amplitudes from a quartz reflector at different positions along the needle transducer beam in the distill water, as shown in figure 4. To compensate the diffraction effects of frequency in measuring the attenuation coefficient, a uniform reference phantom with a known attenuation coefficient was used (Kim and Varghese 2007). Backscattering signals from both reference phantom and lens sample were acquired with the same system setting. Since the attenuation coefficient of the reference phantom is known, the downshift of the center frequency along depth can be measured. By comparing center frequency changes along the depth between the theoretical and measured values in the reference phantom, the contributions due to diffraction effects on frequency can be calculated. The frequency difference was normalized with respect to frequency at each depth and utilized for diffraction correction in the lens sample.
Figure 4.
The diffraction compensation curve for the needle transducer.
3. Results and discussion
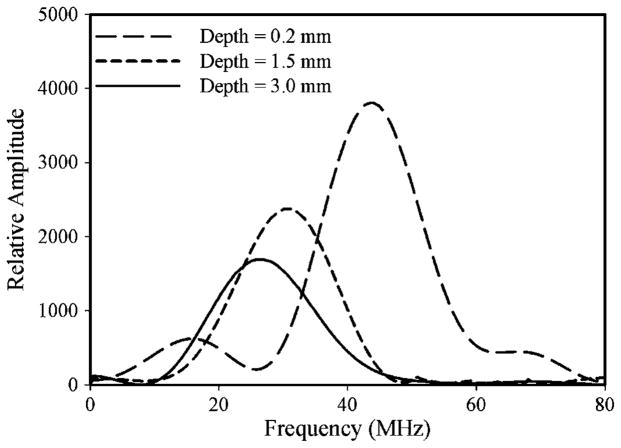
Figure 5 shows the typical spectra of the backscattering signal from three different depths within a cataract lens. The amplitude magnitude of the spectrum decreased and the center frequency was shown to shift downward (to lower frequency) with increasing depth. The center frequency decreased from 44 to 25 MHz with an increase in depth from 0.2 to 3.0 mm, as shown in figure 5. The spectral shift between the spectra obtained at two different depths is linearly proportional to the product of ultrasonic attenuation and to difference of the depths at which the spectra were obtained. The differences of the depths and center frequencies were used to calculate the attenuation coefficient, as shown in equation (1).
Figure 5.
The typical spectra of the backscattering signal from three different depths within a cataract lens (the immersion time of 160 min).
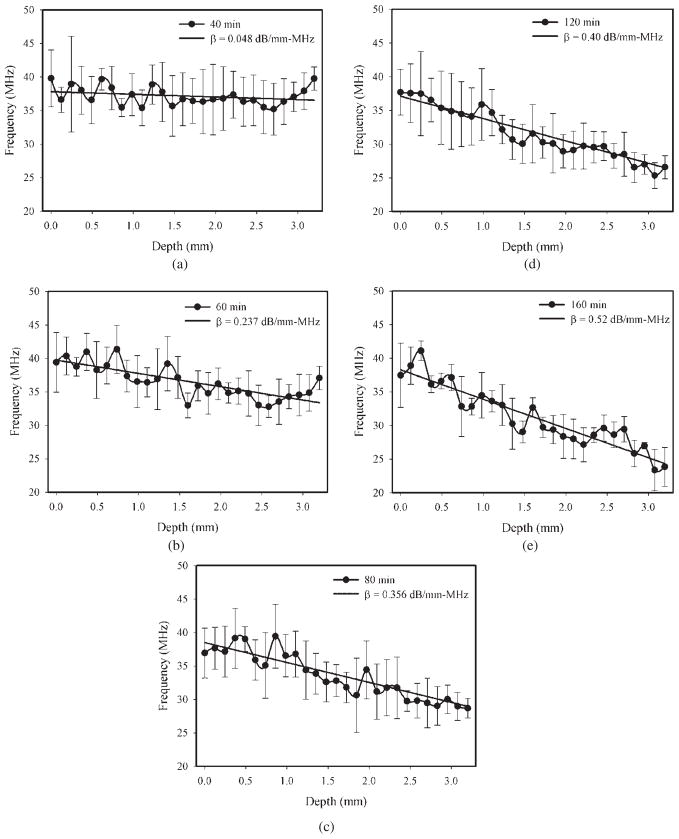
Figure 6 shows the center frequency location as a function of depth at different stages of the cataract lens, where a depth of 0 represents the interface of the anterior lens. For instance, the center frequency reduced from approximately 41 to 25 MHz with an increase in depth from 0.2 to 3.0 mm at an immersion time of 160 min, as shown in figure 6(e). The higher level of attenuation at higher frequencies caused more energy to be attenuated at the high-frequency region as the echo is backscattered to the needle transducer. Generally, center frequency decreased with increasing depth in all cases and the liner fit was used to estimate the slope of Δf̄/Δd. As the immersion time increased from 40 to 160 min, the attenuation coefficients (β) were increased from approximately 0.048 to 0.520 dB mm−1 MHz−1. Because the cataract fibers formed gradually with the immersion time in the lens, the depth of cataract fibers was small in the early stages of cataract. Deviations of center frequency versus depth curves were observed at immersion times of 40 and 60 min after a depth of 2.5 mm, as shown in figures 6(a) and (b), respectively. The reason might be the poor signal-to-noise ratio of the backscattering signals obtained from the deeper ranges of the lens (after a depth of 2.5 mm) (Greenleaf 1986). Investigations to date have shown that absorption is the dominant mechanism for ultrasonic attenuation in biological tissue (Shung 2006). The experimental results indicated that the ultrasonic attenuation was increased with the hardness of the cataract lens. Consequently, the cataract may be assumed as an absorbing medium. The increase in the attenuation coefficient (figure 6) could be due to a change in acoustic absorption caused by biochemical interactions among the lens constituents. There is experimental evidence that ultrasonic absorption in biological tissue is affected by molecular interactions (Greenleaf 1986). Consequently, the increase in ultrasonic attenuation could be the result of a combination of an increase in viscosity properties and other frictional factors that consume energy (Shung 2006). Surface reflection could affect attenuation coefficient measurements but usually these effects are small for soft tissue in saline (Parker 1983). We observed the reflected signal from the interface between the lens and saline at different hardness stages of cataract; the difference in the peak-to-peak value of the reflected signal was small. Consequently, the effects of the acoustic impedance between saline and the lens were limited.
Figure 6.
The center frequency location as a function of depth at different stages of the cataract lens. The liner fit was used to estimate the slope of Δ f̄/Δd. The measurements were carried out at the immersion times of 40 (a), 60 (b), 80 (c), 120 (d) and 160 min (e). Data are mean and SD values (N = 6).
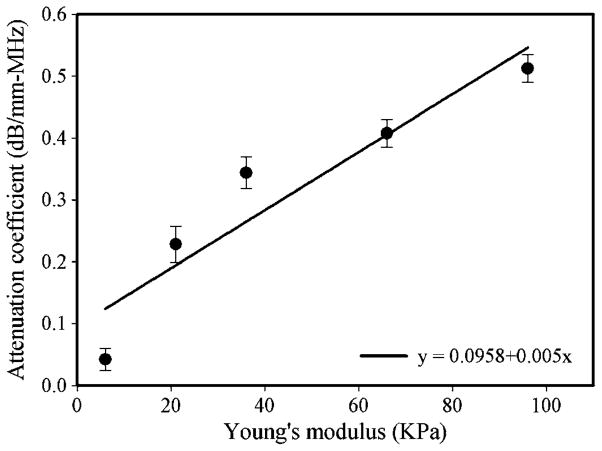
This is in good agreement with observations that the attenuation increases in the presence of a cataract (Shiina and Sugata 1992, Tabandeh et al 2000, Paunksnis et al 2003, Raitelaitiené et al 2004, Kurapkiené et al 2005, Huang et al 2007a, 2007b). However, this invasive measurement of the attenuation coefficient provided more accurate results than pervious studies due to that the non-invasive measurements may be influenced by such factors as the properties of cornea, capsules, age of patient and the thickness of the crystalline lens. In order to explore the quantitative correlation between the ultrasonic attenuation coefficient and the hardness of the cataract lens, the attenuation coefficient as a function of Young’s modulus is plotted in figure 7. The attenuation coefficient increased from 0.048 ± 0.02 to 0.520 ± 0.06 dB mm−1 MHz−1 corresponding to an increase in Young’s modulus from 6 ± 0.4 to 96 ± 6.2 kPa. The linear fit to these data showed that there was a high correlation between the ultrasonic attenuation coefficient and Young’s modulus: the correlation coefficient (R) value for the 95% confidence interval was 0.932. This result appears to suggest that the spectral-shift approach is sensitive and reliable for detecting the hardness of a cataract. The frequency-dependent attenuation coefficients from 25 to 45 MHz at different hardness stages of cataract were measured in our pervious study (Huang et al 2007a). The linear correlation between the frequency and attenuation coefficient was found, even though Young’s modulus of cataract increased to 101.2 kPa. According to the results in the present study, the spectrum was downshift with hardness of cataract, but the downshift was related to both absorption coefficient and power law exponent. Attenuation in biological tissue is commonly modeled using a power law function α = βfn, where α is the tissue attenuation in dB mm−1, β is known as the coefficient of frequency-dependent attenuation (dB mm−1 MHz−1) and n is the power law exponent (usually between 0.9 and 1.4) (Shung and Thieme 1993). We calculated the results from the present study and previous study (Huang et al 2007a); the value of n was decreased from 1.38 to 0.86 corresponding to an increase in Young’s modulus from 6 ± 0.4 to 96 ± 6.2 kPa. Even though the value of n was not equal to 1, the range of n can be considered as a reasonable region for estimating the frequency-dependent attenuation coefficient. Consequently, the main contribution of ultrasonic attenuation in cataract can be attributed to the effects of absorption.
Figure 7.
Attenuation coefficient as a function of Young’s modulus in the cataract lens. The best-fit lines indicate the presence of a linear correlation between the attenuation coefficient and Young’s modulus (R = 0.932). Data are mean and SD values.
The goal of this study was to measure the stiffness of the cataract lens in front of the phacoemulsification probe. By using the spectral-shift approach, the attenuation coefficient along the transducer beam in the lens can be measured. The attenuation coefficient from the regional lens (near the transducer) can be detected by selecting a small size of sample volume along the acoustic beam. The process of cataract formation is associated with increases in the hardness and opacity of the lens due to increases in both protein aggregation and inner fiber compaction. According to the suggestions from a pervious study (Sugiura et al 1999), the ethanol:propanol:formalin mixture solution is suitable for creating an artificial cataract lens. Since the cataract lens was created artificially by the formalin mixture solution, the stiffness of cataract exhibited a uniform distribution in the present study. There are two common types of cataract lens, each defined by its location on the lens. Nuclear cataracts are found in the center, or nucleus of the lens. Cortical cataracts begin at the outer rim of the lens, which is known as the cortex, and work toward the center. Nuclear cataract is usually the result of advancing age and cortical cataract is most commonly seen in patients who have diabetes. Both types of cataract exhibit heterogeneous and homogeneous properties in clinical cases. For instance, the nuclear cataract appears more or less homogeneous in senile cataract and the homogeneous cataracts are more common in women. Due to the heterogeneous characteristics of tissues, there may have some errors in measuring the attenuation coefficient by using the spectral difference or spectral shift approach. Since the cataract fibers were located partially in the lens, the global cataract lens can be treated as a heterogeneous tissue. However, as the needle transducer was inserted into the lens and closed to the cataract fibers, the cataract fibers along the acoustic beam with a small window size may be assumed as a homogeneous medium. Certainly, more studies need to be done in terms of establishment of a unified relationship between the real cataract lens and acoustic parameters for better understanding the cataract lens characterization. However, the artificial porcine cataract lens should be studied before we can apply this needle transducer method to in vivo real cataract measurements. The real cataract will be studied in our next works to explore the heterogeneous and homogeneous characteristics on attenuation coefficient measurements.
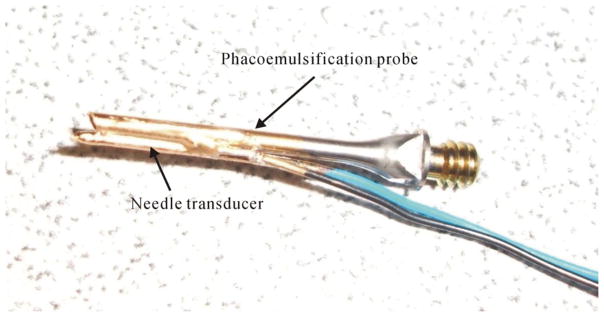
When the lens became harder, the ultrasound attenuation coefficient was increased hugely. This increase in attenuation may reduce the intensity of the reflected signal from the cataract lens. Consequently, the accuracy of the attenuation coefficient may be affected by the poor signal-to-noise ratio of the backscattering signals. In general, higher acoustic pressures generate nonlinear waves with a shape depending on the media and the distance traveled from the generating source to the investigated region. The aperture of the needle transducer was very small and the pulse repetition frequency of the pulser/receiver was slow (200 Hz) in the present study. Consequently, the effect of nonlinear propagation on the spectral shift measurement may be limited. Two spectral estimation methods were used frequently for measuring the attenuation coefficient from backscattered signals in vivo: spectral difference and spectral shift approaches (Shung 2006). The spectral shift approach, given by equation (1), can be extended easily to an estimation procedure. When processing the windowed data segments, only the center frequency locations need to be estimated to determine a β estimate, rather than the entire spectrum, as in the spectral difference approach (Greenleaf 1986). Consequently, the spectral shift method is more efficient than the spectral difference method (Shung and Thieme 1993), implying that the approach used in the present study may provide a higher processing speed in measuring the attenuation, due to that only the center frequencies of the backscattering signals at two different depths need to be calculated in a cataract lens. This advantage makes it very desirable for real-time estimation of the hardness of cataract as the needle transducer was combined with a phacoemulsification probe. During cataract surgery, the surgeon uses a phacoemulsification probe to crack the cataract lens from the anterior to posterior capsule. It is crucial to be able to detect the hardness properties in front of the phacoemulsification probe in real time and then to feedback the hardness information to the phacoemulsification system for automatic adjustments of the energy level. Because the phacoemulsification probe vibrates at a very high speed, the needle transducer may be damaged during the vibration. In order to verify this issue, the needle transducer which was only covered with a polyimide tube for reducing the transducer weight was mounted on the side of the phacoemulsification probe for a vibration test, as shown in figure 8. The handpiece (CX7000, Storz, USA) with a phacoemulsification probe (combine a needle transducer, figure 8) was driven by a microsurgical system (Millennium™, Bausch & Lomb, USA) at a duty cycle of 50% and a maximum ultrasound power of 40% (for the hardest cataract (immersion time of 160 min), the lens can be chopped by the phacoemulsification probe at this setting) for 5 min in the water. The whole process was monitored by a high-speed camera. After the test, there was no irregular damage on the tip of the needle transducer and the pulse–echo test still exhibited good performance in sensitivity. Comparing the present method to our previous design (Huang et al 2007b), we found that the spectral shift approach does not need a reflector in front of the transducer. Consequently, the weight and size of the needle transducer are reduced, making it more amenable to invasive measurements.
Figure 8.
Photograph of combining the needle transducer and phacoemulsification probe.
4. Conclusions
In this study, a 47 MHz high-frequency needle transducer was fabricated for a sensitive detection of attenuation coefficient in a cataract lens with the spectral shift approach. The active material of the needle transducer is a polarized PMN-33%PT single crystal, and the outer diameter is 0.9 mm. This design may allow surgeons to detect the hardness properties of the cataract lens via a small incision on the cornea during phacoemulsification surgery. The attenuation coefficients were measured at different stages of the artificial porcine cataract lens. The results demonstrated that the ultrasonic attenuation coefficient increased from 0.048 ± 0.02 to 0.520 ± 0.06 dB mm−1 MHz−1 corresponding to an increase in Young’s modulus from 6 ± 0.4 to 96 ± 6.2 kPa as the cataract further developed. Finally, a vibration test was preformed by combining the needle transducer and phacoemulsification probe. The results indicated that there was no apparent damage to the tip of the needle transducer and the pulse–echo test showed that a good performance in sensitivity was maintained after high-speed vibration.
Acknowledgments
This work was supported by NIH grant P41-EB2182 and Doheny Retina Institute, Doheny Eye Institute, Department of Ophthalmology, Keck School of Medicine, University of Southern California. A part of this work was supported by NSC of Taiwan under grant NSC 98-2221-E-030-004.
References
- De Korte CL, Van Der Steen AFW, Thijssen JM. Acoustic velocity and attenuation of eye tissues at 20 MHz. Ultrasound Med Biol. 1994;20:471–80. doi: 10.1016/0301-5629(94)90102-3. [DOI] [PubMed] [Google Scholar]
- Greenleaf JF. Tissue Characterization with Ultrasound. Boca Raton, FL: CRC Press; 1986. [Google Scholar]
- Huang CC, Ameri H, DeBoer C, Rowley AP, Xu X, Sun L, Wang SH, Humayun MS, Shung KK. Evaluation of lens hardness in cataract surgery using high frequency ultrasonic parametersin vitro. Ultrasound Med Biol. 2007a;33:1609–16. doi: 10.1016/j.ultrasmedbio.2007.05.002. [DOI] [PubMed] [Google Scholar]
- Huang CC, Zhou Q, Wu D, Ameri H, Sun L, Wang SH, Humayun MS, Shung KK. Determining acoustic properties of the lens using a high frequency ultrasonic needle transducer. Ultrasound Med Biol. 2007b;33:1971–7. doi: 10.1016/j.ultrasmedbio.2007.06.004. [DOI] [PubMed] [Google Scholar]
- Jansson F, Kock E. Determination of the velocity of ultrasound in the human lens and vitreous. Acta Ophthalmol. 1962;40:420–33. doi: 10.1111/j.1755-3768.1962.tb02390.x. [DOI] [PubMed] [Google Scholar]
- Kanski JJ. Clinical Diagnosis in Ophthalmology. London: Elsevier/Mosby; 2006. [Google Scholar]
- Kim H, Varghese T. Attenuation estimation using spectral cross-correlation. IEEE Trans Ultrason Ferroelect Freq Control. 2007;54:510–9. doi: 10.1109/tuffc.2007.274. [DOI] [PubMed] [Google Scholar]
- Kuc R. Applying spectral-shift procedures for estimating acoustic attenuation to non-Gaussian spectra. Proc IEEE Ultrasonic Symp. 1983:831–4. [Google Scholar]
- Kurapkienė S, Raitelaitienė R, Paunksnis A, Lukoševičius A, Burnovas S, Paunksnienė M, Svaldenienė E, Babrauskienė V. The relationship of ultrasonic and mechanical properties of human nuclear cataract: a pilot study. Ultragarsas. 2005;1:39–43. [Google Scholar]
- Oguchi Y, Van Marle GWRB, Eijskoot F, Henkes HE. Study of the ultrasonic characteristics of the lens. Bibl Ophthalmal. 1975;83:252–8. [PubMed] [Google Scholar]
- Oksala A, Lehtinen A. Absorption of ultrasound in the aqueous humour, lens and vitreous body. Acta Ophthalmol. 1958;36:761–8. doi: 10.1111/j.1755-3768.1958.tb02286.x. [DOI] [PubMed] [Google Scholar]
- Parker KJ. Ultrasonic attenuation and absorption in liver tissue. Ultrasound Med Biol. 1983;9:363–9. doi: 10.1016/0301-5629(83)90089-3. [DOI] [PubMed] [Google Scholar]
- Paunksnis A, Kurapkienė S, Mačiulis A, Raitelaitienė R, Jurkonis R, Lukoševičius A. Estimation of ultrasound attenuation coefficient of human diabetic cataract. Ultragarsas. 2003;1:37–40. [Google Scholar]
- Raitelaitienė R, Kurapkienė S, Mačiulis A, Paunksnis A. The influence of age related changes to ultrasound attenuation of human eye lens. Ultragarsas. 2004;2:55–9. [Google Scholar]
- Shiina T, Sugata Y. An application of ultrasonic tissue characterization to the diagnosis of cataract. IEEE Ann Int Conf. 1992;6:2769–71. [PubMed] [Google Scholar]
- Shung KK. Diagnostic Ultrasound: Imaging and Blood Flow Measurements. Boca Raton, FL: CRC Press; 2006. [Google Scholar]
- Shung KK, Thieme GA. Ultrasonic Scattering in Biological Tissue. Boca Raton, FL: CRC Press; 1993. [Google Scholar]
- Sugiura T, Kurosaks D, Uezuki Y, Eguchi S, Obata H, Takahashi T. Creating cataract in pig eye. J Cataract Refract Surg. 1999;25:615–21. doi: 10.1016/s0886-3350(99)00002-4. [DOI] [PubMed] [Google Scholar]
- Tabandeh H, Wilkins M, Thompson G, Nassiri D, Karim A. Hardness and ultrasonic characteristics of human crystalline lens. J Cataract Refract Surg. 2000;26:838–41. doi: 10.1016/s0886-3350(00)00305-9. [DOI] [PubMed] [Google Scholar]
- Thijssen JM. The history of ultrasound techniques in ophthalmology. Ultrasound Med Biol. 1993;19:599–618. doi: 10.1016/0301-5629(93)90068-y. [DOI] [PubMed] [Google Scholar]
- Tsui PH, Huang CC, Chang CC, Wang SH, Shung KK. Feasibility study of using high-frequency ultrasonic Nakagami imaging for characterizing the cataract lensin vitro. Phys Med Biol. 2007;52:6413–25. doi: 10.1088/0031-9155/52/21/005. [DOI] [PubMed] [Google Scholar]
- Wilson ME, Trivedi RH, Pandey SK. Pediatric Cataract Surgery: Techniques, Complications, and Management. Baltimore, MD: Williams & Wilkins; 2005. [Google Scholar]


