

Abstract
Zinc metalloenzymes play an important role in biology. However, due to the limitation of molecular force field energy restraints used in X-ray refinement at medium or low resolutions, the precise geometry of the zinc coordination environment can be difficult to distinguish from ambiguous electron density maps. Due to the difficulties involved in defining accurate force fields for metal ions, the QM/MM (Quantum-Mechanical /Molecular-Mechanical) method provides an attractive and more general alternative for the study and refinement of metalloprotein active sites. Herein we present three examples that indicate that QM/MM based refinement yields a superior description of the crystal structure based on R and Rfree values and on the inspection of the zinc coordination environment. It is concluded that QM/MM refinement is a useful general tool for the improvement of the metal coordination sphere in metalloenzyme active sites.
Introduction
X-ray crystal structures of metalloenzymes, have had, and continue to have a major impact on our understanding of the structure and function of biologically relevant metal centers[1]. They are often used to guide mechanistic and computational studies[2, 3]. The level of detail that can be extracted regarding a metal center from a crystal structure depends heavily on the quality of the diffraction data. More details can be extracted regarding the metal center at the higher resolution[4]. Few protein crystal structures are determined to atomic resolution due to the limitation of experiments. In addition, in order to enhance the data set obtained from the X-ray experiment, other techniques such as constraints or restraints are introduced to improve the parameter-to-observation ratio in the structure determination and refinement process[5-9]. The restraints are usually implemented with empirical force field parameters consisting of bond lengths, bond angles, torsion angles, and non bonded terms[10]. For the normal amino acids, the parameters used in the refinement are based on the careful statistical analysis of small molecule data sets[11], which are accurate to atomic resolution. However, the situation is less favorable for cases where metal centers or unusual small molecule ligands are involved given that validated force field parameter sets for the former are entirely lacking, while for the latter they may exist, but the validation of the parameter sets are minimal. The lack of validated parameter sets for metallocenters in proteins may result in less well-determined X-ray structures for active sites involved with metal ions in proteins[4, 12].
Zinc is a key metal ion that plays an important role in many biological processes[13-15]. Zinc serves both as a catalytic center in zinc metalloenzymes and it can be used as structural cofactor like in the zinc finger class of proteins[16-19]. Due to the filled d-shell, Zn tends to prefer four-coordination, but higher coordination numbers can be realized depending on the nature of the coordinating groups. The varied ligands and coordination geometries in zinc metalloenzymes result in zinc-binding motifs with a broad range of stability constants, reactivities and function. In a large number of the three dimensional structures for zinc metalloenzymes[1, 20], the most commonly observed binding motif has zinc tetrahedrally coordinated. One water molecule from solvent and any combination of three nitrogen, oxygen and sulfur atoms from His, Glu, Asp and Cys are mostly involved in tetrahedral coordination of zinc. While in instances where zinc is serving as a structural cofactor it is only coordinated with protein residues. No bound water is found in this coordination motif. Five coordinated trigonal bipyramidal and square pyramid geometries and six-coordinated octahedral geometry are also observed for zinc metalloenzymes[1, 16].
Structural studies from X-ray diffraction give detailed information regarding the geometric parameters for metal ligands and the coordination environments of the metal sites[20]. The statistics of the distributions of zinc-sulfur bonds in proteins show that the peaks of the Zn-S bond length distributions lie between 2.2 and 2.4 Å in the tetrahedral coordination environment. The distributions of zinc-oxygen (Asp/Glu), and –nitrogen (His) bonds show that most common distances range from 1.9 to 2.2 Å for zinc and oxygen atoms, 2.0 to 2.2 Å for zinc and nitrogen atom. There are some outliers in the data, for example some Zn-S bonds and Zn-O bonds in the PDB fall below 1.5 Å[21]. These structures are likely incorrect because of either poorly resolved X-ray signals or difficulties in the refinement process. In particular, the lack of accurate force field parameters for typical metalloclusters seen in proteins makes it difficult to reliably refine metalloenzyme active site clusters using traditional force field method based X-ray refinement protocols. This situation is unlikely to change significantly in the short term, however through the introduction of quantum-mechanical (QM) or quantum-mechanical/molecular-mechanical (QM/MM) methods into the X-ray refinement process avoids this problem entirely[22-25]. This is the focus of the present paper in that we validate the use of QM or QM/MM techniques for the refinement of zinc metalloproteins and the improvement of local geometry for zinc binding sites.
Computational Methods
Crystal structure refinement at medium or low resolution (2.0 Å or higher) usually follows an energetically restrained refinement (EREF) formalism, due to the relatively poor parameter-to-observation ratio, which can be conveniently combined with simulation techniques such as molecular dynamics (MD) and simulated annealing (SA) [26]. Empirical restraints are introduced as harmonic penalty functions for bond stretching, bending, and rotation in which the equilibrium values (force field parameters) are taken from the statistical analysis of the high resolution small molecule crystal structure database. Non-bond interactions such as van der Waals and electrostatics may be included, but it was found that the classical non-bond force field parameters often resulted difficulties in the X-ray refinement process. This part of the target function is termed as Echem. Engh and Huber proposed one such set of parameters for proteins based on the statistical analysis of the chemical moieties of proteins and polynucleotides from the Cambridge Structural Database (CSD)[27], which is now widely used in many crystal structure refinement packages[11]. The second part of the target function comes from the model structure diffraction calculation (Ex-ray) and is combined with Echem along with a weighting factor (wa) to control the balance of forces from two sources. The weighting factor maybe varied to achieve the optimal agreement with the experimental structure factors. It is important to use high quality force field parameters to avoid the use of excess X-ray weighting because the experimental diffraction patterns may contain errors themselves.
In the commonly used refinement force fields such as the one used in the Crystallography & NMR System (CNS)[26], Echem is a sum of terms describing various types of interactions
where the attractive van der Waals and electrostatic terms (last two terms) are omitted.
In the newly introduced QM/MM based X-ray refinement approach, Echem is simply replaced with a pure QM or QM/MM hybrid potential. Compared to an MM energy function that uses fixed atomic charges to model electrostatic interactions, QM has the intrinsic advantage that it can represent charge fluctuations and dynamic polarization. In addition, a QM description is superior to an MM one when the regions of interest involve structures that differ substantially from those found in the gas or solution phase (e.g., covalent complexes, systems with unusually close contacts, etc), where QM can represent these interactions more reliably that MM. Moreover, advanced QM methods are superior to MM approaches in describing the conformational preferences of small molecules. Previously, ab initio QM calculations have been introduced into the structure refinement process to improve metal centers in metalloprotein structures, such as blue copper proteins and iron-sulfur clusters[24], [28]. To circumvent the great computational cost associated with electronic structure calculations of proteins, a linear-scaling semi-empirical QM treatment was employed in our QM X-ray refinement implementation[25, 29-31]. The refinement program required the merging of three programs: AMBER[32] for the MM part of the QM/MM potential, DivCon[33, 34] for the linear-scaling semi-empirical QM capabilities and CNS (Crystallography and NMR System) for the X-ray refinement capabilities using our modified Echem term. The QM energy restraints were capable of maintaining reasonable stereochemistry to the extent that the resultant R and Rfree values are at least comparable to those of the classical MM approach.
In the next section, we will demonstrate how the QM or QM/MM refinement strategy was used to improve the local geometry and resolve ambiguous electron densities of three low and medium-resolution zinc metalloprotein structures.
Results and Discussion
1. Yeast Hsp40 Ydj1 complexed with its peptide substrate
Molecular chaperone Hsp40 protein Ydj1 together with Hsp70s play an important role in biogenesis of protein through participating in protein folding and other cellular functions[35-38]. Hsp40 can bind to nonnative polypeptides to prevent aggregation[39-41]. One structure of the Ydj1 peptide binding fragment and its peptide substrate complex was refined to 2.7 Å resolution resulting in an Rwork of 26.9% and an Rfree 29.6%[21]. The crystal structure of the Hsp40 complex showed that three domains adopt an L-shape structure with a bound Ydj1 peptide fragment (see Fig. 1). Domain I and domain III exhibit similar protein folds, while domain II contains two Zinc finger motifs. Very little contact is found between the zinc finger motifs and the other domains of the Hsp40 Ydj1 structure. In the structural zinc sites, the metal ion is bound by four cysteine side chains in a tetrahedral geometry, which is the most common tetrahedral zinc binding site observed in zinc containing enzymes. The first zinc finger motif consists of two residues Cys143 and Cys146 in the first CXXCXG motif (Z1) and other two residues Cys201 and Cys204 in the fourth CXXCXG motif (Z4), while two residues Cys159 and Cys162 from the second CXXCXG motif (Z2) with other two residues Cys185 and Cys188 from the third CXXCXG motif (Z3) construct the second zinc finger motif. The two zinc finger motifs form a 90° turn between the two arms of the L-shaped Ydj1 peptide binding fragment. The geometric parameters of the Zn-CCCC Cluster from the deposited crystal structure, including bond lengths, r, in Å, angles, θ, in degrees, and torsion angles, φ, in degrees are given in Table 1. As seen in the Hsp40 Ydj1-peptide structure, the Zn-S bond distances are all below 1.5 Å, which is an unusually short distance for Zn-S bonds. The mean S-Zn-S and C-S-Zn angles are 108.72 and 114.83 degrees respectively. From the 2Fo − Fc electron density maps downloaded from the Electron Density Sever (EDS)[42] around the two zinc finger motifs (shown in Fig. 2), it's difficult to correctly interpret this portion of map due to the poorly resolved electron density around this area of the protein. The details of the individual atoms are smeared. As mentioned previously, for low and medium-resolution structures, the traditional refinement method with molecular mechanical force field parameters are difficult for metal containing species due to the dearth of validated force field parameters. In this study we use semi-empirical QM methods as energy restraints for the Hsp40 Ydj1-peptide structure.
Figure 1.
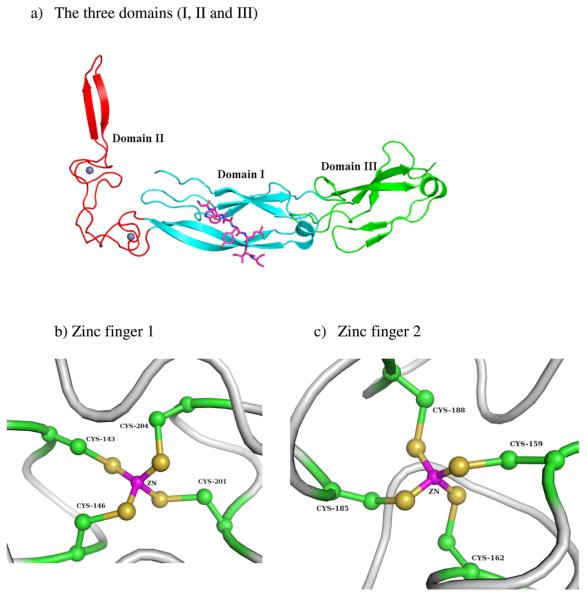
a) Ribbon drawing of the Ydj1 peptide binding fragment complexed with the peptide substrate GWLYEIS. b) and c) Close up views of the two zinc-binding sites in 1NLT. The three domains I, II and III are shown in cyan, red and green respectively. The bound peptide GWLYEIS is shown in magenta. The two zinc finger motifs are grey spheres.
Table 1.
Zn-CCCC cluster bond lengths, angles and torsion angles in deposited PDB structure. (PDB ID: 1NLT)
| Bond | R (Å) | Bond | R (Å) |
|---|---|---|---|
| Zn1 – SG (C143) | 1.49 | Zn2 – SG(C159) | 1.44 |
| Zn1 – SG(C146) | 1.42 | Zn2 – SG(C162) | 1.42 |
| Zn1 – SG(C201) | 1.46 | Zn2 – SG(C185) | 1.43 |
| Zn1 – SG(C204) | 1.43 | Zn2 – SG(C188) | 1.45 |
|
| |||
| Mean | 1.44 | ||
| Angles (degrees) |
S-Zn1-SG(C146) | S-Zn1-SG(C201) | S-Zn1-SG(C204) | C-S-Zn1 |
|---|---|---|---|---|
| SG(C143) | 115.29 | 111.37 | 119.02 | 113.46 |
| SG(C146) | 97.75 | 108.36 | 111.68 | |
| SG(C201) | 102.20 | 120.02 | ||
| SG(C204) | 108.92 | |||
|
| ||||
| S-Zn2-SG(C162) | S-Zn2-SG(C185) | S-Zn2-SG(C188) | C-S-Zn2 | |
| SG(C159) | 102.11 | 107.15 | 118.23 | 112.32 |
| SG(C162) | 110.98 | 109.28 | 117.48 | |
| SG(C185) | 102.93 | 107.86 | ||
| SG(C188) | 126.89 | |||
|
| ||||
| Mean | 108.72 | 114.83 | ||
| Torsion Angles (Degrees) |
Cα- Cβ-S-Zn | |
|---|---|---|
| Zn1 | SG(C143) | −170.50 |
| SG(C146) | 112.78 | |
| SG(C201) | 148.07 | |
| SG(C204) | −117.62 | |
|
| ||
| Zn2 | SG(C159) | −160.70 |
| SG(C162) | −96.90 | |
| SG(C185) | −126.23 | |
| SG(C188) | −133.44 | |
Figure 2.

Refined 2Fo − Fc electron density maps around the two zinc ions. The electron density map was obtained from the EDS sever. The green contours show 1.5σ densities.
In the QM/MM refinement of the Ydj1 peptide binding fragment and its peptide substrate complex structure, all atoms from protein (PDBID: 1NLT) were treated quantum mechanically. The 147 water molecules were treated molecular mechanically. Divide-and-Conquer (D&C) [33, 34], a linear-scaling semi-empirical technique, was employed to efficiently compute the QM energy at the PM3 semiempirical level of theory[43] with a new PM3 parameterization for zinc (ZnB :Biological Zinc) described previously[44]. The semiempirical PM3 method is relatively fast when modeling protein structures. However, it was unable to accurately model zinc in a biological setting. With the ZnB parameter sets, the PM3 method was effectively extended to model biologically relevant zinc coordination sites. The D&C PM3 calculations use the dual-buffer layer scheme (inner buffer layer of 4.5 Å and an outer buffer layer of 2.0 Å) with one protein residue per core. In the refinement carried out in this study, 7827 reflections obtained from the Protein Data bank were considered, of which 414 reflections were used for validation. The calculated R and Rfree values corresponding to different X-ray weighting factors are listed in Table 2. The QM/MM refinement protocol produced structures with comparable agreement in terms of R and Rfree factors with the deposited X-ray diffraction data only at high X-ray weighting factors wa=2.0. Comparing the QM/MM re-refined and crystal structures, significant lengthening of the Zn - S distance is observed, the average distance of Zn-S changed from 1.44 Å (crystal structure) to 2.27 Å (QM/MM re-refined structures) at two selected weighting factors wa=0.6 and wa=2.0. The latter distance is reasonable for the bond distance between zinc and sulfur atoms observed in most metalloprotein structures. Other geometric parameters for the two zinc motifs are listed in Table 3. Fig. 3 shows the local geometries and the 2Fo − Fc electron density maps of the zinc binding sites after QM/MM re-refinement at weighting factors wa=0.6 and wa=2.0 respectively. The density is better defined for the Zn ion and its coordinated sulfur atoms from cysteine residues in both of the QM/MM re-refined structures. However, due to the limited resolution of the diffraction data, the side groups are still hard to position in the 1.5σ electron density maps, especially for the Cβ atoms from the cysteine side chains. The root-mean-square deviation (RMSD) between the QM/MM re-refined structure and original crystal structure is 2.55 for the Zn atoms and 0.27 for atoms in the Cysteine residues, and for all other atoms the RMSD is 0.246 excluding hydrogen atoms and water. The RMSD is only 0.130 between the two QM/MM refined structures at different weighting factors, which suggests the structure is less dependent on the X-ray signal via the use of a more physical and realistic QM/MM energy function.
Table 2.
Calculated R and Rfree values at different weighting factors after QM/MM refinements for PDB ID: 1NLT.
| wa | R | Rfree |
|---|---|---|
| 0.1 | 0.3188 | 0.3172 |
| 0.2 | 0.3082 | 0.3146 |
| 0.3 | 0.2962 | 0.3025 |
| 0.4 | 0.2909 | 0.3003 |
| 0.5 | 0.2867 | 0.2982 |
| 0.6 | 0.2824 | 0.2944 |
| 0.7 | 0.2851 | 0.2989 |
| 0.8 | 0.2805 | 0.2901 |
| 0.9 | 0.2744 | 0.2907 |
| 1.0 | 0.2716 | 0.2874 |
| 2.0 | 0.2628 | 0.2771 |
| 3.0 | 0.2559 | 0.2761 |
| 4.0 | 0.2515 | 0.2697 |
Table 3.
Zn-CCCC cluster bond lengths, angles, torsion angles (after QM re-refinement at wa=0.6 and wa=2.0) for PDB ID: 1NLT.
| Bond | R (Å) | Bond | R (Å) | |
|---|---|---|---|---|
| wa=0.6 | Zn1 – SG (C143) | 2.24 | Zn2 – SG(C159) | 2.27 |
| Zn1 – SG(C146) | 2.26 | Zn2 – SG(C162) | 2.25 | |
| Zn1 – SG(C201) | 2.30 | Zn2 – SG(C185) | 2.31 | |
| Zn1 – SG(C204) | 2.35 | Zn2 – SG(C188) | 2.30 | |
|
| ||||
| wa=2.0 | Zn1 – SG (C143) | 2.27 | Zn2 – SG(C159) | 2.23 |
| Zn1 – SG(C146) | 2.16 | Zn2 – SG(C162) | 2.25 | |
| Zn1 – SG(C201) | 2.29 | Zn2 – SG(C185) | 2.22 | |
| Zn1 – SG(C204) | 2.30 | Zn2 – SG(C188) | 2.31 | |
|
| ||||
| Mean | 2.27 | |||
| Angles (degrees) |
S-Zn1- SG(C146) |
S-Zn1- SG(C201) |
S-Zn1- SG(C204) |
C-S-Zn1 | |
|---|---|---|---|---|---|
| wa=0.6 | SG(C143) | 112.10 | 104.02 | 109.74 | 97.78 |
| SG(C146) | 109.53 | 114.32 | 98.12 | ||
| SG(C201) | 106.47 | 98.78 | |||
| SG(C204) | 101.29 | ||||
|
| |||||
| wa=2.0 | SG(C143) | 114.10 | 106.62 | 110.82 | 95.62 |
| SG(C146) | 103.52 | 115.10 | 96.03 | ||
| SG(C201) | 105.67 | 100.36 | |||
| SG(C204) | 99.69 | ||||
|
| |||||
| S-Zn2- SG(C162) |
S-Zn2- SG(C185) |
S-Zn2- SG(C188) |
C-S-Zn2 | ||
|
| |||||
| wa=0.6 | SG(C159) | 113.61 | 95.15 | 123.80 | 97.03 |
| SG(C162) | 104.92 | 94.85 | 105.67 | ||
| SG(C185) | 124.04 | 95.92 | |||
| SG(C188) | 116.51 | ||||
|
| |||||
| wa=2.0 | SG(C159) | 108.56 | 96.49 | 127.80 | 94.69 |
| SG(C162) | 99.58 | 93.52 | 110.64 | ||
| SG(C185) | 126.40 | 93.42 | |||
| SG(C188) | 109.60 | ||||
| Torsion Angles (degrees) |
Cα- Cβ-S-Zn | ||
|---|---|---|---|
| wa=0.6 | Zn1 | SG(C143) | −156.75 |
| SG(C146) | 119.14 | ||
| SG(C201) | 152.02 | ||
| SG(C204) | −111.13 | ||
|
| |||
| wa=2.0 | SG(C143) | −158.58 | |
| SG(C146) | 122.60 | ||
| SG(C201) | 152.55 | ||
| SG(C204) | −115.34 | ||
|
| |||
| wa=0.6 | Zn2 | SG(C159) | −172.29 |
| SG(C162) | −81.20 | ||
| SG(C185) | −121.25 | ||
| SG(C188) | −105.17 | ||
|
| |||
| wa=2.0 | SG(C159) | −173.43 | |
| SG(C162) | −83.25 | ||
| SG(C185) | −116.87 | ||
| SG(C188) | −108.41 | ||
Figure 3.

Refined 2Fo − Fc electron density maps around the two zinc finger motifs after QM/MM refinement at selected weighting factor (wa). The green contours show 1.5σ densities.
2. Human β Alcohol Dehydrogenase
Alcohol dehydrogenase is a dimeric enzyme that catalyzes the oxidation of alcohols to aldehydes[45]. The functional properties of human alcohol dehydrogenase isoenzymes have been characterized to understand their role in the metabolism of dietary or biogenic alcohols[46-48]. The human β isoenzyme has been extensively studied through substitutions made using site-directed mutagenesis[47]. The substitution in β isoenzymes or other isoenzymes reveals important information of maximal ethanol oxidizing activity. One detailed analysis of the structures of β alcohol dehydrogenase isoenzymes was reported by Hurley and coworkers in 1994[49].
The structure of β2 in the presence of the inhibitor 4-iodopyrazole was chosen for the present study (PDB Entry: 1HDY, shown in Fig. 4a) [49]. The inhibitor 4-iodopyrazole (PYZ) has strong interactions with alcohol dehydrogenase in combination with the oxidized coenzyme NAD+[50]. The N-1 atom is 2.0 Å from the catalytic zinc ion. The pyrazole ring is bound with the side chains of Thr48, Phe93 and the C-3 atom of the nicotinamide ring. The large iodine atom at the C-4 position of the pyrazole ring also has van der Waals contacts with the side-chains of Thr48, Phe93, Leu116 and Leu141. The alcohol dehydrogenase consists of two Zn binding sites, one is catalytic and other is a structural site. The coordination environments for zinc atoms are also shown in Figs. 4b and 4c. In the catalytic binding site, the zinc coordinates with three amino acid residues, Cys46, Cys174, and His 67 and one nitrogen atom from ligand. While the structural zinc ion is coordinated with four cysteine residues Cys97, Cys100, Cys103 and Cys111.
Figure 4.


a) Ribbon drawing of the human β2 Alcohol dehydrogenases ternary complex with NAD+ and 4-iodopyrazole. b) and c) Close up views of the two zinc-binding sites in 1HDY. NAD+ is shown in red. The two zinc centers bound with four cysteines are enclosed in red circles with the zinc atoms as spheres. The other two zinc centers bound with two cysteines, one histidine, and 4-iodopyrazole are enclosed in blue boxes with the zinc atoms as spheres.
1HDY was flagged as a “suspect” PDB protein-ligand complex because of significant clashes between the ligand and protein atoms[12]. In the PDB deposited structure a close contact is found between the C-4 atom of the nicotinamide ring of NAD+ and the N-2 atom of the 4-iodopyrazole, which is one ligand of the catalytic zinc ion. The N-2 atom is 1.94 Å from the C-4 atom. This steric conflict may pose difficulties for docking algorithms and will make it difficult to reproduce the actual binding pose of the ligand. Hence, it leads our interest in further investigation.
The original X-ray diffraction data for human β2 complexed with NAD+ were collected to a resolution of 2.50 Å. In this study, first we repeated CNS/MM refinement based on the PDB deposited structure using different X-ray weighting factors. However, the original force field parameters utilized in the original refinement for the NAD+, 4-idopyrazole and zinc ions were not available, which limited our ability to reproduce the original refinement results. In our approach Engh and Huber's force fields parameters were used for the atoms of protein in the CNS/MM refinement. The topology and parameter files used for the ligands within CNS were obtained from the Hetero-compound Information Centre-Uppsala Server (Hic-Up sever: http://alpha2.bmc.uu.se/hicup/).
It should be noted that the final structures show different geometries in the catalytic zinc-binding site of the metalloprotein when different weighting factors were used in the CNS/MM refinement procedures, which resulted several different conformations of 4-idopyrazole being observed. The structures using weighting factors from 0.2 to 1.0 share similar geometries near the catalytic zinc site. Thus, only the structure obtained at wa= 1.0 is shown in Fig. 5. Significant geometry differences were observed in the structures at wa=0.01(MM001), 0.1(MM01), 1.0(MM1), 2.0(MM2). The results from Table 4 show the different bond lengths between the zinc ion and its coordinating atoms at different weighting factors. The distances are all longer than the ones obtained from the structure deposited in the PDB, especially for the Zn and S (Cys46) distances. The distances between zinc atom and coordinated atoms are getting closer when a large weighting factor is used in both catalytic and structural zinc binding sites. The same trend is observed in calculated R and Rfree values. The crystallographic R value for MM01 are 6% worse than the ones for MM1. The average zinc to sulfur atom distance in the zinc catalytic binding site is 2.78 Å in MM01, which is around 0.3 Å longer than the corresponding distances in MM1.
Figure 5.

The structures derived from CNS/MM X-ray refinement of the human β2 alcohol dehydrogenase ternary complex using different X-ray weighting factors. The carbon atoms are colored green for the corresponding structure at wa=0.01 (MM001); cyan for wa=0.1 (MM01); red for wa=1.0 (MM1); yellow for wa=2.0 (MM2); Structures at other weighting factors are omitted for clarity.
Table 4.
Geometric parameters after CNS/MM refinement at different weighting factors for the catalytic zinc binding site of chain A in human β2 alcohol dehydrogenases for PDB ID: 1HDY
| a) Catalytic zinc binding site | |||||
|---|---|---|---|---|---|
| Distances to Zn | N2/PYZ- C4/NAD |
||||
| wa | S/C46 | S/C174 | N1/PYZ | N/H67 | |
| 0.01(MM001) | 3.04 | 2.98 | 3.05 | 2.63 | 3.58 |
| 0.1(MM01) | 2.81 | 2.76 | 2.61 | 2.60 | 3.33 |
| 0.2(MM02) | 2.73 | 2.65 | 2.50 | 2.57 | 3.27 |
| 0.3(MM03) | 2.69 | 2.59 | 2.45 | 2.51 | 3.26 |
| 0.4(MM04) | 2.66 | 2.54 | 2.42 | 2.49 | 3.19 |
| 0.5(MM05) | 2.64 | 2.51 | 2.40 | 2.48 | 3.17 |
| 0.6(MM06) | 2.64 | 2.48 | 2.38 | 2.46 | 3.14 |
| 0.7(MM07) | 2.62 | 2.45 | 2.37 | 2.45 | 3.13 |
| 0.8(MM08) | 2.60 | 2.42 | 2.36 | 2.44 | 3.11 |
| 0.9(MM09) | 2.59 | 2.40 | 2.35 | 2.43 | 3.08 |
| 1.0(MM1) | 2.59 | 2.38 | 2.34 | 2.43 | 3.06 |
| 2.0(MM2) | 2.53 | 2.24 | 2.27 | 2.41 | 2.87 |
| 3.0(MM3) | 2.50 | 2.18 | 2.24 | 2.37 | 2.72 |
|
| |||||
| crystal | 2.30 | 2.05 | 2.07 | 2.22 | 1.94 |
| b) Structural zinc binding site | ||||
|---|---|---|---|---|
| Distances to Zn | ||||
| wa | S/C97 | S/C100 | S/C103 | S/C111 |
| 0.01(MM001) | 3.01 | 2.93 | 2.94 | 2.89 |
| 0.1(MM01) | 2.81 | 2.74 | 2.76 | 2.77 |
| 0.2(MM02) | 2.71 | 2.66 | 2.65 | 2.73 |
| 0.3(MM03) | 2.66 | 2.62 | 2.60 | 2.70 |
| 0.4(MM04) | 2.63 | 2.59 | 2.57 | 2.68 |
| 0.5(MM05) | 2.61 | 2.56 | 2.54 | 2.67 |
| 0.6(MM06) | 2.60 | 2.53 | 2.52 | 2.66 |
| 0.7(MM07) | 2.57 | 2.51 | 2.50 | 2.65 |
| 0.8(MM08) | 2.56 | 2.50 | 2.48 | 2.64 |
| 0.9(MM09) | 2.55 | 2.49 | 2.47 | 2.63 |
| 1.0(MM1) | 2.54 | 2.47 | 2.46 | 2.62 |
| 2.0(MM2) | 2.49 | 2.40 | 2.38 | 2.56 |
| 3.0(MM3) | 2.47 | 2.36 | 2.34 | 2.53 |
|
| ||||
| Crystal | 2.31 | 2.23 | 2.33 | 2.33 |
Next, the more accurate energy scheme was used in the further refinements starting from CNS/MM refined structures obtained at wa=0.1, 0.7, 1.0, 2.0 (MM01, MM07, MM1, MM2). Considering the computational cost of full QM calculations, we used the QM/MM energy scheme in our refinement protocol, which treats the active site of the protein with QM, while the rest of the protein and the surrounding solvent were treated by MM. The distances between the two zinc centers in chain A and chain B are about 20 Å. We assume that there is no overlap between them. Thus, two QM regions were set up for each chain. The first QM region consisted of the catalytic site of the zinc ion, which includes the NAD+, 4-iodopyrazole, and other side chains, solvent molecules that are in direct contact through either hydrogen bonding or van der Waals interactions. The other QM region consisted only of the structural zinc binding site with its bound amino acid residues. A total of 1340 atoms were included in the QM region. The D&C linear-scaling semi-empirical technique with the PM3 level of theory was employed to efficiently compute the QM energy. AMBER force field parameters were assigned to all other atoms to calculate the energy for the MM region.
Comparing the QM/MM refinement results at same weight factor, but using different initial structures, the R and Rfree values clearly vary after QM/MM re-refinement (see Table 5). In order to avoid errors associated with over weighting the X-ray signal, the structures obtained after QM/MM re-refinement at wa=1.0 (MM01Q1 and MM1Q1) were selected for detailed comparison. The corresponding R and Rfree factors are shown in bold in Table 5. The R and Rfree factors for MM01 are the poorest when compared to the results using other starting structures. However, from Fig. 6a, it can be seen that the distances between the zinc atom and other bound atoms are within the same range. After the QM/MM re-refinement, the Zn-SG (Cys174) bond lengths varies only from 2.20 to 2.24 Å, Zn-N1 (PYZ) bond lengths are between 2.05 and 2.07 Å, Zn-NE2 (His67) bond length are between 2.10 and 2.15 Å, while the Zn-SG (Cys46) bond lengths are 2.38 to 2.43 Å (see Table 6). The geometric parameters for the structural zinc binding site are very similar after QM/MM re-refinements. The major geometric difference between these re-refined structures is the position of the pyrazole ring, shown in Fig. 6, which results in different contacts with atoms from NAD+. The distances between the carbon atom from the nicotinamide ring of NAD+ and the N-2 atom from PYZ changed from 2.27 to 2.77 Å. When compared to the reported distance in the deposited PDB structure, no steric conflicts were observed.
Table 5.
The calculated R and Rfree values for human β2 alcohol dehydrogenases after QM/MM re-refinement on four selected starting CNS/MM refined Structures.
| wa=0.1(MM01) | wa=0.7(MM07) | wa=1.0(MM1) | wa=2.0(MM2) | |||||
|---|---|---|---|---|---|---|---|---|
| wa | R | Rfree | R | Rfree | R | Rfree | R | Rfree |
| 0.01(Q001) | 0.2831 | 0.2890 | 0.2375 | 0.2585 | 0.2296 | 0.2562 | 0.2191 | 0.2494 |
| 0.1(Q01) | 0.2798 | 0.2884 | 0.2339 | 0.2586 | 0.2264 | 0.2553 | 0.2152 | 0.2479 |
| 0.2(Q02) | 0.2763 | 0.2856 | 0.2318 | 0.2585 | 0.2248 | 0.2549 | 0.2158 | 0.2484 |
| 0.3(Q03) | 0.2736 | 0.2846 | 0.2297 | 0.2583 | 0.2230 | 0.2535 | 0.2136 | 0.2478 |
| 0.4(Q04) | 0.2717 | 0.2845 | 0.2275 | 0.2578 | 0.2208 | 0.2527 | 0.2108 | 0.2464 |
| 0.5(Q05) | 0.2616 | 0.2733 | 0.2264 | 0.2576 | 0.2200 | 0.2523 | 0.2111 | 0.2472 |
| 0.6(Q06) | 0.2642 | 0.2782 | 0.2253 | 0.2575 | 0.2191 | 0.2526 | 0.2106 | 0.2476 |
| 0.7(Q07) | 0.2614 | 0.2767 | 0.2244 | 0.2571 | 0.2184 | 0.2521 | 0.2090 | 0.2464 |
| 0.8(Q08) | 0.2624 | 0.2796 | 0.2231 | 0.2573 | 0.2175 | 0.2527 | 0.2082 | 0.2446 |
| 0.9(Q09) | 0.2606 | 0.2787 | 0.2228 | 0.2567 | 0.2170 | 0.2517 | 0.2076 | 0.2460 |
| 1.0(Q1) | 0.2487 | 0.2688 | 0.2224 | 0.2564 | 0.2158 | 0.2520 | 0.2069 | 0.2459 |
| 2.0(Q2) | 0.2226 | 0.2571 | 0.2147 | 0.2559 | 0.2101 | 0.2517 | 0.2024 | 0.2440 |
| 3.0(Q3) | 0.2150 | 0.2564 | 0.2087 | 0.2561 | 0.2067 | 0.2513 | 0.2009 | 0.2433 |
| 4.0(Q4) | 0.2051 | 0.2530 | 0.2050 | 0.2557 | 0.2033 | 0.2514 | 0.1977 | 0.2437 |
Figure 6.


a) Selected ball and stick models of QM/MM re-refined (selected weighting factor wa=1.0) Human β2 Alcohol Dehydrogenase Ternary complex structures of the catalytic zinc binding site in Chain A starting from different CNS/MM refined structures, MM01Q1 (Green for carbon atoms), MM07Q1 (Cyan for carbon atoms) and MM1Q1 (Yellow for carbon atoms), MM2Q1 (Pink for carbon atoms). b) 2Fo − Fc electron density maps for the catalytic zinc binding site obtained from different CNS/MM starting structures.
Table 6.
Comparison of geometric parameters for the catalytic binding site in chain A after selected QM/MM re-refinements for PDB ID: 1HDY.
| a) Catalytic binding site | |||||
|---|---|---|---|---|---|
| ID | Distances to Zn |
N2/PYZ- C4/NAD |
|||
| S/C46 | S/C174 | N1/PYZ | N/H67 | ||
| MM01Q1 | 2.43 | 2.20 | 2.05 | 2.10 | 2.27 |
| MM07Q1 | 2.43 | 2.24 | 2.07 | 2.15 | 2.87 |
| MM1Q1 | 2.40 | 2.21 | 2.07 | 2.13 | 2.77 |
| MM2Q1 | 2.38 | 2.20 | 2.06 | 2.13 | 2.51 |
| b) Structural binding site | ||||
|---|---|---|---|---|
| Distances to Zn | ||||
| S/C97 | S/C100 | S/C103 | S/C111 | |
| MM01Q1 | 2.45 | 2.35 | 2.31 | 2.32 |
| MM07Q1 | 2.43 | 2.34 | 2.31 | 2.39 |
| MM1Q1 | 2.42 | 2.33 | 2.30 | 2.37 |
| MM2Q1 | 2.43 | 2.33 | 2.29 | 2.35 |
Fig. 6b shows the comparison of the electron density map from the highlighted QM/MM re-refined structures (MM01Q1 and MM1Q1). The iodine atom is placed in the middle of the strong spherical density in both maps. However, due to limitation inherent in the medium or low resolution experimental data connected to this strong spherical density is not a flat density to show an accurate position of the pyrazole ring. This brings two possible positions of pyrazole ring in one structure, as shown in Fig. 6a.
3. Cytidine Deaminase Transition State Analog Complexes
The zinc-bound water is a critical component for many catalytic zinc sites due to its ability to be ionized to zinc-bound hydroxide, which can generate a nucleophile to catalysis an electrophilic substrate. A zinc-activated hydroxide ion attacks a purine or pyrimidine ring to form a tetrahedral transition state. This reaction is thermodynamically favorable and can be catalyzed by cytidine deaminase (CDA) with a dissociation constants of ~10−16 M[51]. In order to better understand the catalytic mechanism, several X-ray crystal structures of stable intermediate states have been published using different inhibitors[52-54]. The CDA transition-state analog zebularine 3,4-hydrate or ZEB and the dihydro analog 3,4-dihydrozebularine, or DHZ show difference by the presence of a “trapped” water molecule in the complex with the 3,4-dihydro analog[52].
The X-ray crystal structure of the enzyme complexed with DHZ and ZEB-H2O (PDB entry: 1CTT and 1CTU) led to mechanistic insights into the importance of interactions between the zinc-bound hydroxyl group and model substrates. The catalytic zinc is ligated to the sulfur atoms of Cys129 and Cys132, the ND1 nitrogen of His102, and a substrate water molecule in tetrahedral coordination geometry. The unfavorable van der Waals interactions between DHZ and the trapped water molecule and the extensive hydrogen bonding interactions between ZEB-H2O hydroxyl group and residues from CDA make contributions to the difference of binding free energy between DHZ and ZEB-H2O in CDA complexes
Lewis et al. carried out the most comprehensive theoretical studies of the CDA active site based on a large active site model using the PM3 Hamiltonian[55, 56]. However, the early stage of the reaction mechanism proposed by density functional theory is different from that previously reported using semiempirical methods[57]. The initial structures of the former theoretical models were based upon the crystal structure of the CDA-inhibitor complex 1CTT from the Protein Data Bank. The zinc-water and zinc-Sγ distances are shorter in the 1CTT structure, and there is a close contact between the DHZ and the trapped water molecule. This structure was identified as having an unusually close contact[12] and we suspect that this contact was present due to the empirically modified stereochemical constraints for the zinc active site groups that were used in the structure refinement[52].
In order to improve the local geometry of the CDA active site and to obtain better initial structures for future active site models, we used our QM/MM procedure to re-refine 1CTT. The QM region included the Zn atom, Cys129, Cys132, His102 and DHZ plus one O atom and other residues within hydrogen bond and van der Waals distance of the active site groups. 557 atoms are included in the QM region. Figure 7 shows the structure of protein and highlights the zinc active site. The protonation status of metal-bound water molecules in the active site is a key point for the reaction mechanism of zinc metalloenzymes[58, 59]. However, in medium to low resolution protein structures it's impossible to determine the protonation states of zinc-bound water molecules. Different protonation states of molecules could result significant differences in the bond lengths and angles of the surrounding atoms. Therefore, different protonation states of the oxygen atoms and surrounding residues should be explored to fully understand the reaction mechanism of CDA. Generally for zinc enzymes, most experiments and theoretical calculations suggest that the zinc coordination in the active site of CDA most likely involved direct attack of OH− rather than H2O[60, 61]. Thus, only one protonation state of the active site was used in the refinement (zinc-hydroxide), and is shown in Fig. 7a.
Figure 7.

a) The protonation pattern of the active site in CDA and the QM region used in X-ray refinement. b) The active site QM region within the context of the protein is represented as sticks.
During the re-refinement procedure, we introduced PM3 semiempirical QM energy restraints for the QM region and MM energy restraints with the AMBER force field for the MM region of CDA. For comparison, we also carried out refinement runs using the MM energy restraints with Engh and Huber parameters under different weighting factors. The working R and Rfree values based on the structures after refinement with QM/MM and MM energy restraints are given in Table 7. It can be seen that at the resolutions of 2.2Å, the R and Rfree values for the MLF target from QM/MM energy restraint are always lower than the ones using purely MM energy restraints.
Table 7.
The calculated R and Rfree factors after QM/MM re-refinement and the MM refinement Using Engh-Huber parameters corresponding to different X-ray weighting factors for PDB ID: 1CTT.
| wa | QM/MM | MM | ||
|---|---|---|---|---|
| R | Rfree | R | Rfree | |
| 0.01 | 0.2348 | 0.2454 | 0.2610 | 0.2651 |
| 0.1 | 0.1964 | 0.2083 | 0.2189 | 0.2352 |
| 0.2 | 0.1963 | 0.2107 | 0.2073 | 0.2248 |
| 0.3 | 0.1914 | 0.2061 | 0.2009 | 0.2184 |
| 0.4 | 0.1901 | 0.2057 | 0.1979 | 0.2158 |
| 0.5 | 0.1916 | 0.2089 | 0.1958 | 0.2142 |
| 0.6 | 0.1881 | 0.2045 | 0.1942 | 0.2131 |
| 0.7 | 0.1875 | 0.2040 | 0.1930 | 0.2123 |
| 0.8 | 0.1873 | 0.2070 | 0.1921 | 0.2117 |
| 0.9 | 0.1863 | 0.2041 | 0.1912 | 0.2111 |
| 1.0 | 0.1870 | 0.2024 | 0.1905 | 0.2106 |
| 2.0 | 0.1833 | 0.2052 | 0.1863 | 0.2083 |
Figs. 8a and b display the re-refined structures of the active sites with the Fo − Fc difference electron density maps superimposed with different refinement procedures. At low X-ray constraints wa=0.01, the negative contours (red) lie above the pymidine rings and surround the Zn-SG (Cys132) and Zn-O bond. The positive contours (blue) lie between the pyrimidine ring and the Zn, and also between the O atom and Oε1 of Glu104 in both refinements. As can be seen from Fig. 8, both positive and negative electron density peaks around the active site in residual Fo − Fc difference Fourier maps are minimized as the weighting factor increases. At wa=0.1 negative contours lie above the pyrimidine rings and the Zn atom, but when the weighting factor wa reaches 0.8, no significant density peak over 3σ were found at the active site in the difference Fourier map after QM/MM refinement.
Figure 8.
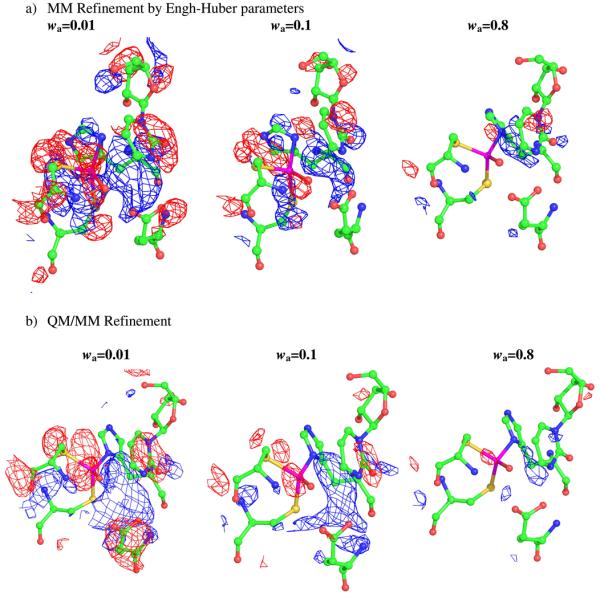
The geometries of the active site of CDA at the end of the refinement runs by QM/MM and MM, together with the electron density maps, Fo − Fc difference electron density maps, contoured at 3σ (blue mesh), and −3σ (red mesh), are shown.
When the X-ray constraints are relatively large, all the re-refined structures remain close to one other (wa > 0.2). The only major difference observed was the distance between Zn atom and the ND1 of His 102. The geometry parameters are listed in Table 8. When the weight of the X-ray restraint is reduced below 0.2, the geometry of the active site shows significant deviations between the QM/MM and MM only refined structures. At wa=0.1, the distance between the Zn and N atom from His102 is 2.69 Å in the MM refinement, while this distance remains at 2.03-2.04 Å in the QM/MM refinement. The difference becomes more significant at wa=0.01. Hence, the R and Rfree values are higher in the MM refinement when using the lower X-ray restraints. In the original crystal structure, there is a very close contact between the C4 atom in DHZ and the zinc-bound oxygen atom (2.48 Å). In the QM/MM energy restraint refinement, this close contact was removed even when large weighting factors were used. The pyrimidine ring of DHZ refines to a position where the C4 atom is ~0.2 Å further away from the O atom using QM/MM relative to a MM only refinement using wa=0.8.
Table 8.
Selected results for the active site of CDA after re-refinements at different weighting factors for PDB ID: 1CTT.
| Zn-O | Zn- SG(129) |
Zn- SG(132) |
Zn- N(102) |
O- C4(DHZ) |
||
|---|---|---|---|---|---|---|
| wa=0.01 | QM/MM(OH−) | 1.95 | 2.43 | 2.36 | 2.03 | 3.21 |
| MM | 2.38 | 2.74 | 2.68 | 2.91 | 3.15 | |
| wa=0.1 | QM/MM(OH−) | 1.96 | 2.44 | 2.32 | 2.04 | 2.76 |
| MM | 2.26 | 2.57 | 2.41 | 2.69 | 2.87 | |
| wa=0.8 | QM/MM(OH−) | 1.99 | 2.44 | 2.23 | 2.03 | 2.54 |
| MM | 2.01 | 2.45 | 2.21 | 2.69 | 2.49 | |
| Crystal | 1.84 | 2.42 | 2.11 | 2.02 | 2.48 |
There is 10.1 kcal/mol binding energy difference between CDA complexed with ZEBH2O and with DHZ[51]. However, the bad steric conflict or unfavorable van der Waals interaction may contribute several kilocalories per mole in the free energy binding calculations[52]. By introducing QM/MM or QM refinement these apparently unfavorable close contacts are removed, thereby, providing a better model for future theoretical studies.
Conclusion
When building and refining a model of a biomacromolecule based on crystallographic data, errors are unavoidable due to the limited resolution and poor phase information. Incomplete or incorrect models can lead to misleading insights into structure and function of biological molecules and provide poor starting point from which to begin computational studies. More advanced refinement protocols should be used in the refinement process of a structure if unusual features are found.
QM/MM has proven to be a valuable method in the study of the structure and function of biomacromolecules[62]. We describe its use in the X-ray refinement of zinc containing metalloproteins and show that QM/MM based X-ray refinement provides significant improvement in the coordination environment of the zinc ion and its associated ligands. We showed three examples in the present manuscript where QM/MM based refinement yielded a superior description of the crystal structured based on R and Rfree values and inspection of the zinc coordination environment. This present study yielded several interesting observations about zinc metalloenzyme structure and the refinement process in general. For example, the weighting factor used can have a critical effect on preferred conformations observed for metal bound ligands and the value used should be carefully selected. The QM/MM approach appears to be less sensitive to the weighting factor used than the purely MM based refinement process. However, there are still some metalloproteins with very short or long bond distances between the metal ion and coordinated atoms in the PDB, such as 1I50, 1I8Z etc[63, 64]. Unfortunately, for those structures, the experimental structural factors do appear to be unavailable. We believe QM/MM or QM refinement procedures would also improve the quality of these structures as well. Indeed, the use of QM/MM refinement for most metalloproteins seems to be a promising way to proceed by using semiempirical or ab initio methods due to the dearth of accurate force field models of metal cluster found in proteins.
Acknowledgments
We thank the NIH (GM044974 and GM079899) for financial support of this research. Computing support from the University of Florida High Performance Computing Center is gratefully acknowledged.
Footnotes
Publisher's Disclaimer: This is a PDF file of an unedited manuscript that has been accepted for publication. As a service to our customers we are providing this early version of the manuscript. The manuscript will undergo copyediting, typesetting, and review of the resulting proof before it is published in its final citable form. Please note that during the production process errors may be discovered which could affect the content, and all legal disclaimers that apply to the journal pertain.
References
- 1.McCall KA, Huang CC, Fierke CA. J. Nutr. 2000;130:1437s–1446s. doi: 10.1093/jn/130.5.1437S. [DOI] [PubMed] [Google Scholar]
- 2.Parkin G. Chem. Rev. 2004;104:699–767. doi: 10.1021/cr0206263. [DOI] [PubMed] [Google Scholar]
- 3.Holm RH, Kennepohl P, Solomon EI. Chem. Rev. 1996;96:2239–2314. doi: 10.1021/cr9500390. [DOI] [PubMed] [Google Scholar]
- 4.Sommerhalter M, Lieberman RL, Rosenzweig AC. Inorg. Chem. 2005;44:770–778. doi: 10.1021/ic0485256. [DOI] [PubMed] [Google Scholar]
- 5.Brunger AT, Adams PD. Acc. Chem. Res. 2002;35:404–412. doi: 10.1021/ar010034r. [DOI] [PubMed] [Google Scholar]
- 6.Brunger AT. Nature. 1992;355:472–475. doi: 10.1038/355472a0. [DOI] [PubMed] [Google Scholar]
- 7.Tronrud DE, Teneyck LF, Matthews BW. Acta Crystallogr., Sect. A: Found. Crystallogr. 1987;43:489–501. [Google Scholar]
- 8.Hendrickson WA. Method Enzymol. 1985;115:252–270. doi: 10.1016/0076-6879(85)15021-4. [DOI] [PubMed] [Google Scholar]
- 9.Jack A, Levitt M. Acta Crystallogr., Sect. A: Found. Crystallogr. 1978;34:931–935. [Google Scholar]
- 10.Kleywegt GJ, Jones TA. Acta Crystallogr., Sect. D: Biol. Crystallogr. 1998;54:1119–1131. doi: 10.1107/s0907444998007100. [DOI] [PubMed] [Google Scholar]
- 11.Engh RA, Huber R. Acta Crystallogr., Sect. A: Found. Crystallogr. 1991;47:392–400. [Google Scholar]
- 12.Nissink JWM, Murray C, Hartshorn M, Verdonk ML, Cole JC, Taylor R. Proteins: Struct., Funct., Gene. 2002;49:457–471. doi: 10.1002/prot.10232. [DOI] [PubMed] [Google Scholar]
- 13.Lipscomb WN, Strater N. Chem. Rev. 1996;96:2375–2433. doi: 10.1021/cr950042j. [DOI] [PubMed] [Google Scholar]
- 14.Coleman JE. Curr. Opin. Chem. Biol. 1998;2:222–234. doi: 10.1016/s1367-5931(98)80064-1. [DOI] [PubMed] [Google Scholar]
- 15.Vallee BL, Auld DS. Biochemistry. 1990;29:5647–5659. doi: 10.1021/bi00476a001. [DOI] [PubMed] [Google Scholar]
- 16.Jain T, Jayaram B. Proteins: Struct., Funct., Bioinf. 2007;67:1167–1178. doi: 10.1002/prot.21332. [DOI] [PubMed] [Google Scholar]
- 17.Sakharov DV, Lim C. J. Am. Chem. Soc. 2005;127:4921–4929. doi: 10.1021/ja0429115. [DOI] [PubMed] [Google Scholar]
- 18.Elstner M, Cui Q, Munih P, Kaxiras E, Frauenheim T, Karplus M. J. Comput. Chem. 2003;24:565–581. doi: 10.1002/jcc.10201. [DOI] [PubMed] [Google Scholar]
- 19.Deerfield DW, Carter CW, Pedersen LG. Int. J. Quant. Chem. 2001;83:150–165. [Google Scholar]
- 20.Peters M. 2007. Ph.D Thesis. [Google Scholar]
- 21.Li JZ, Qian XG, Sha BD. Structure. 2003;11:1475–1483. doi: 10.1016/j.str.2003.10.012. [DOI] [PubMed] [Google Scholar]
- 22.Ryde U, Nilsson K. J. Am. Chem. Soc. 2003;125:14232–14233. doi: 10.1021/ja0365328. [DOI] [PubMed] [Google Scholar]
- 23.Ryde U. Dalton Trans. 2007;6:607–625. doi: 10.1039/b614448a. [DOI] [PubMed] [Google Scholar]
- 24.Ryde U. Curr. Opin. Chem. Biol. 2003;7:136–142. doi: 10.1016/s1367-5931(02)00016-9. [DOI] [PubMed] [Google Scholar]
- 25.Yu N, Li X, Cui GL, Hayik SA, Merz KM. Protein Sci. 2006;15:2773–2784. doi: 10.1110/ps.062343206. [DOI] [PMC free article] [PubMed] [Google Scholar]
- 26.Brunger AT, Adams PD, Clore GM, DeLano WL, Gros P, GrosseKunstleve RW, Jiang JS, Kuszewski J, Nilges M, Pannu NS, Read RJ, Rice LM, Simonson T, Warren GL. Acta Crystallogr., Sect. D: Biol. Crystallogr. 1998;54:905–921. doi: 10.1107/s0907444998003254. [DOI] [PubMed] [Google Scholar]
- 27.Allen FH. Acta Crystallogr., Sect. B: Struct. Sci. 2002;58:380–388. doi: 10.1107/s0108768102003890. [DOI] [PubMed] [Google Scholar]
- 28.Rulisek L, Solomon EI, Ryde U. Inorg. Chem. 2005;44:5612–5628. doi: 10.1021/ic050092z. [DOI] [PubMed] [Google Scholar]
- 29.Yu N, Yennawar HP, Merz KM. Acta Crystallogr., Sect. D: Biol. Crystallogr. 2005;61:322–332. doi: 10.1107/S0907444904033669. [DOI] [PubMed] [Google Scholar]
- 30.Yu N, Hayik SA, Wang B, Liao N, Reynolds CH, Merz KM. J Chem. Theo. Comput. 2006;2:1057–1069. doi: 10.1021/ct0600060. [DOI] [PMC free article] [PubMed] [Google Scholar]
- 31.Cui GL, Li X, Merz KM. Biochemistry. 2007;46:1303–1311. doi: 10.1021/bi062076z. [DOI] [PubMed] [Google Scholar]
- 32.Case TADDA, Cheatham TE, III., Simmerling CI, Duke RE, Luo R, Crowley M, Walker RC, Zhang W, Merz KM, Wang B, Hayik S, Roitberg A, Seabra G, Kolossvary I, wong KF, Paesani F, Vanicek J, Wu X, Brozell SR, Steinbrecher T, Gohlke H, Yang I, Tan C, Mongan J, Homak V, Cui G, Mathews DH, Seetin MG, Sagui C, Babin V, Kollman PA. San Francisco: 2008. [Google Scholar]
- 33.Dixon SL, Merz KM. J. Chem. Phys. 1996;104:6643–6649. [Google Scholar]
- 34.Dixon SL, Merz KM. J. Chem. Phys. 1997;107:879–893. [Google Scholar]
- 35.Bukau B, Horwich AL. Cell. 1998;92:351–366. doi: 10.1016/s0092-8674(00)80928-9. [DOI] [PubMed] [Google Scholar]
- 36.Misselwitz B, Staeck O, Rapoport TA. Mol. Cell. 1998;2:593–603. doi: 10.1016/s1097-2765(00)80158-6. [DOI] [PubMed] [Google Scholar]
- 37.Laufen T, Mayer MP, Beisel C, Klostermeier D, Mogk A, Reinstein J, Bukau B. Proc. Natl. Acad. Sci. U.S.A. 1999;96:5452–5457. doi: 10.1073/pnas.96.10.5452. [DOI] [PMC free article] [PubMed] [Google Scholar]
- 38.Lian HY, Zhang H, Zhang ZR, Loovers HM, Jones GW, Rowling PJE, Itzhaki LS, Zhou JM, Perrett S. J. Biol. Chem. 2007;282:11931–11940. doi: 10.1074/jbc.M606856200. [DOI] [PubMed] [Google Scholar]
- 39.Banecki B, Liberek K, Wall D, Wawrzynow A, Georgopoulos C, Bertoli E, Tanfani F, Zylicz M. J. Biol. Chem. 1996;271:14840–14848. doi: 10.1074/jbc.271.25.14840. [DOI] [PubMed] [Google Scholar]
- 40.Sha BD, Lee S. D.M. Cyr. Struct. Fold Des. 2000;8:799–807. doi: 10.1016/s0969-2126(00)00170-2. [DOI] [PubMed] [Google Scholar]
- 41.Wu YK, Li JZ, Jin ZM, Fu ZQ, Sha BD. J. Mol. Bio. 2005;346:1005–1011. doi: 10.1016/j.jmb.2004.12.040. [DOI] [PubMed] [Google Scholar]
- 42.Kleywegt GJ, Harris MR, Zou JY, Taylor TC, Wahlby A, Jones TA. Acta Crystallogr. Sect. D: Biol. Crystallogr. 2004;60:2240–2249. doi: 10.1107/S0907444904013253. [DOI] [PubMed] [Google Scholar]
- 43.Stewart JJP. J. Comput. Chem. 1989;10:209–220. [Google Scholar]
- 44.Brothers EN, Suarez D, Deerfield DW, Merz KM. J Comput. Chem. 2004;25:1677–1692. doi: 10.1002/jcc.20086. [DOI] [PubMed] [Google Scholar]
- 45.Auld DS, Bergman T. Cell Mol. Life Sci. 2008;65:3961–3970. doi: 10.1007/s00018-008-8593-1. [DOI] [PMC free article] [PubMed] [Google Scholar]
- 46.Liu HL, Ho Y, Hsu CM. J. Biomed. Sci. 2003;10:302–312. doi: 10.1007/BF02256449. [DOI] [PubMed] [Google Scholar]
- 47.Hammen PK, Allali-Hassani A, Hallenga K, Hurley TD, Weiner H. Biochemistry. 2002;41:7156–7168. doi: 10.1021/bi012197t. [DOI] [PubMed] [Google Scholar]
- 48.Barbosa JARG, Sivaraman J, Li YG, Larocque R, Matte A, Schrag JD, Cygler M. Proc. Natl. Acad. Sci. U.S.A. 2002;99:1859–1864. doi: 10.1073/pnas.022476199. [DOI] [PMC free article] [PubMed] [Google Scholar]
- 49.Hurley TD, Bosron WF, Stone CL, Amzel LM. J. Mol. Biol. 1994;239:415–429. doi: 10.1006/jmbi.1994.1382. [DOI] [PubMed] [Google Scholar]
- 50.Eklund H, Samama JP, Wallen L. Biochemistry. 1982;21:4858–4866. doi: 10.1021/bi00263a005. [DOI] [PubMed] [Google Scholar]
- 51.Frick L, Yang C, Marquez VE, Wolfenden R. Biochemistry. 1989;28:9423–9430. doi: 10.1021/bi00450a027. [DOI] [PubMed] [Google Scholar]
- 52.Xiang SB, Short SA, Wolfenden R, Carter CW. Biochemistry. 1995;34:4516–4523. doi: 10.1021/bi00014a003. [DOI] [PubMed] [Google Scholar]
- 53.Xiang SB, Short SA, Wolfenden R, Carter CW. Biochemistry. 1996;35:1335–1341. doi: 10.1021/bi9525583. [DOI] [PubMed] [Google Scholar]
- 54.Xiang SB, Short SA, Wolfenden R, Carter CW. Biochemistry. 1997;36:4768–4774. doi: 10.1021/bi963091e. [DOI] [PubMed] [Google Scholar]
- 55.Lewis JP, Carter CW, Hermans J, Pan W, Lee TS, Yang WT. Biophys. J. 1998;74:A132–A132. [Google Scholar]
- 56.Lewis JP, Carter CW, Hermans J, Pan W, Lee TS, Yang WT. J. Am. Chem. Soc. 1998;120:5407–5410. [Google Scholar]
- 57.Kedzierski P, Sokalski WA, Cheng HS, Mitchell J, Leszczynski J. Chem. Phys. Lett. 2003;381:660–665. [Google Scholar]
- 58.Xu Q, Guo HB, Gorin A, Guo H. J. Phys. Chem. B. 2007;111:6501–6506. doi: 10.1021/jp0670743. [DOI] [PubMed] [Google Scholar]
- 59.Matsubara T, Ishikura M, Aida M. J. Chem. Inf. Model. 2006;46:1276–1285. doi: 10.1021/ci050479k. [DOI] [PubMed] [Google Scholar]
- 60.Lee TS, Lewis JP, Yang WT. Comput. Mater. Sci. 1998;12:259–277. [Google Scholar]
- 61.Xu D, Guo H, Cui G. J. Am. Chem. Soc. 2007;129:10814–10822. doi: 10.1021/ja072532m. [DOI] [PubMed] [Google Scholar]
- 62.Gao JL, Truhlar DG. Annu. Rev. Phys. Chem. 2002;53:467–505. doi: 10.1146/annurev.physchem.53.091301.150114. [DOI] [PubMed] [Google Scholar]
- 63.Cramer P, Bushnell DA, Kornberg RD. Science. 2001;292:1863–1876. doi: 10.1126/science.1059493. [DOI] [PubMed] [Google Scholar]
- 64.Kim CY, Whittington DA, Chang JS, Liao J, May JA, Christianson DW. J. Med. Chem. 2002;45:888–893. doi: 10.1021/jm010163d. [DOI] [PubMed] [Google Scholar]