

By using three-dimensional MR imaging, we have demonstrated that patients receiving chemotherapy showed reduction of breast density and that the effects were significant after initial treatment with one to two cycles of the doxorubicin and cyclophosphamide regimen.
Abstract
Purpose:
To investigate the change of breast density with quantitative magnetic resonance (MR) imaging in the contralateral normal breast of patients receiving neoadjuvant chemotherapy.
Materials and Methods:
This study was approved by the institutional review board and was HIPAA compliant. Informed consent was obtained. Fifty-four patients with breast cancer (mean age, 47 years; age range, 30–74 years) treated with NAC protocol and enrolled in a breast MR imaging research study were studied. The density in the contralateral normal breast was analyzed by using an MR imaging–based segmentation method. The effect of chemotherapy on the change of density following the doxorubicin and cyclophosphamide (AC) and the AC and taxane regimen was evaluated. The dependence on age was investigated by using a multivariate regression model.
Results:
In patients who underwent both AC and taxane follow-up, the mean percentage of change from the individual’s baseline density was −10% (95% confidence interval: −12.8%, −7.2%) after AC and −12.7% (95% confidence interval: −16%, −9.4%) after AC and taxane. In patients who underwent both follow-up studies after one to two and four cycles of AC, the mean percentage of change was −9.4% (95% confidence interval: −13.5%, −5.3%) after one to two cycles of AC and −14.7% (95% confidence interval: −20.6%, −8.7%) after four cycles of AC. The percentage reduction of density was significantly dependent on age. Patients younger than 40 years had a greater reduction after chemotherapy than patients older than 55 years (P = .01).
Conclusion:
By using three-dimensional MR imaging, patients receiving chemotherapy showed reduction of breast density, and the effects were significant after initial treatment with one to two cycles of the AC regimen.
© RSNA, 2010
Introduction
Neoadjuvant chemotherapy (NAC) has become an important alternative treatment option for breast cancer. NAC can help downstage cancers and render them operable and/or can help facilitate breast conservation surgeries (1–3). In patients with locally advanced breast cancer, NAC is the standard of care, and it has been shown to improve both disease-free and overall survival (4,5). Depending on the treatment protocols, different chemotherapy regimens are used in combination or in a sequential order. Systemic administration of therapeutic agents not only affects the cancer but also other organs, including the ovary and the contralateral normal breast tissues. Impairment of ovarian function induced by the toxicity of chemotherapy has been extensively studied (6–13). Patients who were previously exposed to chemotherapy produced significantly less estradiol than those who were not (6). Chemotherapy-induced impairment of ovarian function is also considered a possible mechanism to further improve the efficacy of chemotherapy through hormonal suppression for patients to achieve a better prognosis (13).
Mammographic density has been proved to be an independent risk factor for breast cancer (14,15), and for women who have had a diagnosis of breast cancer, cancer risk in the contralateral breast is increased (16). Studying the effect of chemotherapy on the density of the contralateral breast may provide useful information for understanding the protective effect of chemotherapy through hormonal suppression due to compromised ovarian function.
Because the ovary secretes sex hormones, which regulates the glandular function of the breast (17,18), it is anticipated that suppression of ovarian function by chemotherapy will induce secondary change in the breast tissue. However, to our knowledge, this has not been previously reported, possibly because of the lack of methods to quantitatively measure the breast density, so that the changes after NAC can be evaluated reliably. Mammography results in projection images, and the measured mammographic density may be dependent on technical factors such as compression level, compression angle, as well as the setting of the mammography acquisition, including voltage and tube current; therefore, it is not suitable for assessing small changes over time (19). A recent review article by Kopans (20) raised concerns about the accuracy of breast density determined by using mammography. We recently have developed a three-dimensional magnetic resonance (MR) imaging–based method for quantitative measurement of breast density, and the method has been demonstrated to have high reproducibility with measurement variations of less than 3%–4% (21). The purpose of this study was to investigate the change of breast density measured with quantitative MR imaging in the contralateral normal breast of patients receiving NAC.
Materials and Methods
Subjects
This study was approved by the Institutional Review Board of the University of California Irvine and was Health Insurance Portability and Accountability Act compliant. The initial enrollment criteria were patients who had biopsy-confirmed breast cancer higher than stage II and would need adjuvant chemotherapy as part of the treatment. They were invited to participate in this research study and received NAC before surgery. The current study was a retrospective review of these patients. The inclusion criteria were patients who also agreed to participate in a research imaging study to undergo serial breast MR imaging during the course of treatment for response monitoring. All patients gave written informed consent for receiving the NAC treatment protocol and gave another consent for participating in the MR imaging study. On the basis of the initial enrollment and the inclusion criteria for this retrospective review, we found a total of 80 patients (mean age, 50 years; age range, 30–79 years) enrolled from 2003 to 2006. Of the initial 80 patients, four patients had infiltrating lobular cancer, one patient had colloid cancer, and 75 patients had invasive ductal cancer. The exclusion criteria were subjects who received the NAC regimens off protocol, subjects who did not undergo follow-up MR imaging during the first-line regimen, subjects with contralateral breast lesions diagnosed at pathologic examination, subjects with extremely fatty breasts, and subjects with poor MR image quality results for density analysis. Both the pathologic results, if any, and MR imaging reports of all patients were reviewed, and only those who did not have pathologically proved lesions (at biopsy) in the contralateral breast were included in this study to investigate the change of density in the normal breast. Five patients received a regimen other than doxorubicin and cyclophosphamide (AC) and taxane, nine did not undergo any post-AC follow-up MR imaging, three had inadequate MR image quality results for breast density analysis, and one had bilateral breast lesions; they were excluded in the analysis. In addition, eight patients who had extremely fatty breasts (percentage of density measured at MR imaging less than 5%) were also excluded. This is because the segmentation of fibroglandular (dense) tissue in patients with very fatty breasts may not be reliable. The segmentation was greatly limited by partial volume averaging (ie, if a pixel contains both dense and fatty tissues, it is difficult to be classified as either one); because the baseline density is low, a small difference in density may lead to a large percentage change. On the basis of these exclusion criteria, a total of 26 patients were not further analyzed. Other than these exclusion criteria, all subjects receiving the treatment protocol and undergoing follow-up MR imaging for analysis were included in this study, and there was no preselection bias.
In the remaining 54 patients (mean age, 47 years; age range, 30–74 years), 46 underwent follow-up MR imaging studies after one or two cycles of AC (follow-up 1) and 27 underwent MR imaging follow-up after four cycles of AC (follow-up 2), and they were referred to as the AC cohort. Among the AC cohort patients, 19 patients had both one to two cycles and four cycles of AC follow-up. Thirty-five patients underwent post-AC follow-up as well as a final follow-up after completing the subsequent taxane regimen, and they were referred to as the AC and taxane cohort. Details of the number of patients, patient ages, and MR imaging follow-up intervals in each cohort are shown in Table 1.
Table 1.
Number of Patients, Patient Age, and MR Imaging Follow-up Intervals in the AC and AC and Taxane Cohorts
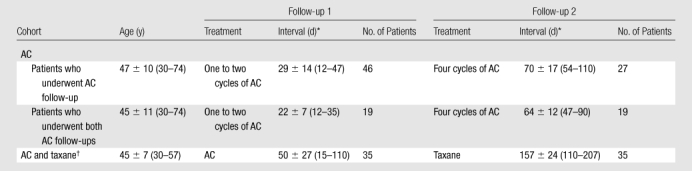
Note.—Unless otherwise indicated, data are means ± standard deviations, with ranges in parentheses.
Interval is days after starting chemotherapy.
Patients in the AC and taxane cohort underwent AC and AC and taxane follow-up.
Twenty subjects in this study have been reported in an earlier study (22) of MR spectroscopy for evaluation of the response of breast cancer to NAC. The change in the breast density measured from the contralateral normal breast has never been reported.
Treatment Protocol
Biweekly AC was given as the first-line regimen. After the first two cycles of AC treatment, patient response was evaluated by an oncologist by using all information available at that time, including clinical examination results, imaging results, patient tolerability, and so forth, and the oncologist determined whether the patient should receive two additional cycles of AC or be switched to a taxane-based regimen. The second-line taxane-based regimen consisted of paclitaxel or nanoparticle albumin-bound paclitaxel combined with carboplatin. Patients with human epidermal growth factor receptor 2 positive tumors also received trastuzumab (Herceptin; Genentech, South San Francisco, Calif) with taxane. Some patients with human epidermal growth factor receptor 2 negative tumors also received bevacizumab (Avastin; Genentech). Of the 35 patients in the AC and taxane cohort, 24 received trastuzumab, seven received bevacizumab, and four did not receive either trastuzumab or bevacizumab.
MR Imaging and Follow-up
All MR imaging studies were performed with a 1.5-T MR imager (Eclipse; Philips Medical Systems, Best, the Netherlands) with a four-channel phased-array bilateral breast coil. The imaging acquisition protocol included precontrast T1-weighted imaging and bilateral dynamic contrast material–enhanced imaging by using a three-dimensional spoiled gradient-recalled acquisition in the steady state (SPGR) (radiofrequency–Fourier-acquired steady-state technique [RF-FAST]) pulse sequence. Thirty-two axial images covering both breasts were acquired. The unenhanced three-dimensional SPGR (RF-FAST) T1-weighted images without fat suppression (repetition time, 8.1 msec; echo time, 4.0 msec; flip angle, 20° matrix size, 256 × 128; field of view, 38 cm; section thickness, 3–4 mm) were used for measurement of breast density. All patients underwent baseline breast MR imaging examination prior to NAC and one to five follow-up MR imaging studies during the course of treatment.
Breast Density Measured with MR Imaging–based Method
The quantification of breast density change in the contralateral breast was performed (K.N., who had 4 years of experience in breast MR imaging) by using a three-dimensional MR imaging–based method which was developed earlier by our group. This method has small measurement errors, with intraoperator variation of 2.8% and interoperator variation of 3.8% (21). The method used computer-assisted algorithms to segment the breast and the fibroglandular tissue. The main breast segmentation procedures consisted of the following: (a) performing an initial V-shaped cutting by using three body landmarks to determine the posterior cutoff points of breast in the lateral boundary, (b) applying a fuzzy c-means–based segmentation algorithm with the B-spline curve fitting to obtain the breast boundary, and (c) applying dynamic searching to exclude the skin along the breast boundary. After the breast was segmented out, the total breast volume was calculated. For fibroglandular tissue segmentation, the adaptive fuzzy c-means algorithm was applied for bias field correction to remove image signal intensity nonuniformities and for segmentation of the fibroglandular tissue from the surrounding fatty tissue. After completing the segmentation from all two-dimensional imaging sections, the volume of fibroglandular tissue was calculated, and the percentage of density was obtained by normalizing to the total breast volume.
Statistical Analysis
Because there were high interpatient variations, statistical analysis was performed on the basis of the percentage of change in each individual patient compared with her baseline density. The multivariate regression model then was used to correlate the measured density changes with age, chemotherapy regimens, and the baseline percentage of breast density. The distributions of all variables (age, baseline density, and the percentage of change at follow-up study compared with the baseline) were tested by using the Kolmogorov-Smirnov test, and, if not normally distributed, they were transformed to normal distribution before performing statistical testing.
The two-stage analysis approach was used in the study. First, for each patient, the change of density after one to two cycles of AC, four cycles of AC, or AC and taxane compared with the baseline was fitted by using a linear regression model, and the obtained slope and intercept were then used in the second-stage analysis by using a multivariate regression model. For the 54 subjects, there were two to five measurements per subject, for a total of 180 measurements acquired. Because the measurements over time for each patient were correlated, we applied the general linear mixed-effects model with restricted maximum likelihood criterion for a secondary analysis. A series of general linear mixed models were formulated to fit the density time-course data during chemotherapy, and the suitability of each model was evaluated by using Akaike information criteria. Three general models were used: random intercept model, random slope model, and random intercept with random slope model. Age, treatment regimen (AC or AC and taxane), and treatment time (baseline, follow-up 1, or follow-up 2) were treated as fixed variables to evaluate the change of densities over time. The models with subject-specific intercepts had improved performance compared with models with fixed intercept on the basis of Akaike weightings, and this suggests that subject-to-subject normalization is needed. As such, we normalized the posttherapy breast density to each individual’s baseline density to calculate percentage of changes and repeated the analysis.
Because we did not collect information about the menopausal status of all patients, we further chose to compare two groups of patients that are commonly agreed to be premenopausal (<40 years) and postmenopausal (>55 years). The Fisher exact test was used to compare the density change rate (increase or decrease) between two extreme age groups (<40 and >55 years). The significance level was set at a P value of less than .05 in all analysis. The post hoc power analysis was performed to evaluate the power (PASS 2005; NCSS, Kaysville, Utah). All other statistical analyses were performed by using software (SPSS, version 15.0; SPSS, Chicago, Ill).
Results
Overall AC and Taxane Effect
In the 35 patients in the AC and taxane cohort, the average percentage of change after AC treatment was −10.0%, which was significantly lower than the baseline (P = .001) (Table 2). After taxane treatment, the average percentage of change further decreased to −12.7%, which was significant compared with the baseline (P = .001), but not significant compared with the density before taxane treatment (P = .29). However, post hoc power analysis showed that a sample size of 35 achieves only 34% power to reject the hypothesis. To reach 80% power, we would need 126 cases.
Table 2.
Group MR Imaging Percentage of Density and Percentage Reduction in Each Patient Compared with Her Baseline in AC and Taxane Cohort
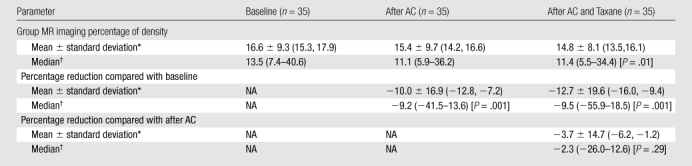
Note.—NA = not applicable.
Data in parentheses are 95% confidence intervals.
Data in parentheses are ranges.
AC Dose Effect
The mean percentage reduction after one to two cycles of AC was −8.0% (P < .001), and the mean percentage reduction after four cycles of AC was −11.3% (95% confidence interval: −13.9, −8.7%), which was significant compared with the baseline density (P < .001) (Table 3).
Table 3.
Group MR Imaging Percentage of Density and Percentage Reduction in Each Patient Compared with Her Baseline in the AC Cohort
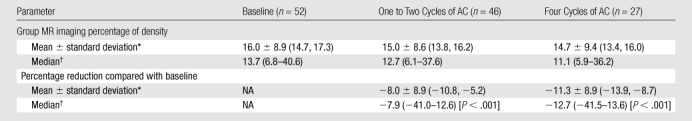
Note.—NA = not applicable.
Data in parentheses are 95% confidence intervals.
Data in parentheses are ranges.
In the 19-patient cohort with follow-up at both one to two and four cycles of AC, the mean percentage of change after one to two cycles of AC compared with the baseline density was −9.4% (P = .006), and the mean percentage reduction after four cycles of AC compared with the baseline density was −14.7% (P = .002) (Table 4). When the density after four cycles of AC was compared with the density after one to two cycles of AC, the mean percentage reduction was −5.3% (P = .93). However, our post hoc power analysis to evaluate the measured difference between after one to two cycles and after four cycles of AC showed that a sample size of 19 achieves only 13% power to reject the hypothesis that the density is not further decreased with additional AC treatment. To reach 80% power, we would need 422 cases.
Table 4.
Group MR Imaging Percentage of Density and Percentage Reduction in Each Patient Compared with Her Baseline in the AC Cohort Patients Who Underwent Follow-up after One to Two Cycles and Four Cycles of AC
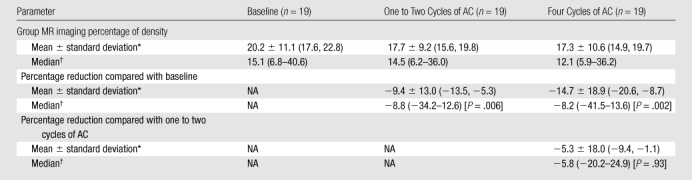
Note.—NA = not applicable.
Data in parentheses are 95% confidence intervals.
Data in parentheses are ranges.
Association of Density Change with Age
The association with age was analyzed by using the 46 patients who underwent one to two cycles of AC follow-up. The results show that the baseline density was strongly dependent on age (Fig 1a). The percentage of change normalized to the baseline density was also significantly dependent on age (P = .01) (Fig 1b).
Figure 1a:

(a) Graph shows relationship between baseline (B/L) MR imaging percentage of density and age. Patients who underwent one-to-two AC-cycle follow-up MR imaging were analyzed. A linear regression fitting indicates a significant correlation with age (r = −0.4, P = .004). Fitting by using other nonlinear regression models also suggests a significant negative correlation. (b) Graph shows percentage of change normalized to the baseline density is significantly dependent on age (P = .01, multivariate regression analysis). All 11 patients younger than 40 years showed decreased density. Of the seven postmenopausal patients older than 55 years, four patients showed increased density and three showed decreased density. The difference was significant when compared by using the Fisher exact test (P = .01).
Figure 1b:

(a) Graph shows relationship between baseline (B/L) MR imaging percentage of density and age. Patients who underwent one-to-two AC-cycle follow-up MR imaging were analyzed. A linear regression fitting indicates a significant correlation with age (r = −0.4, P = .004). Fitting by using other nonlinear regression models also suggests a significant negative correlation. (b) Graph shows percentage of change normalized to the baseline density is significantly dependent on age (P = .01, multivariate regression analysis). All 11 patients younger than 40 years showed decreased density. Of the seven postmenopausal patients older than 55 years, four patients showed increased density and three showed decreased density. The difference was significant when compared by using the Fisher exact test (P = .01).
All 11 patients younger than 40 years showed decreased density. In contrast, among the seven postmenopausal patients older than 55 years, four showed increased density and three showed decreased density (P = .01) (Fig 2).
Figure 2a:
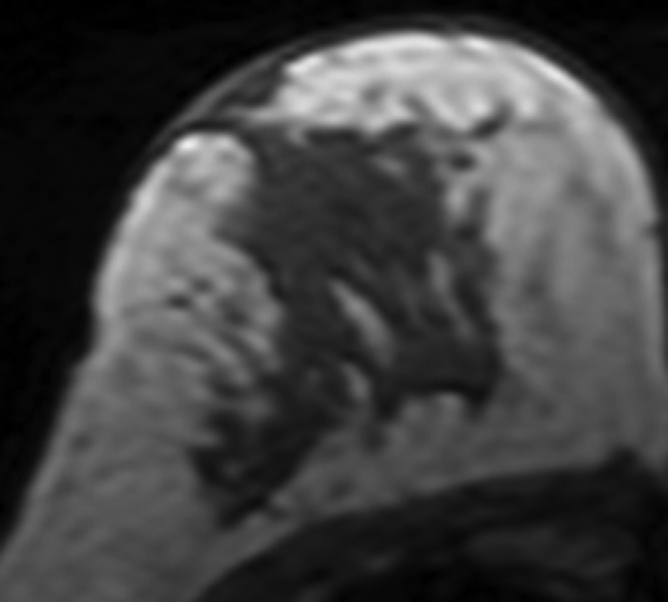
MR images in 41-year-old woman with invasive ductal cancer in the left breast. Images from the normal right breast obtained at (a) baseline MR imaging, (b) after two cycles of AC, (c) after two cycles of AC plus one cycle of taxane, and (d) the last MR imaging after two cycles of AC and three cycles of taxane. The density reduction at all follow-up MR imaging can be noted visually. The percentage reduction compared with the baseline density is 31% after two cycles of AC, 35% after two cycles of AC and one cycle of taxane, and 39% after completing the NAC treatment.
Figure 2b:
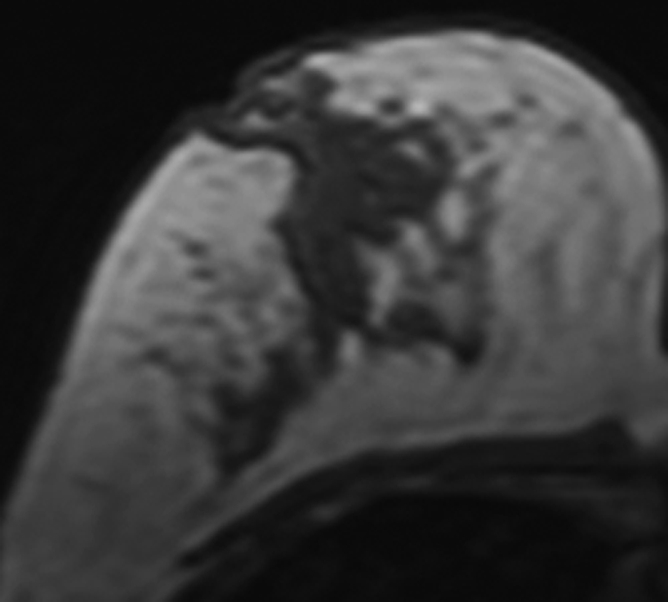
MR images in 41-year-old woman with invasive ductal cancer in the left breast. Images from the normal right breast obtained at (a) baseline MR imaging, (b) after two cycles of AC, (c) after two cycles of AC plus one cycle of taxane, and (d) the last MR imaging after two cycles of AC and three cycles of taxane. The density reduction at all follow-up MR imaging can be noted visually. The percentage reduction compared with the baseline density is 31% after two cycles of AC, 35% after two cycles of AC and one cycle of taxane, and 39% after completing the NAC treatment.
Figure 2c:
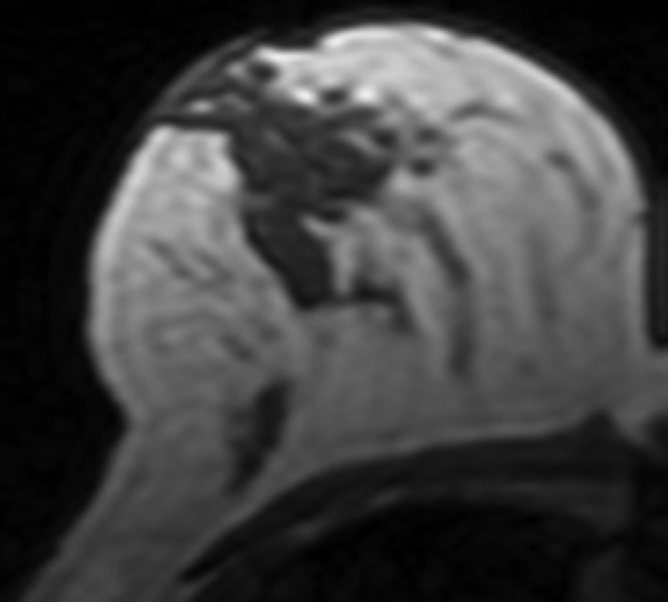
MR images in 41-year-old woman with invasive ductal cancer in the left breast. Images from the normal right breast obtained at (a) baseline MR imaging, (b) after two cycles of AC, (c) after two cycles of AC plus one cycle of taxane, and (d) the last MR imaging after two cycles of AC and three cycles of taxane. The density reduction at all follow-up MR imaging can be noted visually. The percentage reduction compared with the baseline density is 31% after two cycles of AC, 35% after two cycles of AC and one cycle of taxane, and 39% after completing the NAC treatment.
Figure 2d:
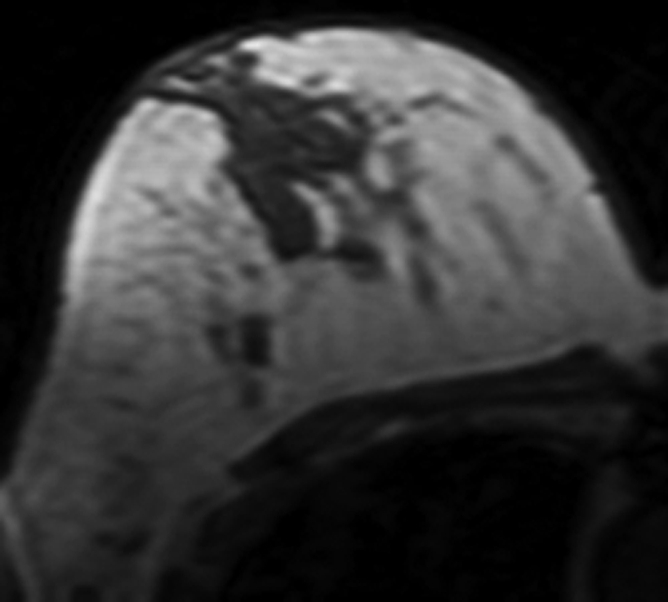
MR images in 41-year-old woman with invasive ductal cancer in the left breast. Images from the normal right breast obtained at (a) baseline MR imaging, (b) after two cycles of AC, (c) after two cycles of AC plus one cycle of taxane, and (d) the last MR imaging after two cycles of AC and three cycles of taxane. The density reduction at all follow-up MR imaging can be noted visually. The percentage reduction compared with the baseline density is 31% after two cycles of AC, 35% after two cycles of AC and one cycle of taxane, and 39% after completing the NAC treatment.
Discussion
Breast density (or mammographic density) is associated with the amount of breast stroma and nonepithelial and epithelial cells. Change of breast density after hormonal replacement therapy has been extensively investigated. Change of density after chemoprevention has been reported in a number of publications, and most studies showed consistent reduction of breast density in premenopausal women (23–25). The change of fibroglandular tissue after chemotherapy was rarely studied. In one study, Toledano et al (26) showed that concurrent chemotherapy and radiation therapy was more likely to result in breast atrophy than sequential therapy.
Breast density is an independent risk factor for breast cancer (14,15,27–29), and there have been efforts to build breast density into the risk model to better predict a woman’s lifetime risk (30,31). For women who have had a diagnosis of breast cancer, cancer risk in the contralateral breast is increased. The cumulative incidence of contralateral breast cancer at 20 years was 15.4% (16). This risk among women who had a diagnosis at an age younger than 50 years had a cumulative probability of nearly 40% after 15 years (32). However, our current understanding about the increased cancer risk in the contralateral breast of patients with cancer was based on population study. More knowledge about the change of breast density in the contralateral normal breast of patients receiving chemotherapy may help us understand the protecting effect of chemotherapy on reducing the contralateral cancer risk, and it also may help establish imaging markers for predicting the contralateral cancer risk in each individual patient. Our study provided some preliminary results. We applied the method that we developed by using a comprehensive approach for analysis of breast density on the basis of three-dimensional MR imaging (21). With a small measurement variation, our method allowed for longitudinal evaluation of small breast density changes over time.
Chemotherapy may directly damage the normal breast tissues and cause decreased density. If so, we would find similar effects regardless of age. However, we found that the percentage decrease in breast density was more prominent in younger patients (<40 years), and in patients older than 55 years, there was no significant effect. (Of seven patients, four had increased and three had decreased density.) It was reasonable to assume that all patients younger than 40 years were premenopausal, and all patients older than 55 years were postmenopausal. Because the treatments and MR imaging study procedures were the same, the results suggest that the effect is likely to be mediated through suppression of ovarian function induced by the toxicity of chemotherapeutic agents. This is supported by the extensive studies on chemotherapy-induced amenorrhea (6–13). On the basis of the literature, estrogen and progesterone secreted by the ovary is known to increase mammographic density (17,18). Specifically, the role of progesterone on breast density has been studied extensively in recent years. There is higher mammographic density in the luteal phase of the menstrual cycle, when the progesterone level increases, compared with the follicular phase (33–35). In studies on the increased cancer risk associated with hormonal replacement therapy, the mammographic density was shown to have a greater increase when using combined estrogen and progestin therapy compared with using estrogen alone (36–38). These results support the association of breast density with ovarian function.
The incidence of chemotherapy-induced amenorrhea is related to age of patients, as well as the specific chemotherapeutic agents and the total dose administered (6,8,12). Age of younger than 40 years was associated with increased risk of chemotherapy-induced amenorrhea (6,10). Women younger than 40 years were more likely to resume menstruation, whereas in older women the amenorrhea was more likely to be irreversible (6,10,12,13). This is most likely because there are fewer active ovarian follicles with increasing age. Various chemotherapy agents, especially in the alkylating category, have been associated with premature ovarian failure (11–13). Our results showed that the breast density was reduced significantly after one to two cycles of AC treatment, which suggests that the effect of AC on ovarian function was rapid. It might be possible that the breast density has shown a substantial reduction after one to two cycles of AC and left little room for further reduction after more cycles of AC treatment; however, our sample size was not sufficient to determine if further cycles of chemotherapy have continued substantial effect on breast density. Unfortunately, investigators of most studies related to chemotherapy-induced impairment in ovarian function evaluated patients after completing four cycles of AC, and we could not find literature results to support the early effect in ovarian function after one to two cycles of AC (6,7,13).
The current standard-of-care neoadjuvant regimens include anthracyclines (such as doxorubicin), alkylating agents (such as cyclophosphamide), and taxane, either in sequence or in combination; it is therefore difficult to determine the contribution of the taxane to the induction of amenorrhea. Most existing data were reported in small studies, and the results were conflicting (6,7,13). Our results showed that the breast density after AC and taxane was not further reduced to a significant level compared with the breast density prior to taxane administration; however, our study was limited by small sample size, with only 34% power to detect such a difference. Chemotherapy-induced ovarian function suppression has been reported to be associated with a better disease-free survival in premenopausal patients with estrogen receptor-positive cancers, but not in those with estrogen receptor-negative cancers (9). A review (39) showed that adjuvant chemotherapy resulted in a much larger benefit in younger women than in older women, and it was postulated that part of the benefit came from ovarian ablation induced by chemotherapeutic agents. Details of how the benefit occurs or how to evaluate this benefit are, however, not clear. Similar to results of a recent report (40) suggesting that change of breast density may predict the efficacy of chemoprevention in asymptomatic high-risk women, it may be possible that change of breast density after chemotherapy may be used as a biomarker to predict the protection effect associated with ovarian ablation in young patients receiving chemotherapy. Our study demonstrated a method that can be used to investigate this effect and provided some preliminary results to prove feasibility, but further studies are needed to develop the role of breast density for predicting this protection benefit effect in reducing cancer risk.
This study had several limitations. This was a retrospective study design with a small number of patients. The studied subjects came from a research breast MR imaging database, which might not represent the general breast cancer population who received NAC. In our study, older patients showed less decreased density after chemotherapy than younger patients (<40 years), and the postmenopausal patients (>55 years) did not show significant changes. Unfortunately, we did not collect menstrual cycle information from the studied subjects and were not able to correlate the density results with hormonal status or chemotherapy-induced impairment in ovarian function. The decrease of breast density following NAC may show different results according to the chemotherapy regimens used. Therefore, the results obtained in this study may not be applied to patients receiving other regimens. By using our MR imaging method, it may be unreliable to measure density change in patients with extremely fatty breasts. This was the reason we excluded eight patients with baseline breast density of less than 5%. By knowing this limitation, the method may be applied to appropriate patient cohorts to conduct more research studies in the future for correlating the decreased breast density after chemotherapy with the decreased cancer risk.
In conclusion, by using three-dimensional MR imaging, we have demonstrated that patients receiving chemotherapy showed reduction of breast density and that the effects were significant after initial treatment with one to two cycles of the AC regimen. Although the density continued to decrease after four cycles of AC and the following taxane regimen, the effect appeared to level off and did not show further significant reduction compared with the density after one to two cycles of AC. We have demonstrated the feasibility of investigating the reduction of density following chemotherapy by using a quantitative analysis method based on MR imaging. Further studies are needed to correlate the reduction of density with compromised ovarian function and how it is related to future cancer risk. If such a relationship can be established, it may be possible to use the reduction of density after chemotherapy as a biomarker to predict the benefit of chemotherapy in reducing contralateral cancer risk through ovarian ablation.
Advances in Knowledge.
MR quantitative analysis can be utilized to demonstrate reduction of breast density following chemotherapy.
The percentage of change in breast density normalized to the baseline density of each patient is significantly dependent on age.
The effects of breast density reduction were highly significant after initial treatment with a doxorubicin and cyclophosphamide regimen and did not show further significant reduction with subsequent AC or taxane.
Implication for Patient Care.
It may be possible to use the reduction of density after chemotherapy as a biomarker to predict the benefit of chemotherapy in reducing contralateral cancer risk through ovarian ablation.
Received June 18, 2009; revision requested August 3; revision received September 25; accepted October 12; final version accepted October 28.
Supported in part by California Breast Cancer Research Program grant 14GB-0148 and National Science Council (Taiwan) grant 97-2314-B-039-031.
Funding: This work was supported by National Institutes of Health (grants R01 CA90437, CA127927, and R03 CA136071).
Authors stated no financial relationship to disclose.
Abbreviations:
- AC
- doxorubicin and cyclophosphamide
- NAC
- neoadjuvant chemotherapy
References
- 1.Kuerer HM, Newman LA, Smith TL, et al. Clinical course of breast cancer patients with complete pathologic primary tumor and axillary lymph node response to doxorubicin-based neoadjuvant chemotherapy. J Clin Oncol 1999;17(2):460–469 [DOI] [PubMed] [Google Scholar]
- 2.Fisher B, Bryant J, Wolmark N, et al. Effect of preoperative chemotherapy on the outcome of women with operable breast cancer. J Clin Oncol 1998;16(8):2672–2685 [DOI] [PubMed] [Google Scholar]
- 3.Bonadonna G, Valagussa P, Brambilla C, et al. Primary chemotherapy in operable breast cancer: eight-year experience at the Milan Cancer Institute. J Clin Oncol 1998;16(1):93–100 [DOI] [PubMed] [Google Scholar]
- 4.Booser DJ, Hortobagyi GN. Treatment of locally advanced breast cancer. Semin Oncol 1992;19(3):278–285 [PubMed] [Google Scholar]
- 5.Singletary S, McNeese M, Hortobagyi GN. Feasibility of breast-conservation chemotherapy for locally advanced breast carcinoma. Cancer 1992;69(11):2849–2852 [DOI] [PubMed] [Google Scholar]
- 6.Tham YL, Sexton K, Weiss H, Elledge R, Friedman LC, Kramer R. The rates of chemotherapy-induced amenorrhea in patients treated with adjuvant doxorubicin and cyclophosphamide followed by a taxane. Am J Clin Oncol 2007;30(2):126–132 [DOI] [PubMed] [Google Scholar]
- 7.Fornier MN, Modi S, Panageas KS, Norton L, Hudis C. Incidence of chemotherapy-induced, long-term amenorrhea in patients with breast carcinoma age 40 years and younger after adjuvant anthracycline and taxane. Cancer 2005;104(8):1575–1579 [DOI] [PubMed] [Google Scholar]
- 8.Minton SE, Munster PN. Chemotherapy-induced amenorrhea and fertility in women undergoing adjuvant treatment for breast cancer. Cancer Control 2002;9(6):466–472 [DOI] [PubMed] [Google Scholar]
- 9.Poikonen P, Saarto T, Elomaa I, Joensuu H, Blomqvist C. Prognostic effect of amenorrhoea and elevated serum gonadotropin levels induced by adjuvant chemotherapy in premenopausal node-positive breast cancer patients. Eur J Cancer 2000;36(1):43–48 [DOI] [PubMed] [Google Scholar]
- 10.Lee S, Kil WJ, Chun M, et al. Chemotherapy-related amenorrhea in premenopausal women with breast cancer. Menopause 2009;16(1):98–103 [DOI] [PubMed] [Google Scholar]
- 11.Oktem O, Oktay K. Quantitative assessment of the impact of chemotherapy on ovarian follicle reserve and stromal function. Cancer 2007;110(10):2222–2229 [DOI] [PubMed] [Google Scholar]
- 12.Gadducci A, Cosio S, Genazzani AR. Ovarian function and childbearing issues in breast cancer survivors. Gynecol Endocrinol 2007;23(11):625–631 [DOI] [PubMed] [Google Scholar]
- 13.Swain SM, Land SR, Ritter MW, et al. Amenorrhea in premenopausal women on the doxorubicin-and-cyclophosphamide-followed-by-docetaxel arm of NSABP B-30 trial. Breast Cancer Res Treat 2009;113(2):315–320 [DOI] [PMC free article] [PubMed] [Google Scholar]
- 14.Boyd NF, Guo H, Martin LJ, et al. Mammographic density and the risk and detection of breast cancer. N Engl J Med 2007;356(3):227–236 [DOI] [PubMed] [Google Scholar]
- 15.McCormack VA, dos Santos Silva I. Breast density and parenchymal patterns as markers of breast cancer risk: a meta-analysis. Cancer Epidemiol Biomarkers Prev 2006;15(6):1159–1169 [DOI] [PubMed] [Google Scholar]
- 16.Hill-Kayser CE, Harris EE, Hwang WT, Solin LJ. Twenty-year incidence and patterns of contralateral breast cancer after breast conservation treatment with radiation. Int J Radiat Oncol Biol Phys 2006;66(5):1313–1319 [DOI] [PubMed] [Google Scholar]
- 17.Bremnes Y, Ursin G, Bjurstam N, Rinaldi S, Kaaks R, Gram IT. Endogenous sex hormones, prolactin and mammographic density in postmenopausal Norwegian women. Int J Cancer 2007;121(11):2506–2511 [DOI] [PubMed] [Google Scholar]
- 18.Noh JJ, Maskarinec G, Pagano I, Cheung LW, Stanczyk FZ. Mammographic densities and circulating hormones: a cross-sectional study in premenopausal women. Breast 2006;15(1):20–28 [DOI] [PubMed] [Google Scholar]
- 19.Harvey JA, Bovbjerg VE. Quantitative assessment of mammographic breast density: relationship with breast cancer risk. Radiology 2004;230(1):29–41 [DOI] [PubMed] [Google Scholar]
- 20.Kopans DB. Basic physics and doubts about relationship between mammographically determined tissue density and breast cancer risk. Radiology 2008;246(2):348–353 [DOI] [PubMed] [Google Scholar]
- 21.Nie K, Chen JH, Chan S, et al. Development of a quantitative method for analysis of breast density based on three-dimensional breast MRI. Med Phys 2008;35(12):5253–5262 [DOI] [PMC free article] [PubMed] [Google Scholar]
- 22.Baek HM, Chen JH, Nie K, et al. Predicting pathologic response to neoadjuvant chemotherapy in breast cancer by using MR imaging and quantitative 1H MR spectroscopy. Radiology 2009;251(3):653–662 [DOI] [PMC free article] [PubMed] [Google Scholar]
- 23.Brisson J, Brisson B, Coté G, Maunsell E, Bérubé S, Robert J. Tamoxifen and mammographic breast densities. Cancer Epidemiol Biomarkers Prev 2000;9(9):911–915 [PubMed] [Google Scholar]
- 24.Atkinson C, Warren R, Bingham SA, Day NE. Mammographic patterns as a predictive biomarker of breast cancer risk: effect of tamoxifen. Cancer Epidemiol Biomarkers Prev 1999;8(10):863–866 [PubMed] [Google Scholar]
- 25.Son HJ, Oh KK. Significance of follow-up mammography in estimating the effect of tamoxifen in breast cancer patients who have undergone surgery. AJR Am J Roentgenol 1999;173(4):905–909 [DOI] [PubMed] [Google Scholar]
- 26.Toledano A, Garaud P, Serin D, et al. Concurrent administration of adjuvant chemotherapy and radiotherapy after breast-conserving surgery enhances late toxicities: long-term results of the ARCOSEIN multicenter randomized study. Int J Radiat Oncol Biol Phys 2006;65(2):324–332 [DOI] [PubMed] [Google Scholar]
- 27.Vachon CM, Pankratz VS, Scott CG, et al. Longitudinal trends in mammographic percent density and breast cancer risk. Cancer Epidemiol Biomarkers Prev 2007;16(5):921–928 [DOI] [PubMed] [Google Scholar]
- 28.Vachon CM, Brandt KR, Ghosh K, et al. Mammographic breast density as a general marker of breast cancer risk. Cancer Epidemiol Biomarkers Prev 2007;16(1):43–49 [DOI] [PubMed] [Google Scholar]
- 29.Boyd NF, Martin LJ, Sun L, et al. Body size, mammographic density, and breast cancer risk. Cancer Epidemiol Biomarkers Prev 2006;15(11):2086–2092 [DOI] [PubMed] [Google Scholar]
- 30.Chen J, Pee D, Ayyagari R, et al. Projecting absolute invasive breast cancer risk in white women with a model that includes mammographic density. J Natl Cancer Inst 2006;98(17):1215–1226 [DOI] [PubMed] [Google Scholar]
- 31.Santen RJ, Boyd NF, Chlebowski RT, et al. Critical assessment of new risk factors for breast cancer: considerations for development of an improved risk prediction model. Endocr Relat Cancer 2007;14(2):169–187 [DOI] [PubMed] [Google Scholar]
- 32.Shahedi K, Emanuelsson M, Wiklund F, Gronberg H. High risk of contralateral breast carcinoma in women with hereditary/familial non-BRCA1/BRCA2 breast carcinoma. Cancer 2006;106(6):1237–1242 [DOI] [PubMed] [Google Scholar]
- 33.White E, Velentgas P, Mandelson MT, et al. Variation in mammographic breast density by time in menstrual cycle among women aged 40-49 years. J Natl Cancer Inst 1998;90(12):906–910 [DOI] [PubMed] [Google Scholar]
- 34.Ursin G, Parisky YR, Pike MC, Spicer DV. Mammographic density changes during the menstrual cycle. Cancer Epidemiol Biomarkers Prev 2001;10(2):141–142 [PubMed] [Google Scholar]
- 35.Buist DS, Aiello EJ, Miglioretti DL, White E. Mammographic breast density, dense area, and breast area differences by phase in the menstrual cycle. Cancer Epidemiol Biomarkers Prev 2006;15(11):2303–2306 [DOI] [PubMed] [Google Scholar]
- 36.Greendale GA, Reboussin BA, Slone S, Wasilauskas C, Pike MC, Ursin G. Postmenopausal hormone therapy and change in mammographic density. J Natl Cancer Inst 2003;95(1):30–37 [DOI] [PubMed] [Google Scholar]
- 37.Marchesoni D, Driul L, Ianni A, et al. Postmenopausal hormone therapy and mammographic breast density. Maturitas 2006;53(1):59–64 [DOI] [PubMed] [Google Scholar]
- 38.Bremnes Y, Ursin G, Bjurstam N, Lund E, Gram IT. Different types of postmenopausal hormone therapy and mammographic density in Norwegian women. Int J Cancer 2007;120(4):880–884 [DOI] [PubMed] [Google Scholar]
- 39.Early Breast Cancer Trialists’ Collaborative Group (EBCTCG) Effects of chemotherapy and hormonal therapy for early breast cancer on recurrence and 15-year survival: an overview of the randomised trials. Lancet 2005;365(9472):1687–1717 [DOI] [PubMed] [Google Scholar]
- 40.Cuzick J, Warwick J, Pinney L, et al. Change in breast density as a biomarker of breast cancer risk reduction: results from IBIS-I. Abstract 61. Presented at the 31st annual meeting of San Antonio Breast Cancer Symposium, San Antonio, Tex, December 10–14, 2008 [Google Scholar]