

Combined use of anatomic (T2-weighted MR imaging) and functional (MR spectroscopy and dynamic contrast material–enhanced MR imaging) modalities improves the performance of MR imaging for prostate tumor detection.
Abstract
Purpose:
To determine utility of multiparametric imaging performed at 3 T for detection of prostate cancer by using T2-weighted magnetic resonance (MR) imaging, MR spectroscopy, and dynamic contrast material–enhanced MR imaging, with whole-mount pathologic findings as reference standard.
Materials and Methods:
This prospectively designed, HIPAA-compliant, single-institution study was approved by the local institutional review board. Seventy consecutive patients (mean age, 60.4 years; mean prostate-specific antigen level, 5.47 ng/mL [5.47 μg/L]; range, 1–19.9 ng/mL [1–19.9 μg/L]) were included; informed consent was obtained from each patient. All patients had biopsy-proved prostate cancer, with a median Gleason score of 7 (range, 6–9). Images were obtained by using a combination of six-channel cardiac and endorectal coils. MR imaging and pathologic findings were evaluated independently and blinded and then correlated with histopathologic findings by using side-by-side comparison. Analyses were conducted with a raw stringent approach and an alternative neighboring method, which accounted for surgical deformation, shrinkage, and nonuniform slicing factors in pathologic specimens. Generalized estimating equations (GEEs) were used to estimate the predictive value of region-specific, pathologically determined cancer for all three modalities. This approach accounts for the correlation among multiple regions in the same individual.
Results:
For T2-weighted MR imaging, sensitivity and specificity values obtained with stringent approach were 0.42 (95% confidence interval [CI]: 0.36, 0.47) and 0.83 (95% CI: 0.81, 0.86), and for the alternative neighboring approach, sensitivity and specificity values were 0.73 (95% CI: 0.67, 0.78) and 0.89 (95% CI: 0.85, 0.93), respectively. The combined diagnostic accuracy of T2-weighted MR imaging, dynamic contrast-enhanced MR imaging, and MR spectroscopy for peripheral zone tumors was examined by calculating their predictive value with different combinations of techniques; T2-weighted MR imaging, dynamic contrast-enhanced MR imaging, and MR spectroscopy provided significant independent and additive predictive value when GEEs were used (P < .001, P = .02, P = .002, respectively).
Conclusion:
Multiparametric MR imaging (T2-weighted MR imaging, MR spectroscopy, dynamic contrast-enhanced MR imaging) of the prostate at 3 T enables tumor detection, with reasonable sensitivity and specificity values.
© RSNA, 2010
Introduction
Prostate cancer is the most common noncutaneous malignancy in American men, and in 2009, the projected incidence of new cases was 192280, resulting in approximately 27360 deaths (1). Over the past 2 decades, the incidence of prostate cancer has increased owing to widespread screening with serum prostate-specific antigen and digital rectal examination, whereas a decline in the mortality rate has been observed over the past 4 years. Better imaging techniques for prostate cancer could result in more accurate tumor detection, localization, and staging, leading to further improvement in outcomes for patients. Magnetic resonance (MR) imaging at 1.5 T has been extensively studied as a means of localizing and staging prostate cancer. Results have varied, depending on the technology used and the nature of the patient population studied. Currently, patients often have smaller average tumor volumes at presentation than they did 10 years ago; this factor makes imaging challenging and makes it difficult to compare the results of contemporary studies with those of older studies.
Although T2-weighted imaging has been the mainstay of prostate MR imaging, it is generally acknowledged to be nonspecific for cancer, because low-signal-intensity lesions in the peripheral zone (PZ) can result from prostatitis, scarring, or hyperplasia. The use of additional MR imaging techniques, such as diffusion-weighted MR imaging, MR spectroscopy, and dynamic contrast material–enhanced MR imaging, may provide additional specificity. However, such specialized sequences are highly demanding of time and require higher signal-to-noise ratios and, therefore, may benefit from higher-field-strength magnets. Clinical experience with 3-T MR imaging for prostate cancer is limited, but the results for tumor detection and local staging accuracy are comparable to those with 1.5-T MR imaging (2–10). In our study, we investigated the utility of multiparametric imaging performed at 3 T for detection of prostate cancer by using T2-weighted MR imaging, MR spectroscopy, and dynamic contrast-enhanced MR imaging, with whole-mount pathologic findings as the reference standard.
Materials and Methods
Study Design and Population
This prospectively designed, single-institution study was approved by the local institutional review board and was compliant with the Health Insurance Portability and Accountability Act; informed consent was obtained from each patient. Seventy patients were enrolled in the study between June 1, 2004, and December 31, 2007. The mean age of the patients was 60.4 years (range, 40–75 years), and the mean prostate-specific antigen level was 5.47 ng/mL (5.47 μg/L), with a median level of 4.3 ng/mL (4.3 μg/L) and a range of 1–19.9 ng/mL (1–19.9 μg/L). All patients had transrectal ultrasonography (US)-guided biopsy-proved prostate cancer; the median Gleason score was 7 (range, 6–9). Thus, this population could be generally characterized as having a low-moderate risk (11). The mean interval between transrectal US-guided biopsy and MR imaging was 86.5 days (median, 67.5 days; range, 20–366 days). The inclusion criterion required that a radical prostatectomy be performed within 180 days of imaging without any intervening treatment. The exclusion criterion was a contraindication to MR imaging (cardiac pacemaker, prosthetic valve, intracranial aneurysm clip, shrapnel injury, severe claustrophobia, etc) or an inability to have an endorectal coil placed (anorectal surgery and colostomy, inflammatory bowel disease, severe hemorrhoids, etc). The flowchart of the patient population is summarized in Figure 1. No patients were excluded.
Figure 1:

Flowchart of patient population in current study. DCE MRI = dynamic contrast-enhanced MR imaging, MRS = MR spectroscopy, T2W = T2-weighted MR imaging.
MR Imaging Protocol
All imaging studies were performed by using a combination of an endorectal coil (BPX-15; Medrad, Pittsburgh, Pa) tuned to 127.8 MHz and a six-channel cardiac coil with a parallel imaging (sensitivity-encoding [SENSE]; Philips Medical Systems, Best, the Netherlands) technique with a 3-T magnet (Achieva; Philips Medical Systems) without prior bowel preparation. After digital rectal examination, the endorectal coil was inserted by using a semianesthetic gel (xylocaine, Lidocaine; AstraZeneca, Wilmington, Del) while the patient was in the left lateral decubitus position. The balloon surrounding the coil was distended with 3 mol/L of perfluorocarbon (Fluorinert; 3M, St Paul, Minn) to a volume of approximately 50 mL to reduce susceptibility artifacts induced by air in the balloon of the coil. The imaging protocol included triplanar T2-weighted turbo spin-echo MR imaging, three-dimensional (3D) point resolved spatially localized spectroscopy (PRESS) MR imaging, axial unenhanced T1-weighted MR imaging, axial 3D fast field-echo dynamic contrast-enhanced MR imaging, and axial breath-hold 3D T1-weighted high-resolution isotropic volume examination (THRIVE) sequences. For 3D PRESS MR imaging, water and fat signals were suppressed before data collection, each spectrum (1024 complex points) was obtained from a voxel size of 6 × 6 × 6 mm3 tissue with spectral width of 2000 Hz, and second-order shimming was used to maximize magnetic field homogeneity in the localized volume. Axial dynamic contrast-enhanced images were obtained before, during, and after a single-dose injection of gadopentetate dimeglumine (Magnevist; Berlex, Wayne, NJ) at a dose of 0.1 mmol/kg through a peripheral vein at a rate of 3 mL/sec via a mechanical injector (Spectris MR Injection System; Medrad). The dynamic contrast-enhanced acquisition consisted of a 10-section 3D fast field-echo sequence, with a phase direction from left to right without fat saturation. Four unenhanced sets (total acquisition time, 13 seconds) and approximately 96 contrast-enhanced sets of images were acquired sequentially without a delay between acquisitions. A total of approximately 1000 images were obtained during dynamic contrast-enhanced MR imaging. The imaging parameters are summarized in Table 1.
Table 1.
MR Imaging Parameters Used in the Current Study
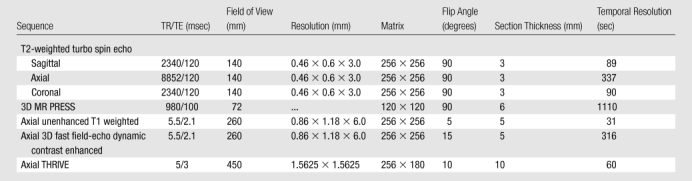
Note.—TR/TE = repetition time/echo time.
Data Analysis
T2-weighted MR imaging, MR spectroscopy, and dynamic contrast-enhanced MR imaging data sets were prospectively evaluated by two radiologists (B.T., P.L.C., with an accumulated experience in prostate MR imaging of 8 years and 1 year, respectively). MR imaging data sets were assessed in consensus, and both reviewers were aware that patients had biopsy-proved prostate cancer, but they were blinded to preimaging serum prostate-specific antigen values and transrectal US-guided biopsy results, as well as to histopathologic findings. The results of each MR imaging examination (T2-weighted MR imaging, MR spectroscopy, dynamic contrast-enhanced MR imaging) were evaluated independently and separately without knowledge of the histopathologic results.
For tumor localization, the prostate gland was divided into five axial levels in the superoinferior direction as apex, apex to middle, middle, middle to base, and base; and at each of these levels, the gland was further divided into six sections, four PZ sections (right anterior, right posterior, left anterior, left posterior) and two transition zone (TZ) sections (right and left). Thus, for analysis, the prostate was divided into 30 regions.
Prior to generating the axial T1 maps, the unenhanced T1-weighted MR images were evaluated for the presence of postbiopsy hemorrhage, which appears as an area of hyperintensity. Sections with hemorrhage were considered unevaluable. On T2-weighted images, the criterion for prostate cancer detection was a well-circumscribed, round-ellipsoid low-signal-intensity lesion in the prostate gland (9).
The 3D MR spectroscopic analysis was used to evaluate choline-citrate ratios within voxels in the prostate. MR spectroscopic postprocessing was performed off-line with in-house interactive data language software (IDL 6.4; ITT Visual Information Solutions, Boulder, Colo). Before the fast Fourier transform along the spectral dimension, the residual water signal was effectively removed by means of the deconvolution method; the signal-to-noise ratio was improved through apodization in which the line shape of the peaks was transformed into a Gaussian distribution. A nonlinear least-squares (Levenberg-Marquardt) curve fitting was used to model metabolite peaks, where three parameters (area, position, and width) for each peak were fitted, the final metabolite ratios were calculated on the basis of these fitted peak areas, and the uncertainties of these quantities were determined. The mean healthy choline-citrate ratio value was defined as 0.13 ± 0.081 (standard deviation) on the basis of results recorded from 433 healthy voxels from PZ regions with negative biopsy results in 44 additional patients who were referred for prostate MR imaging. Voxels were considered abnormal when the choline-citrate ratio was 3 or more standard deviations above the mean healthy value (≥ 0.373). MR spectroscopic evaluation of the TZ could not be performed owing to the substantial overlap of metabolic ratios in benign prostatic hyperplasia and prostate cancer. Each positive voxel was recorded with its choline-citrate ratio on the 30-region study grid.
Dynamic contrast-enhanced MR images were evaluated by means of direct visual interpretation of raw dynamic enhanced T1-weighted images depicted in the cine mode and by using parametric maps obtained with a two-compartment pharmacokinetic model. Visual interpretation was performed with a dedicated picture archiving and communication system in cine mode (Carestream, Rochester, NY), and the diagnostic criterion for prostate cancer was defined as the presence of foci showing early and intense enhancement and rapid washout, whereas diffuse, symmetric, and homogeneous enhancement in the PZ was considered benign. Color-coded parametric maps reflecting Ktrans (wash-in), kep (washout) were obtained with a two-compartment pharmacokinetic model (general kinetic model) after processing of dynamic images was performed in a proprietary programming environment (PRIDE; Philips Medical Systems) by using interface data language (IDL; Research Systems, Boulder Colo). Nodular masslike “hot spot” foci on Ktrans, kep maps were considered positive for tumor on color-coded maps; however, quantitative values were not used owing to significant interpatient variation.
For staging at MR imaging, triplane T2-weighted MR images and axial breath-hold 3D THRIVE images were evaluated. Staging was performed on the basis of the TNM classification. Extracapsular extension and seminal vesicle invasion were evaluated with triplanar T2-weighted images, and the criteria for extracapsular extension were the presence of direct extension beyond the capsule into the periprostatic fat tissue, capsular bulge, irregularity, retraction, and rectoprostatic angle obliteration, whereas, the criterion for seminal vesicle involvement was the presence of low signal intensity in one or more seminal vesicles. Nodal and distant metastases were evaluated on both triplanar T2-weighted and axial THRIVE images.
Histopathologic Analysis
Patients underwent robotic prostatectomy. In all patients, the prostatectomy specimen was inked in four colors (right posterior surface and right seminal vesicle in blue; left posterior surface and left seminal vesicle in red; anterior surface in black; urethra in yellow) to provide orientation of the specimen. The specimen was fixed in buffered neutral formalin for 24–48 hours at room temperature. After fixation, the seminal vesicles were amputated, and the prostate was then serially sectioned from apex to base at 4-mm intervals, independently from axial MR images. Each slice was sequentially labeled, allowed to fix for a further period of 24–48 hours, processed, and paraffin embedded as a whole mount. Whole-mount sections were cut at 5-µm thickness and stained with hematoxylin-eosin for histopathologic evaluation. The amputated seminal vesicles were also sequentially sectioned and processed in a similar manner. Thus, the entire specimen was evaluated. The stained sections were independently reviewed by two pathologists (H.M., M.J.M.), neither of whom had information in regard to the imaging results. Sections were assessed for presence of tumor, Gleason score, extracapsular extension, and seminal vesicle invasion. Individual foci of tumor were outlined, and maximum diameters were measured. The tumor foci were then manually mapped to 30-region–based study grids. The grids used for mapping were similar to those used for imaging evaluation, to allow for radiologic findings–pathologic findings correlation. Pathologic TNM staging was also performed for every prostatectomy patient.
Correlation of Imaging Data with Histopathologic Findings
One-to-one correlation of MR images with histopathologic whole-mount sections is challenging owing to several technical factors. Following prostatectomy, the prostate may deform because of the lack of its in situ anatomic connective tissue. Fixation and processing cause variable loss of volume, depending on the proportion of fibrous tissue to muscle in each gland. Sectioning of the fixed gland does not necessarily correlate with the more precise “sections” at imaging both in terms of slicing plane of the tissue and thickness, and this factor could potentially result in minor mismatches between the pathologic findings and the imaging maps. Other authors have addressed this issue, but no completely satisfactory approach has been agreed on (5,12).
In our study, we applied two analytic approaches to correlate each MR imaging acquisition (T2-weighted MR imaging, MR spectroscopy, and dynamic contrast-enhanced MR imaging) with whole-mount pathologic sections to minimize errors owing to potential gland distortion. The first approach was a raw stringent one-to-one correlation between imaging and histopathologic findings. This approach did not provide any correction for possible specimen deformation. The second approach was more tolerant of misalignment between the pathologic sections and the MR images. This approach took into account neighboring regions on the 30-region grid when radiologic findings and pathologic findings were compared. The premise was that any “displacement” of a tumor focus owing to specimen distortion would occur only from the “original region” to a “neighboring region” within the grid. “Neighbors” of a region were defined as immediately adjacent sectors. For example, each sector had either three or five neighbors, depending on the location (Fig 2). Whereas by the first approach (raw stringent approach), a tumor focus had to be present in the same sector for a positive radiologic finding–pathologic finding correlation, in the second approach (neighboring approach) the tumor focus was considered to correlate even if it was present in a neighboring sector in either grid. Thus, the use of the neighboring approach aimed to reduce the effects of gland deformation, fixation-related shrinkage, and misaligned slicing of the tissue. Moreover, such an approach allows the determination of accuracy within a certain distance range without observer bias from either the radiologist or pathologist (Figs 2–4).
Figure 2:

Illustration demonstrates neighboring approach used for MR imaging and whole-mount step-section histopathologic correlation among regions of prostate (1–30). Region 14 at left mid PZ neighbors with regions 7, 8, 13, 19, and 20, which are also localized at consecutive ipsilateral PZs, whereas region 11 at right apex to mid TZ neighbors with regions 5, 6, 12, 17, and 18, which are localized at consecutive TZs.
Figure 4a:
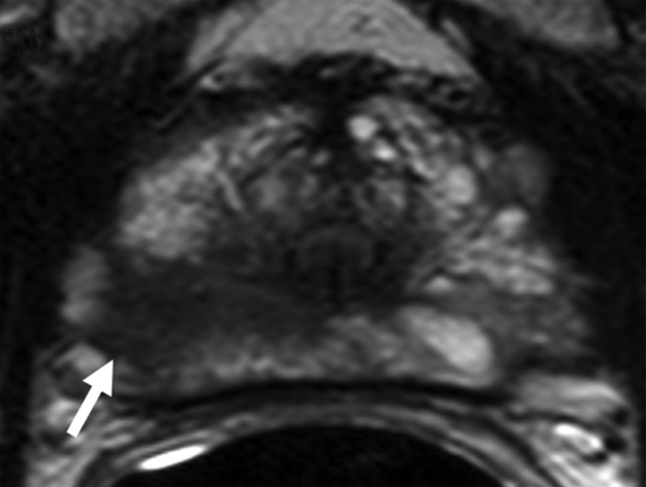
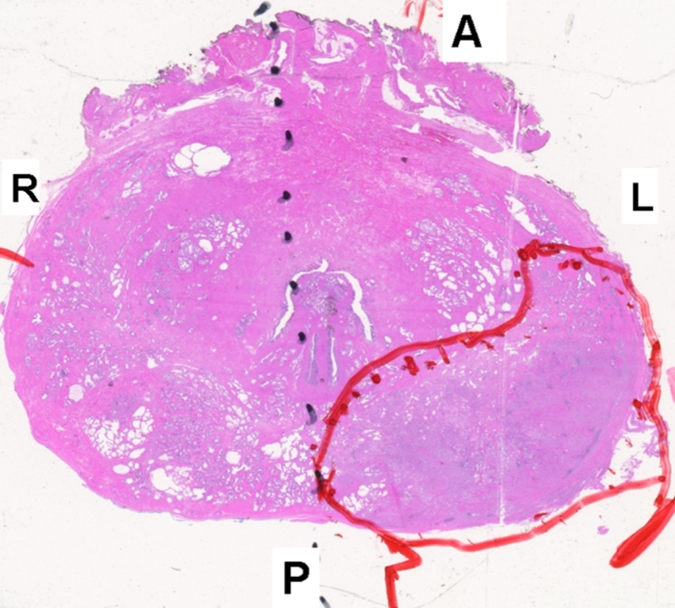
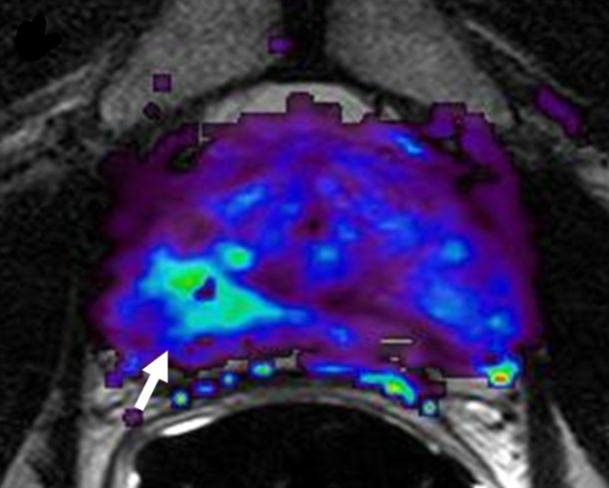
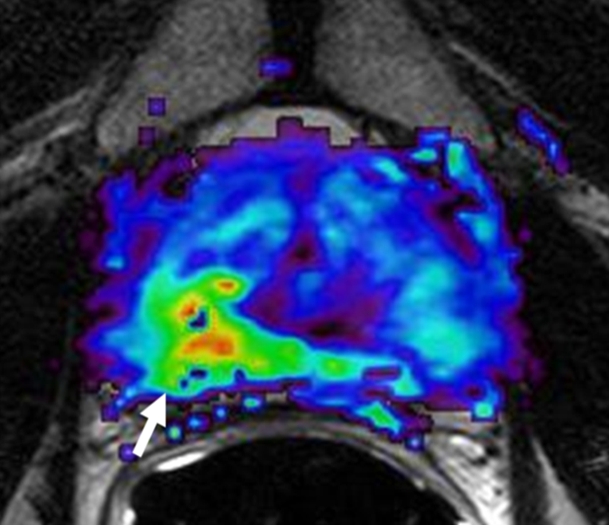
Prostate cancer in 62-year-old man. (a) Axial T2-weighted MR image demonstrates a low-signal-intensity focus (arrow) at right apex mid PZ suspicious for prostate cancer. (b) Raw dynamic contrast-enhanced MR image and (c) Ktrans and (d) kep maps help localize tumor (arrow). (e) Histopathologic slide at apex mid prostate level confirms presence of tumor (Gleason score, 8) more anteriorly (red line), secondary to distortion and shrinkage of specimen. Keys are same as for Figure 3.
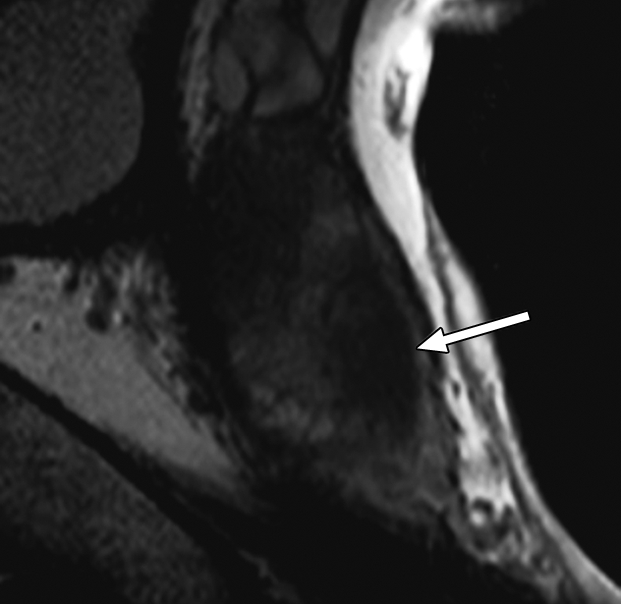
Figure 3a:
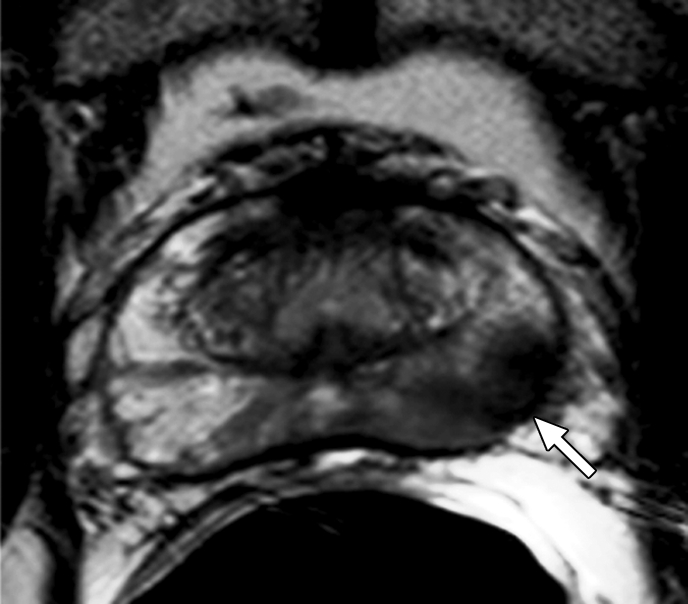
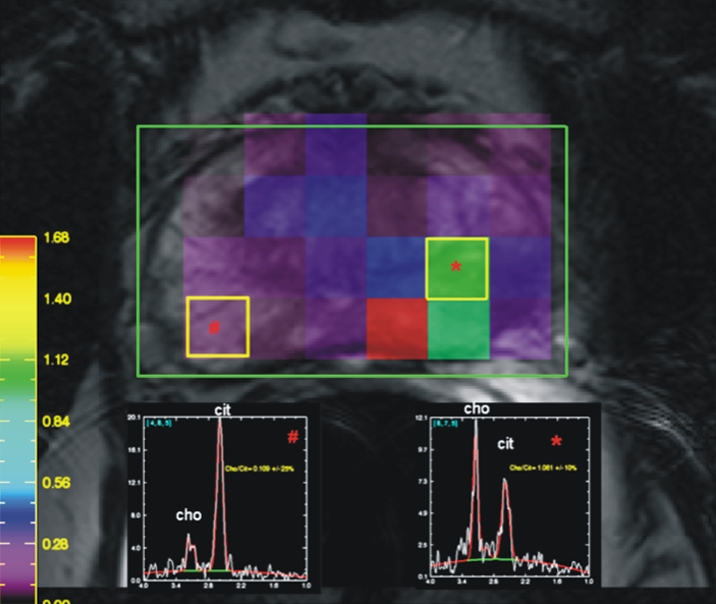
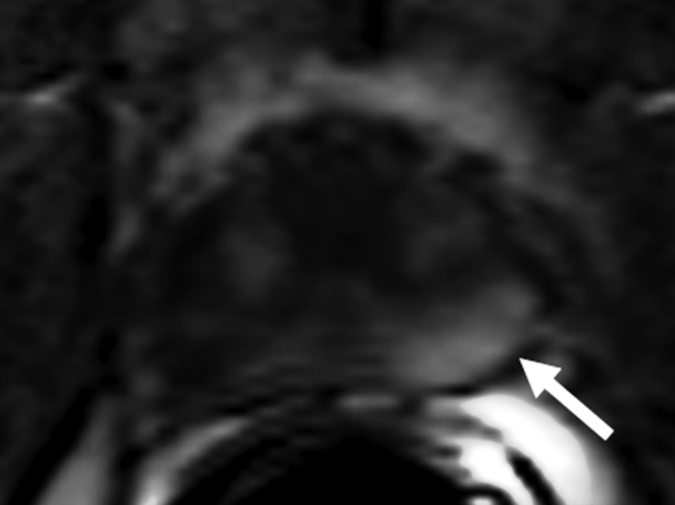
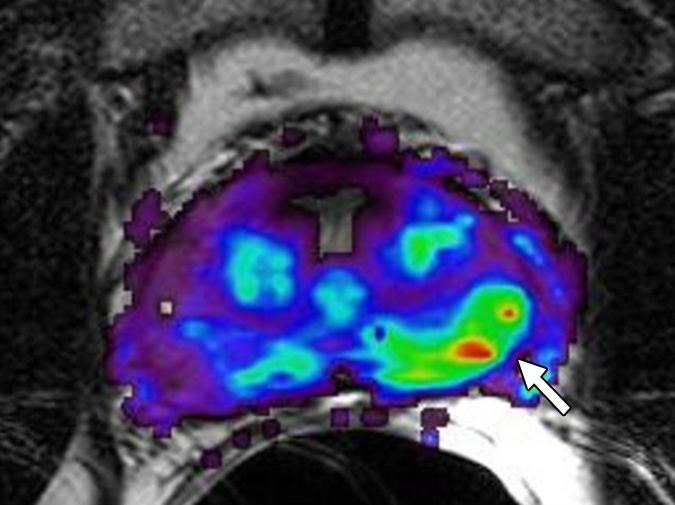
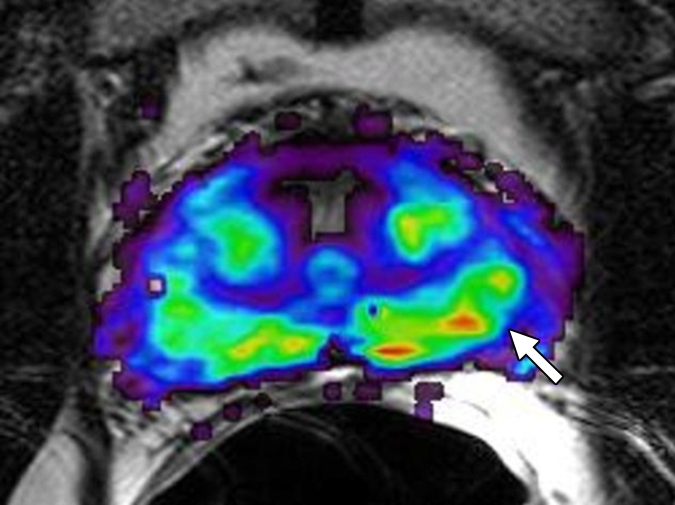
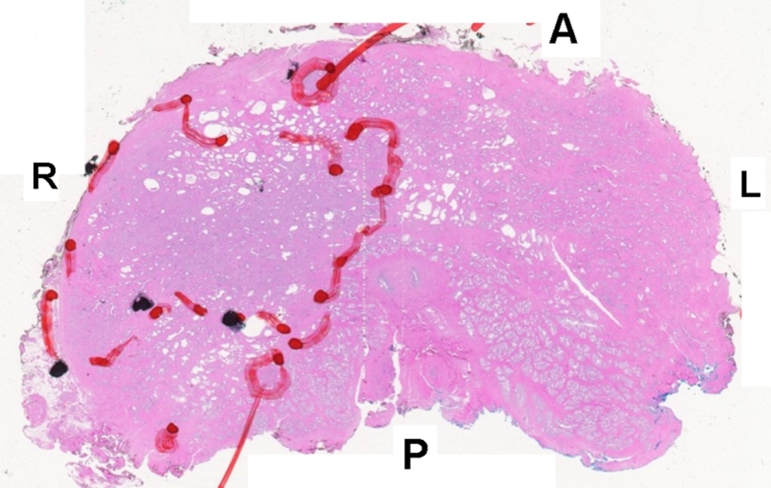
Prostate cancer in 58-year-old man. (a) Axial and (b) sagittal T2-weighted MR images demonstrate a low-signal-intensity lesion (arrow) in left mid PZ suspicious for cancer. (c) MR spectra demonstrate increased ratio of choline (cho) to citrate (cit) in left mid PZ lesion (∗) when compared with normal right side. (d) Raw dynamic contrast-enhanced MR image and (e) Ktrans and (f) kep maps help localize tumor (arrow). (g) Histopathologic slide at mid prostate level confirms presence of tumor (Gleason score, 7), with extracapsular extension (red line) detected on MR images. A = anterior, L = left, P = posterior, R = right.
Figure 3b:
Prostate cancer in 58-year-old man. (a) Axial and (b) sagittal T2-weighted MR images demonstrate a low-signal-intensity lesion (arrow) in left mid PZ suspicious for cancer. (c) MR spectra demonstrate increased ratio of choline (cho) to citrate (cit) in left mid PZ lesion (∗) when compared with normal right side. (d) Raw dynamic contrast-enhanced MR image and (e) Ktrans and (f) kep maps help localize tumor (arrow). (g) Histopathologic slide at mid prostate level confirms presence of tumor (Gleason score, 7), with extracapsular extension (red line) detected on MR images. A = anterior, L = left, P = posterior, R = right.
Figure 3c:
Prostate cancer in 58-year-old man. (a) Axial and (b) sagittal T2-weighted MR images demonstrate a low-signal-intensity lesion (arrow) in left mid PZ suspicious for cancer. (c) MR spectra demonstrate increased ratio of choline (cho) to citrate (cit) in left mid PZ lesion (∗) when compared with normal right side. (d) Raw dynamic contrast-enhanced MR image and (e) Ktrans and (f) kep maps help localize tumor (arrow). (g) Histopathologic slide at mid prostate level confirms presence of tumor (Gleason score, 7), with extracapsular extension (red line) detected on MR images. A = anterior, L = left, P = posterior, R = right.
Figure 3d:
Prostate cancer in 58-year-old man. (a) Axial and (b) sagittal T2-weighted MR images demonstrate a low-signal-intensity lesion (arrow) in left mid PZ suspicious for cancer. (c) MR spectra demonstrate increased ratio of choline (cho) to citrate (cit) in left mid PZ lesion (∗) when compared with normal right side. (d) Raw dynamic contrast-enhanced MR image and (e) Ktrans and (f) kep maps help localize tumor (arrow). (g) Histopathologic slide at mid prostate level confirms presence of tumor (Gleason score, 7), with extracapsular extension (red line) detected on MR images. A = anterior, L = left, P = posterior, R = right.
Figure 3e:
Prostate cancer in 58-year-old man. (a) Axial and (b) sagittal T2-weighted MR images demonstrate a low-signal-intensity lesion (arrow) in left mid PZ suspicious for cancer. (c) MR spectra demonstrate increased ratio of choline (cho) to citrate (cit) in left mid PZ lesion (∗) when compared with normal right side. (d) Raw dynamic contrast-enhanced MR image and (e) Ktrans and (f) kep maps help localize tumor (arrow). (g) Histopathologic slide at mid prostate level confirms presence of tumor (Gleason score, 7), with extracapsular extension (red line) detected on MR images. A = anterior, L = left, P = posterior, R = right.
Figure 3f:
Prostate cancer in 58-year-old man. (a) Axial and (b) sagittal T2-weighted MR images demonstrate a low-signal-intensity lesion (arrow) in left mid PZ suspicious for cancer. (c) MR spectra demonstrate increased ratio of choline (cho) to citrate (cit) in left mid PZ lesion (∗) when compared with normal right side. (d) Raw dynamic contrast-enhanced MR image and (e) Ktrans and (f) kep maps help localize tumor (arrow). (g) Histopathologic slide at mid prostate level confirms presence of tumor (Gleason score, 7), with extracapsular extension (red line) detected on MR images. A = anterior, L = left, P = posterior, R = right.
Figure 3g:
Prostate cancer in 58-year-old man. (a) Axial and (b) sagittal T2-weighted MR images demonstrate a low-signal-intensity lesion (arrow) in left mid PZ suspicious for cancer. (c) MR spectra demonstrate increased ratio of choline (cho) to citrate (cit) in left mid PZ lesion (∗) when compared with normal right side. (d) Raw dynamic contrast-enhanced MR image and (e) Ktrans and (f) kep maps help localize tumor (arrow). (g) Histopathologic slide at mid prostate level confirms presence of tumor (Gleason score, 7), with extracapsular extension (red line) detected on MR images. A = anterior, L = left, P = posterior, R = right.
Figure 4b:
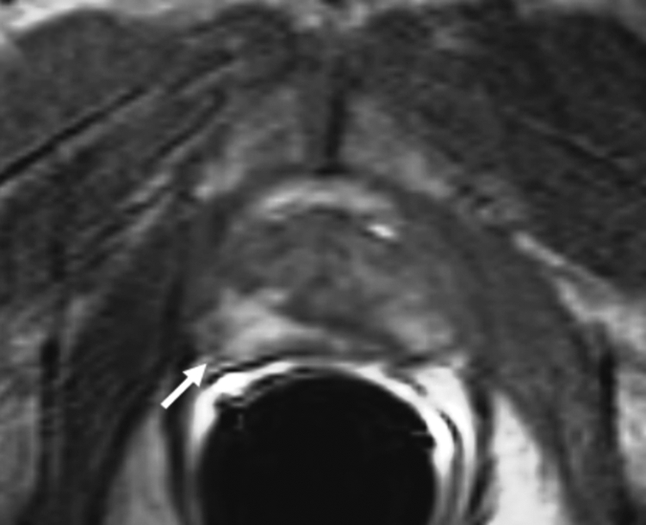
Prostate cancer in 62-year-old man. (a) Axial T2-weighted MR image demonstrates a low-signal-intensity focus (arrow) at right apex mid PZ suspicious for prostate cancer. (b) Raw dynamic contrast-enhanced MR image and (c) Ktrans and (d) kep maps help localize tumor (arrow). (e) Histopathologic slide at apex mid prostate level confirms presence of tumor (Gleason score, 8) more anteriorly (red line), secondary to distortion and shrinkage of specimen. Keys are same as for Figure 3.
Figure 4c:
Prostate cancer in 62-year-old man. (a) Axial T2-weighted MR image demonstrates a low-signal-intensity focus (arrow) at right apex mid PZ suspicious for prostate cancer. (b) Raw dynamic contrast-enhanced MR image and (c) Ktrans and (d) kep maps help localize tumor (arrow). (e) Histopathologic slide at apex mid prostate level confirms presence of tumor (Gleason score, 8) more anteriorly (red line), secondary to distortion and shrinkage of specimen. Keys are same as for Figure 3.
Figure 4d:
Prostate cancer in 62-year-old man. (a) Axial T2-weighted MR image demonstrates a low-signal-intensity focus (arrow) at right apex mid PZ suspicious for prostate cancer. (b) Raw dynamic contrast-enhanced MR image and (c) Ktrans and (d) kep maps help localize tumor (arrow). (e) Histopathologic slide at apex mid prostate level confirms presence of tumor (Gleason score, 8) more anteriorly (red line), secondary to distortion and shrinkage of specimen. Keys are same as for Figure 3.
Figure 4e:
Prostate cancer in 62-year-old man. (a) Axial T2-weighted MR image demonstrates a low-signal-intensity focus (arrow) at right apex mid PZ suspicious for prostate cancer. (b) Raw dynamic contrast-enhanced MR image and (c) Ktrans and (d) kep maps help localize tumor (arrow). (e) Histopathologic slide at apex mid prostate level confirms presence of tumor (Gleason score, 8) more anteriorly (red line), secondary to distortion and shrinkage of specimen. Keys are same as for Figure 3.
Statistical Analysis
Statistical analysis was undertaken to assess correlation between imaging findings and pathologic findings. The analysis was performed separately for both the raw stringent and neighboring approaches, with histopathologic findings as the reference standard for tumor detection. For the raw stringent approach, sensitivity of an imaging modality was defined as the probability of correctly identifying a histopathologically proved tumor focus in a given region. Specificity was defined as the probability of correctly identifying regions negative for tumor. For the neighboring approach, sensitivity was defined as the probability of test results that are positive for tumor at a particular region or in any of the three to five neighboring regions. Specificity was defined as the probability of test results that are negative for tumor at a particular region, given that the particular region and all neighboring regions are negative for tumor at pathologic analysis. For either approach, estimates of sensitivity and specificity were obtained by first estimating sensitivity and specificity across regions in each patient. Sensitivity and specificity were then estimated by averaging the individual-specific estimates across patients. The 95% confidence intervals (CIs) were constructed as the estimate ± 1.96 times the square root of the variance of the estimate, where the variance is the sample variance divided by the number of patients. This CI appropriately accounts for the correlation across regions in the same subject because the variance is estimated over individual-specific estimates, which are statistically independent from each other.
We tested for differences in sensitivity between the different modalities by testing for differences in individual-specific estimates by using the Wilcoxon signed rank test. We also tested for differences in specificity across the different modalities in a similar way.
We then analyzed the effect of histopathologic variables on sensitivity of imaging modalities, accounting for the correlation among the multiple regions in the same patient. Specifically, we evaluated the effect of lesion size (greatest diameter) and Gleason score for each tumor focus, by using generalized estimating equations (GEEs) with a logistic link function (13). The Wald test with robust variance estimates under an independence working model assumption was used for inference. With the raw stringent correlation approach, GEEs were also used to evaluate the combined diagnostic accuracy of multiple imaging variables in a region on the probability of cancer within that region. All P values correspond to two-sided tests, with a P value < .05 considered to represent a significant difference.
Results
Histopathologic Findings
The mean interval between MR imaging and surgery was 35 days (range, 1–141 days). Histopathologic evaluation revealed 628 tumor-positive regions (472 in the PZ, 156 in the TZ) among a total of 2100 regions in 70 patients. Of 628 tumor-positive regions, 211 (141 in PZ, 70 in TZ) contained tumors smaller than 3 mm in diameter, whereas 417 (331 in PZ, 86 in TZ) contained tumors larger than 3 mm in diameter. Gleason scores were 7 or less in 456 (339 in PZ, 117 in TZ) regions, and were greater than 7 in 172 (133 in PZ, 39 in TZ) regions. Extracapsular extension and seminal vesicle invasion were detected in 23 regions in 23 patients and in five patients, respectively. Regional lymph node involvement and distant metastases were not detected in any of the patients, and tumors in 47 (67%) patients were staged as T2N0M0, whereas those in 23 (33%) patients were staged as T3N0M0 at pathologic analysis.
MR Imaging Findings
T2-weighted MR imaging, MR spectroscopy, and dynamic contrast-enhanced MR imaging were performed successfully in 70, 55, and 69 patients, respectively. The mean interval between transrectal US–guided biopsy and MR imaging was 84.5 days (median, 67.5 days; range, 20–366 days). MR imaging assessment was obscured by persistent postbiopsy hemorrhage in 14 patients, all of whom had undergone T2-weighted MR imaging, MR spectroscopy, and dynamic contrast-enhanced MR imaging; these patients underwent imaging studies after a mean interval of 56.8 days (median, 56 days; range, 21–127 days) following biopsy. In imaging analysis of patients with available data for the three modalities, there were 516 (501 in PZ, 15 in TZ), 182 (all in PZ), and 109 (all in PZ) regions with positive findings for tumor on T2-weighted MR images, dynamic contrast-enhanced MR images, and MR spectra, respectively.
Table 2 summarizes the individual sensitivity and specificity of T2-weighted MR imaging, MR spectroscopy, and dynamic contrast-enhanced MR imaging for PZ lesions alone and for PZ and TZ lesions combined, and Table 3 summarizes the specificity for PZ lesions on the basis of lesion size and Gleason score. For example, in Table 2, the overall sensitivity and specificity across all regions for T2-weighted MR imaging were 0.42 (95% CI: 0.36, 0.47) and 0.83 (95% CI: 0.81, 0.86), respectively. With the alternative neighboring approach, sensitivity and specificity values increased to 0.73 (95% CI: 0.67, 0.78) and 0.89 (95% CI: 0.85, 0.93), respectively. Sensitivity for T2-weighted MR imaging was significantly higher than it was for dynamic contrast-enhanced MR imaging or MR spectroscopy, and specificity for T2-weighted MR imaging was lower than it was for dynamic contrast-enhanced MR imaging or MR spectroscopy (P < .001) for all regions, for the traditional and alternative approaches. The results presented in Table 3 suggest that sensitivity may increase with an increase in the lesion size and Gleason score. The sensitivities were higher for tumors that were larger than 3 mm in diameter as compared with those 3 mm or less in diameter (all comparisons were significant, P < .05), with the exception of the alternative definition of sensitivity with the neighboring approach for dynamic contrast-enhanced MR imaging. Sensitivity increments with higher Gleason scores in each modality were not significant except for dynamic contrast-enhanced MR imaging with the alternative neighboring approach.
Table 2.
Diagnostic Performance of T2-weighted MR Imaging, Dynamic Contrast-enhanced MR Imaging, and MR Spectroscopy according to Zone
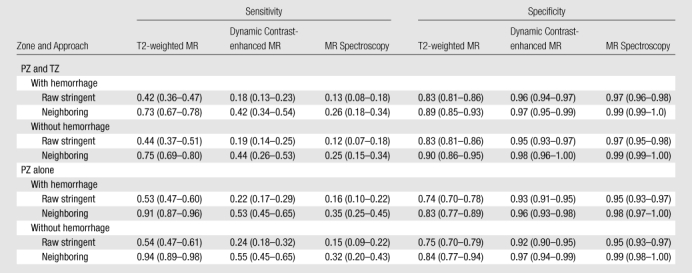
Note.—The raw stringent approach refers to the traditional region-specific definition of sensitivity and specificity, and the neighboring approach refers to alternative approaches by using neighboring sectors. Numbers in parentheses are 95% CIs.
Table 3.
Sensitivity of T2-weighted MR Imaging, Dynamic Contrast-enhanced MR Imaging, and MR Spectroscopy in PZ according to Tumor Size and Grade
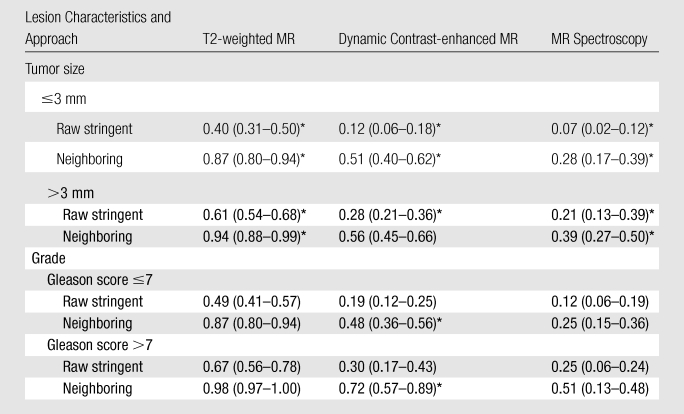
Note.—The raw stringent approach refers to the traditional region-specific definition of sensitivity and specificity, and the neighboring approach refers to alternative approaches by using neighboring sectors. Numbers in parentheses are 95% CIs.
P < .05.
Sensitivity was higher for the combination of T2-weighted MR imaging, MR spectroscopy, and dynamic contrast-enhanced MR imaging for PZ tumors than for each sequence alone, as evaluated by estimating the predictive values (probability of cancer) under different combinations of imaging techniques without using the neighboring approach. The probability of a cancer in a region was estimated as a function of the imaging results for the region. On the basis of the results of the GEEs we found that all three MR imaging modalities provided an independent (ie, additive) predictive value and were significant predictors of cancer by using the GEEs, with P < .001, P = .002, and P = .02 for T2-weighted MR imaging, MR spectroscopy, and dynamic contrast-enhanced MR imaging, respectively (Fig 5). There were no significant interactions among the three imaging variables.
Figure 5:

Predictive value of T2-weighted MR imaging, dynamic contrast-enhanced MR imaging, and MR spectroscopy for tumor detection in PZ. Graph shows probability of pathologically determined cancer in a region as a function of different region-specific imaging results. Predictor was developed by using GEE with a logistic link and independence working correlation structure. Predictor was estimated as Pcan = exp(−1.20 + 0.81T2 + 0.73D + 0.93S)/1 + exp(−1.20 + 0.81T2 + 0.73D + 0.93S), where Pcan is probability of cancer, T2 is T2-weighted MR imaging, D is dynamic contrast-enhanced MR imaging, and S is MR spectroscopy. Bars show ±1 standard deviation in these estimated probabilities, which were obtained by using the delta method. Keys are the same as for Figure 1.
Extracapsular extension was detected in 27 regions in 27 patients, whereas seminal vesicle invasion was detected in six patients at MR imaging. The sensitivity, specificity, false-positive and false-negative rates, and the accuracy of MR imaging for extracapsular extension and seminal vesicle invasion were 78.2% and 80%, 80.9% and 97%, 19.1% and 3.7%, 21.7% and 20%, 80% and 95.7%, respectively. No regional lymph node involvement or distant metastasis was detected in any patient at MR imaging. For 47 patients in whom tumors were staged as T2N0M0 at pathologic analysis, staging was correct in 37 (79%) at MR imaging, whereas in 10 (21%) patients, tumors were overstaged as T3N0M0 and no tumors were understaged. For 23 patients in whom tumors were staged as T3N0M0 at pathologic analysis, tumors were staged correctly in 19 (83%) at MR imaging, whereas in four (17%) patients, tumors were understaged as T2N0M0. Overall, tumors in 56 (80%) of 70 patients were staged correctly, tumors in 10 (14%) of 70 patients were overstaged, whereas in four (6%) patients, tumors were understaged at MR imaging.
Discussion
The ability to accurately detect prostate cancers by using imaging is critical to directing biopsies in patients who are suspected of having cancer, to accurately staging known tumors, and, potentially, to providing image-guided, prostate-sparing therapy in the future. Our results point out several important issues in regard to the diagnostic performance of 3-T MR imaging and difficulties encountered with accurately validating MR imaging with histopathologic correlation. The results show that T2-weighted MR imaging alone had the highest sensitivity for PZ tumors alone and for PZ and TZ tumors combined for both small (≤3 mm) and larger lesions (>3 mm) for all Gleason scores, when compared with functional MR imaging modalities. Although dynamic contrast-enhanced MR imaging and MR spectroscopy alone had lower sensitivity than did T2-weighted MR imaging, they both had higher specificity than did T2-weighted MR imaging, and their addition to the MR imaging protocol increased the accuracy and predictive value of conventional T2-weighted MR imaging for accurately localizing PZ cancers.
The incorporation of functional techniques, such as dynamic contrast-enhanced MR imaging, MR spectroscopy, and diffusion-weighted imaging, is a relatively newer approach for tumor detection and local staging. Our study population was particularly challenging because nearly 25% of tumor-containing regions were in the TZ, where it is difficult to differentiate hyperplastic nodules from cancer lesions (14–16). Furthermore, in our study, 34% of the lesions were 3 mm or smaller at histopathologic analysis, which is clearly challenging for dynamic contrast-enhanced MR imaging and MR spectroscopy, where the section thickness is relatively large (6 mm) and partial volume effects are expected. Over 72% of all lesions were low grade (Gleason score, ≤7) and thus less likely to demonstrate severely altered metabolic profiles (reducing the value of MR spectroscopy) or angiogenesis (reducing the value of dynamic contrast-enhanced MR imaging) (17,18). However, this patient mix is representative of most patients with T1c prostate cancer. MR spectroscopy is sensitive to volume-averaging effects because the magnitude of metabolite changes may be averaged with healthy tissue, leading to false-negative results (8,17). The low sensitivity of dynamic contrast-enhanced MR imaging in the detection of tumors 3 mm or smaller or of low grade can be explained by partial volume averaging with normal tissue, as well as by reduced angiogenesis in small tumors (19).
The sensitivity and specificity values of T2-weighted MR imaging, dynamic contrast-enhanced MR imaging, and MR spectroscopy obtained from our patient group are comparable to those in studies (20–25) reported in the literature in which 1.5-T MR imaging was used. The contribution of functional MR imaging sequences to anatomic imaging is well documented in previous studies performed at 1.5 T (5,20–25). However, caution should be exercised in interpreting these results to imply equivalence between 1.5 T and 3 T because comparable patient populations were not examined at both field strengths. On the other hand, there is a limited documented experience on the incorporation of functional sequences with anatomic imaging for tumor detection at 3 T; although Kim et al (6) concluded that adjunct use of diffusion-weighted imaging with T2-weighted imaging could increase performance compared with T2-weighted imaging alone, Ocak et al (7) reported improvement in specificity by combining T2-weighted MR imaging with dynamic contrast-enhanced MR imaging.
The sensitivity and specificity obtained with raw stringent analysis, which does not consider deformation, shrinkage, or errors in the sectioning angle, were low; however, by applying a neighboring approach, which allows for possible deformation, shrinkage, and slice angle errors without introducing potential bias by using observers who were not blinded, the sensitivity and specificity values were greatly improved. The results of our study, with observers who were blinded, underscore the difficulties in correlating imaging findings with histopathologic findings, given the multiplicity of lesions and the anatomic distortions involved in processing the specimen. The issue of misregistration has been approached in a variety of ways. The neighboring method used in the current study allows a standardized and unbiased approach to assessing correlations between MR imaging findings and histopathologic findings.
The current study had several limitations. First, in some cases, the neighboring approach may lead to an overestimation of the sensitivity of MR imaging. There is a potential for incorrect estimation by using the neighboring approach if sensitivity depends on the number of true-positive lesions in a given patient. Second, the radiologists reviewing the MR images knew that all patients included in the study had biopsy-proved tumor, and this factor could have led to bias during interpretation of MR images. Third, we incorporated Ktrans and kep maps derived from analysis of dynamic contrast-enhanced MR imaging on the basis of a two-compartment model and evaluated those maps visually instead of using quantitative measures, because quantitative values had high standard deviations and interpatient variations. Further studies incorporating quantitative parameters for tumor detection would reduce subjectivity. Finally, diffusion-weighted images, which have shown promise in several studies, were not evaluated in the current study because of a substantial change in technique midway through the study. We intend to incorporate diffusion-weighted imaging in the next cohort of patients studied.
In conclusion, our data indicate that 3-T endorectal MR imaging of the prostate accurately depicts low-moderate-risk prostate cancers in most cases. The results for the combined diagnostic accuracy of T2-weighted MR imaging, dynamic contrast-enhanced MR imaging, and MR spectroscopy for PZ tumors on the basis of the GEEs with the raw stringent approach showed that combined use of anatomic (T2-weighted imaging) and functional (MR spectroscopy and dynamic contrast-enhanced MR imaging) modalities increases performance of MR imaging for tumor detection. Further improvements in temporal resolution and MR spectroscopy could further improve the sensitivity and specificity of prostate MR imaging for early lesions.
Advance in Knowledge.
With combined use of T2-weighted MR imaging with MR spectroscopy and dynamic contrast-enhanced MR imaging at 3 T, a predictive value of 80% can be achieved for prostate cancer detection (P < .05).
Implications for Patient Care.
The sensitivity and specificity values of T2-weighted MR imaging of the prostate are improved with the addition of MR spectroscopy and dynamic contrast-enhanced MR imaging at 3 T.
Larger tumors with higher Gleason scores are more reliably detected at 3-T MR imaging of the prostate.
Received March 18, 2009; revision requested April 21; final revision received September 4; accepted September 30; final version accepted October 28.
Authors stated no financial relationship to disclose.
Funding: This research was supported by the Intramural Research Program , National Institutes of Health, National Cancer Institute, Center for Cancer Research (grant number ZIA BC 010655).
Abbreviations
- CI
- confidence interval
- GEE
- generalized estimating equation
- PRESS
- point resolved spatially localized spectroscopy
- PZ
- peripheral zone
- 3D
- three-dimensional
- THRIVE
- T1-weighted high-resolution isotropic volume examination
- TZ
- transition zone
References
- 1.American Cancer Society Cancer facts & figures 2009 Atlanta, Ga: American Cancer Society, 2009 [Google Scholar]
- 2.Kim CK, Park BK, Kim B. Localization of prostate cancer using 3T MRI: comparison of T2-weighted and dynamic contrast-enhanced imaging. J Comput Assist Tomogr 2006;30(1):7–11 [DOI] [PubMed] [Google Scholar]
- 3.Torricelli P, Cinquantini F, Ligabue G, Bianchi G, Sighinolfi P, Romagnoli R. Comparative evaluation between external phased array coil at 3 T and endorectal coil at 1.5 T: preliminary results. J Comput Assist Tomogr 2006;30(3):355–361 [DOI] [PubMed] [Google Scholar]
- 4.Park BK, Kim B, Kim CK, Lee HM, Kwon GY. Comparison of phased-array 3.0-T and endorectal 1.5-T magnetic resonance imaging in the evaluation of local staging accuracy for prostate cancer. J Comput Assist Tomogr 2007;31(4):534–538 [DOI] [PubMed] [Google Scholar]
- 5.Fütterer JJ, Heijmink SW, Scheenen TW, et al. Prostate cancer localization with dynamic contrast-enhanced MR imaging and proton MR spectroscopic imaging. Radiology 2006;241(2):449–458 [DOI] [PubMed] [Google Scholar]
- 6.Kim CK, Park BK, Lee HM, Kwon GY. Value of diffusion-weighted imaging for the prediction of prostate cancer location at 3T using a phased-array coil: preliminary results. Invest Radiol 2007;42(12):842–847 [DOI] [PubMed] [Google Scholar]
- 7.Ocak I, Bernardo M, Metzger G, et al. Dynamic contrast-enhanced MRI of prostate cancer at 3 T: a study of pharmacokinetic parameters. AJR Am J Roentgenol 2007;189(4):849. [DOI] [PubMed] [Google Scholar]
- 8.Scheenen TW, Heijmink SW, Roell SA, et al. Three-dimensional proton MR spectroscopy of human prostate at 3 T without endorectal coil: feasibility. Radiology 2007;245(2):507–516 [DOI] [PubMed] [Google Scholar]
- 9.Heijmink SW, Fütterer JJ, Hambrock T, et al. Prostate cancer: body-array versus endorectal coil MR imaging at 3 T—comparison of image quality, localization, and staging performance. Radiology 2007;244(1):184–195 [DOI] [PubMed] [Google Scholar]
- 10.Miao H, Fukatsu H, Ishigaki T. Prostate cancer detection with 3-T MRI: comparison of diffusion-weighted and T2-weighted imaging. Eur J Radiol 2007;61(2):297–302 [DOI] [PubMed] [Google Scholar]
- 11.Cooperberg MR, Lubeck DP, Mehta SS, Carroll PR. CaPSURE Time trends in clinical risk stratification for prostate cancer: implications for outcomes (data from CaPSURE). J Urol 2003;170(6 pt 2):S21–S25; discussion S26–S27 [DOI] [PubMed] [Google Scholar]
- 12.Fütterer JJ, Engelbrecht MR, Huisman HJ, et al. Staging prostate cancer with dynamic contrast-enhanced endorectal MR imaging prior to radical prostatectomy: experienced versus less experienced readers. Radiology 2005;237(2):541–549 [DOI] [PubMed] [Google Scholar]
- 13.Zeger SL, Liang KY. Longitudinal data analysis for discrete and continuous outcomes. Biometrics 1986;42(1):121–130 [PubMed] [Google Scholar]
- 14.Kurhanewicz J, Vigneron DB, Hricak H, Narayan P, Carroll P, Nelson SJ. Three-dimensional H-1 MR spectroscopic imaging of the in situ human prostate with high (0.24-0.7-cm3) spatial resolution. Radiology 1996;198(3):795–805 [DOI] [PubMed] [Google Scholar]
- 15.Costello LC, Franklin RB. The intermediary metabolism of the prostate: a key to understanding the pathogenesis and progression of prostate malignancy. Oncology 2000;59(4):269–282 [DOI] [PMC free article] [PubMed] [Google Scholar]
- 16.Testa C, Schiavina R, Lodi R, et al. Prostate cancer: sextant localization with MR imaging, MR spectroscopy, and 11C-choline PET/CT. Radiology 2007;244(3):797–806 [DOI] [PubMed] [Google Scholar]
- 17.Zakian KL, Sircar K, Hricak H, et al. Correlation of proton MR spectroscopic imaging with gleason score based on step-section pathologic analysis after radical prostatectomy. Radiology 2005;234(3):804–814 [DOI] [PubMed] [Google Scholar]
- 18.Pallares J, Rojo F, Iriarte J, Morote J, Armadans LI, de Torres I. Study of microvessel density and the expression of the angiogenic factors VEGF, bFGF and the receptors Flt-1 and FLK-1 in benign, premalignant and malignant prostate tissues. Histol Histopathol 2006;21(8):857–865 [DOI] [PubMed] [Google Scholar]
- 19.Noworolski SM, Vigneron DB, Chen AP, Kurhanewicz J. Dynamic contrast-enhanced MRI and MR diffusion imaging to distinguish between glandular and stromal prostatic tissues. Magn Reson Imaging 2008;26(8):1071–1080 [DOI] [PMC free article] [PubMed] [Google Scholar]
- 20.Cirillo S, Petracchini M, Della Monica P, et al. Value of endorectal MRI and MRS in patients with elevated prostate-specific antigen levels and previous negative biopsies to localize peripheral zone tumours. Clin Radiol 2008;63(8):871–879 [DOI] [PubMed] [Google Scholar]
- 21.Casciani E, Polettini E, Bertini L, et al. Contribution of the MR spectroscopic imaging in the diagnosis of prostate cancer in the peripheral zone. Abdom Imaging 2007;32(6):796–802 [DOI] [PubMed] [Google Scholar]
- 22.Coakley FV, Kurhanewicz J, Lu Y, et al. Prostate cancer tumor volume: measurement with endorectal MR and MR spectroscopic imaging. Radiology 2002;223(1):91–97 [DOI] [PubMed] [Google Scholar]
- 23.Westphalen AC, Coakley FV, Qayyum A, et al. Peripheral zone prostate cancer: accuracy of different interpretative approaches with MR and MR spectroscopic imaging. Radiology 2008;246(1):177–184 [DOI] [PubMed] [Google Scholar]
- 24.Villers A, Puech P, Mouton D, Leroy X, Ballereau C, Lemaitre L. Dynamic contrast enhanced, pelvic phased array magnetic resonance imaging of localized prostate cancer for predicting tumor volume: correlation with radical prostatectomy findings. J Urol 2006;176(6 pt 1):2432–2437 [DOI] [PubMed] [Google Scholar]
- 25.Yu KK, Scheidler J, Hricak H, et al. Prostate cancer: prediction of extracapsular extension with endorectal MR imaging and three-dimensional proton MR spectroscopic imaging. Radiology 1999;213(2):481–488 [DOI] [PubMed] [Google Scholar]