Abstract
In a previous study of ion selectivity of α-hemolysin (αHL) in complex with β-cyclodextrin (βCD) adapter we calculated the potential of mean force (PMF) and characterized the self-diffusion coefficients of isolated K+ and Cl− ions using molecular dynamics simulations [Y. Luo et al. Ion Selectivity of α-Hemolysin with β-Cyclodextrin Adapter: I. Single Ion Potential of Mean Force and Diffusion Coefficient]. In the present effort, these results pertaining to single isolated ions in the wide aqueous pore are extended to take into account multi-ion effects. The grand canonical Monte Carlo/Brownian dynamics (GCMC/BD) algorithm is used to simulate ion currents through the wild type αHL ion channel, as well as two engineered αHL mutants, with and without the cyclic oligosaccaride βCD lodged in the lumen of the pore. The GCMC/BD current-voltage curves agree well with experimental results and show that βCD increases the anion selectivity of αHL. Comparisons between multi-ion PMFs from GCMC/BD simulations and single ion PMFs demonstrate that multi-ion effects and pore shape are crucial for explaining this behavior. It is concluded that the narrow βCD adapter increases the anion selectivity of αHL because it reduces the pore radius locally, which decreases the ionic screening and the dielectric shielding of the strong electrostatic field induced by a nearby ring of positively charged αHL side chains.
Introduction
Using wild type (wt) α-hemolysin (αHL) as a scaffold, Bayley and coworkers have successfully engineered αHL channels, a bacterial exotoxin forming wide heptameric β-barrel channels in the outer membrane of cells,1 for a variety of biotechnological applications, such as stochastic sensing of molecules,2,3 DNA sequencing,4–6 and single-molecule chemistry.7,8 They also succeeded to alter the ion selectivity and permeation properties of αHL by lodging small molecular adapters into the channel.9 A convenient and versatile adapter for αHL is β-cyclodextrin (βCD), a cyclic oligosaccaride made of seven glucose subunits. The interaction of αHL with βCD was studied experimentally10 and with molecular dynamics (MD) simulations.11,12 βCD can bind noncovalently within the αHL pore lumen, but this can be further stabilized by introducing a covalent linker.13 Wu et al.13 were able to design this covalent linker with the aid of crystal structures of the αHL mutants (M113N)7 and (M113F)7 with and without βCD bound (Montoya and Gouaux, unpublished).
Experiments have shown that βCD significantly increases the anion selectivity of wt-αHL as well as the αHL mutants (M113N)7 and (M113F)7.9,13 These mutants have the advantage that they bind βCD 104 times longer than wt-α HL.14 Interestingly, the mutations only exchange nonpolar methionine residues in all seven subunits of αHL by other uncharged residues and βCD is uncharged as well. Therefore, the central question arises: How does βCD increase the weak natural anion selectivity of αHL?
The crystal structure of wt-αHL15 has already enabled theoretical ion permeation studies using an Ohmic approximation,16 approaches based on Poisson-Nernst-Planck electrodiffusion theory in three dimension (3d-PNP),17–20 Brownian dynamics (BD) simulations,18 and all-atom MD simulations.11,21 Some of these studies also address the origin of the weak anion selectivity of αHL, and there is general consensus that the charged residues Lys147 and Glu111 located at one of the narrowest parts of the channel lumen play an important role.17–19 This is consistent with the experimental observation that mutating Lys147 and Glu111 can make αHL slightly cation selective.9
In a first paper,22 hereafter called paper I, we presented the results of single ion potential of mean force (PMF) calculations yielding free energy profiles of a K+ as well as a Cl− ion along the axis of the pore. Single ion PMFs computed for βCD solvated in water indicate that βCD, on its own, gives rise to no selectivity for Cl− over K+. On the other hand, comparing single ion PMFs of the apo channels (M113N)7 and (M113F)7 with those of the βCD bound channels (M113N)7·βCD and (M113F)7·βCD shows that βCD increases the anion selectivity of the channels. This can be partly explained by the short distance between βCD and seven adjacent Lys147 residues, as well as by the partial ion desolvation in the narrow βCD ring, which locally enhances the electrostatic interaction between the ion and the positively charged Lys147 residues. However, single ion PMFs neglect the presence of other ions, which should have an effect, especially in a wide pore like αHL. In fact, electrostatic calculations show that even wt-αHL should strongly favor anions over cations. Yet, this is not observed at physiological concentration. These considerations suggest that multiple ions must be taken into account to correctly grasp the effect of βCD on αHL.
This article is extending the study presented in paper I by investigating the impact of multi-ion effects on the ion selectivity of αHL. The study is based on the crystal structure of wt-αHL15 as well as on the crystal structures of the αHL mutants (M113N)7 and (M113F)7, with and without βCD lodged nocovalently in the pore in two different orientations (Montoya and Gouaux, unpublished). We use the grand canonical Monte Carlo/Brownian dynamics (GCMC/BD) algorithm23 to simulate the dynamics of multiple ions permeating through these αHL channels in an efficient and accurate way. The resulting current-voltage curves, multi-ion PMFs, and reversal potentials of the different αHL structures yield additional insights into the selectivity mechanism of αHL and complement the single ion part studied previously.22
Methods
Preparation of the simulation systems
Six different GCMC/BD simulation systems were constructed using the MD program CHARMM.24–26 One system is based on the crystal structure of wt-αHL.15 Four systems belong to crystal structures of the channels (M113N)7, (M113F)7, (M113N)7·βCD, and (M113F)7·βCD (Montoya and Gouaux, unpublished). Another one is identical to the (M113N)7·βCD system, but with an uncharged βCD molecule, i.e. all partial charges on the βCD atoms were set to zero. This allows to study the influence of the βCD charge distribution. The protonation state of all channels was chosen as described in Ref. 18. In all cases, the CHARMM force field Param2227 was used for the protein. Parameters for βCD were generated with ANTECHAMBER,28 the general AMBER force field (GAFF),29 and the bond charge correction model AM1-BCC.30,31 More details can be found in paper I.22
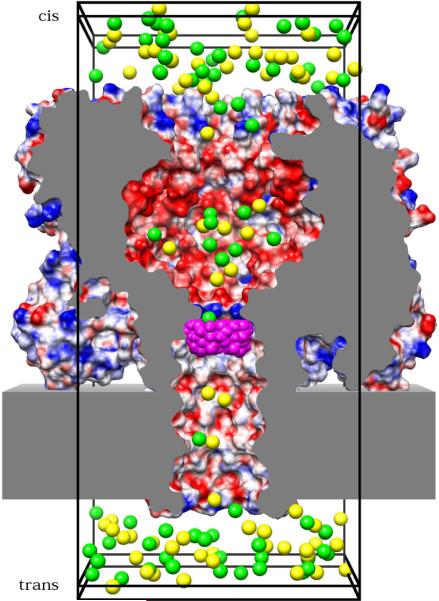
Figure 1 shows the GCMC/BD simulation system of (M113N)7·βCD. The other systems were prepared according to the same method. For all simulation systems, the zero position of the channel axis (z-axis) is located at the center of the membrane. Along the z-axis, the trans entrance of the channel is at about –16Å, the cis entrance at about 84Å, and the center of the βCD molecule at 25Å in the (M113N)7·βCD system and at 26Å in the (M113F)7·βCD system. The αHL pore has a wide cavity below the cis entrance and gets narrower towards the trans side. The latter part of the channel is embedded in a macroscopic membrane model, which represents the low dielectric core of the lipid bilayer as a structureless slab with a thickness of 25Å and a dielectric constant of 2. The same dielectric constant was also applied for the interior of the protein. Water is represented as a continuum with a dielectric constant of 80, which should be appropriate for the wide aqueous pore of αHL. The dielectric boundary between the molecules and the water continuum is defined by overlapping spheres of the protein and the βCD atoms.34 An instantaneous snapshot taken from the ion trajectories of a GCMC/BD simulation at zero membrane voltage is shown in Figure 1.
Figure 1.
GCMC/BD simulation system based on the crystal structure of (M113N)7·βCD (Montoya and Gouaux, unpublished). Parts of the protein and the membrane are truncated to open a view into the channel lumen. The cut surface is grey. The protein surface is colored according to the electrostatic potential (blue is positive, red negative). The slab surrounding the lower part of the channel represents the low dielectric core of the membrane. The βCD molecule (magenta) is lodged at the narrowest part of the pore. Note, in (M113F)7·βCD the orientation of the βCD ring is upside down.13 The simulation box (big black frame, 62Å×62Å×132Å in size) contains K+ (yellow) and Cl− (green) ions, which are the only moving parts of the simulation system. Buffer regions (small black frames, 3Å thick) are located on both ends of the simulation box. Within these buffers a GCMC algorithm is creating and destroying ions to keep the chemical potential on the cis and the trans side of the membrane constant. The image was produced using the program UCSF Chimera.32 The electrostatic potential was computed with the adaptive Poisson-Boltzmann solver (APBS).33
GCMC/BD simulations
The GCMC/BD algorithm23 was used to simulate ion currents across the six αHL simulation systems. It describes the channel as well as the ions in the simulation box in atomic detail, whereas the membrane, the water, and those ions located outside of the simulation box are modeled implicitly. Only the ions in the simulation box are moving during a GCMC/BD simulation, while everything else is fixed. The BD algorithm generates stochastic trajectories for the ions by numerical integration of the Brownian dynamics algorithm of Ermak and McCammon35
| (1) |
where ri is the position of ion i, Di(ri) is the position dependent diffusion coefficient, kB is Boltzmann's constant, T = 300 K is the temperature, ▽ri is the nabla vector differential operator, W is the multi-ion PMF, and ζi(t) is a Gaussian random noise with 〈ζ i(t) ·ζ j(0)〉 = 6Di(ri)δijδ (t).18 The GCMC algorithm creates and annihilates ions to keep the electro-chemical potential of the ions at a chosen and constant value in the two buffer regions near the edges of the simulation box (see Figure 1). When these two electro-chemical potentials differ, then a steady state non-equilibrium flux is established during the GCMC/BD simulation. Appropriate values for the chemical potentials were taken from Ref. 36.
Equation 1 is governed by the gradient of the PMF of all ions in a simulation box
| (2) |
which depends on all ion positions.18 Here, the direct ion-ion pair interactions ujk subsume the shielded Coulomb interactions, Lennard-Jones interactions, and contributions accounting for water-mediated short range interactions.36 The potential Ucore represents the core repulsion from the protein and the membrane. The corresponding envelop for the channel core repulsion was defined as the molecular surface37 calculated with a solvent probe radius of 1.4Å and an optimized set of atomic radii.36 The static field contribution
| (3) |
contains the interactions of the ion charges qj with the shielded electrostatic field arising from the partial charges of the fixed αHL and βCD atoms as well as the applied transmembrane potential. The electrostatic potential ϕsf was calculated by solving the finite difference Poisson-Boltzmann (PB) equation on a discrete grid,38,39 which was stored in memory for efficient GCMC/BD simulations. In order to compute ϕsf, the Poisson-Boltzmann solver needs the electrostatic potential at the grid boundary as an input, which was taken from a previous calculation with a grid spacing of 1.5Å (focussing method). ΔWrf is the reaction field energy of the ions, i.e. the difference between the electrostatic free energy of the ions in the heterogeneous dielectric environment of a simulation system and the corresponding energy of the same ions in a uniform bulk solvent continuum. In previous applications of GCMC/BD, the reaction field was represented by basis set expansions which treat ions as point charges.40 The optimized set of atomic radii used for the channel core repulsion Ucore was derived for GCMC/BD simulations with this reaction field.36 In the present simulations, a new reaction field method for ion channels was applied in order to parametrize ΔWrf.41 Its implementation allows non-zero ion radii, but zero ion radii would cause integral singularities. In order to reproduce the description of ions as point charges with the new reaction field method, a small ion radius of 0.5Å was used for the ions, which is the minimum difference of the atom radii defining the dielectric boundary of the protein and the bigger atom radii used for Ucore.36 Ucore, the electrostatic potential ϕsf, and the parameters for the reaction field energy ΔWrf were calculated and stored on grids with 205×205×281 grid points and a grid spacing of 0.5 Å before a simulation was started. During a GCMC/BD simulation, these grids were employed as look-up tables for an efficient evaluation of Ucore, ΔWsf, and ΔWrf.
A time step of 15 fs was chosen for the numerical integration of the BD equation. One GCMC iteration and one BD move were performed at each time step. The six systems were simulated at different membrane voltages as well as with symmetric and asymmetric ion concentrations. The sign of the transmembrane voltage was chosen so that it represents a setup where the voltage is applied on the trans side of the channel and the cis side is grounded. Starting from a simulation system prepared for a given membrane voltage and salt concentration, but without explicit ions, an initial 30 ns GCMC/BD run filled up the channel with ions and equilibrated them. After that, a 450 ns GCMC/BD simulation followed. In each case, this was done 10 times with different seed values for the random number generator, allowing the calculation of average ion currents and corresponding standard deviations by statistical analysis.
Appropriate profiles for the position-dependent diffusion coefficient Di(ri) in Eq. 1 were created similar to the procedure described in Ref. 18 using the pore radius profile and a hydrodynamic approximation. Figure S1 (supporting information) shows the computed fraction of the bulk diffusion constant along the channel axis for the different simulation systems. The fractions of the bulk diffusion constant for K+ and Cl− within the (M113N)7·βCD pore (blue and red line in Figure S1 a) were calculated in paper I22 from the trajectories of umbrella sampling MD simulations using a propagator based formalism.42 The ion radius for the hydrodynamic approximation was chosen to be 2.25 Å for K+ and Cl−. This value was kept for all simulation systems. With this ion radius and the hydrodynamic approximation, the pore radius profiles of (M113N)7·βCD and (M113F)7·βCD yield the purple and orange lines in Figure S1 a. Their minimal values are close to 0.115, which is the average value of the MD simulation results. For the GCMC/BD simulations, a smoothed diffusion profile (green line) was used. Figure S1 b and Figure S1 c display the corresponding profiles for wt-αHL, (M113F)7, (M113N)7, and their smoothed versions (green lines).
Single- and multi-ion PMF profiles
Besides ion currents, the GCMC/BD program also outputs the average density of K+ and Cl− along the channel axis. From such an ion distribution 〈ρi(z)〉 one can compute the corresponding one-dimensional (1-d) PMF by
| (4) |
The ion distributions from GCMC/BD simulations at zero membrane voltage yield the effective 1-d PMFs for K+ and Cl− at finite ion concentration. An offset energy is added to each 𝓦i(z) so that the resulting 1-d PMF approaches zero outside of the channel, i.e. in bulk solvent. To obtain the 1-d PMF at a vanishingly small ion concentration, three or four BD simulations with a single ion in the pore were performed at zero membrane voltage for each ion species. In each simulation, the ion was confined in the lower part, the upper part, and the middle part of the pore near the βCD, respectively. Each part was overlapping with the neighboring parts of the channel, making it possible to combine the single ion PMFs of the parts, as in umbrella sampling simulations. An offset energy was added to each 𝓦i(z) so that the resulting single ion PMF matches the respective free energy profile of a single ion located along the z-axis of the simulation system, W(x = 0,y = 0,z), which is calculated directly from the free energy function of the GCMC/BD program given in Eq. (2). The single-ion free energy profiles are calculated by moving a single K+ and a single Cl− ion along the z-axis of the simulation system while keeping x = 0 and y = 0.
Results and discussion
Single ion PMFs
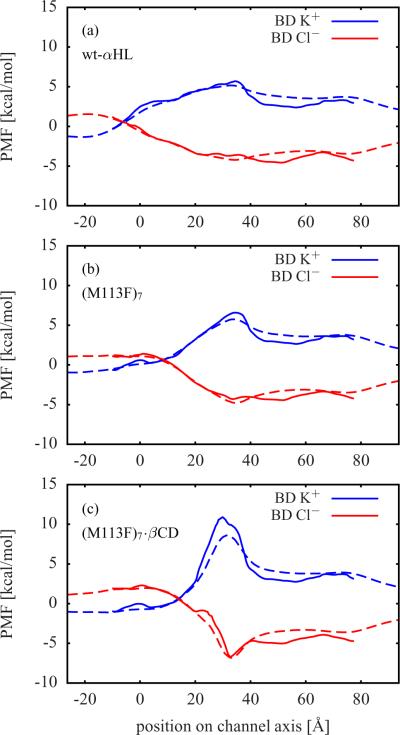
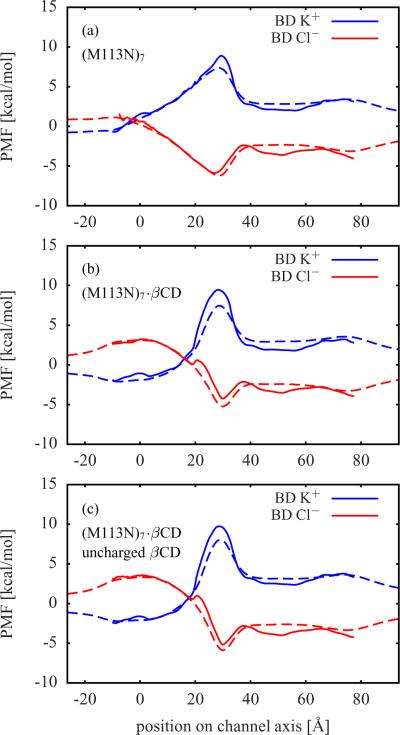
The computed single ion PMFs contain important information about the forces acting on a permeating ion. These PMFs provide a meaningful description of the system at low ion concentrations. Figure 2 shows the single ion PMFs for the wt-αHL, (M113F)7, and (M113F)7·βCD systems. The single ion PMFs for (M113N)7, (M113N)7·βCD, and (M113N)7·βCD with uncharged βCD are displayed in Figure 3. For all simulation systems, the difference between the K+ PMF (solid blue line) and the Cl− PMF (solid red line) has a maximum close to the residues Lys147.22 A K+ ion has to overcome a high free energy barrier in this region, whereas the free energy for a Cl− ion becomes quite negative there. In Figure 1, the narrow ring of seven positively charged Lys147 residues is right above the βCD molecule, where the protein surface is colored in blue in order to represent a high positive electrostatic potential.
Figure 2.
Single ion PMFs from BD simulations (solid lines) for (a) wt-αHL, (b) (M113F)7, and (c) (M113F)7·βCD extracted from BD simulations via Eq. (4). Also shown in dashed lines are the free energy profiles W(x = 0, y = 0,z) of a single K+ or Cl− located along the channel axis calculated via Eq. (2). The BD PMFs are aligned with the corresponding dashed lines.
Figure 3.
Single ion PMFs from BD simulations (solid lines) for (a) (M113N)7, (b) (M113N)7·βCD, and (c) (M113N)7·βCD with all charges on the βCD atoms set to zero Free energy profiles of a single K+ or Cl− located along the channel axis calculated via Eq. (2) are shown as dashed lines. See Figure 2 for further information.
The free energy profiles of an ion constrained along the z-axis of the pore (dashed blue and red lines) only contain contributions from the static field ΔWsf and the reaction field ΔWrf. The deviations of these profiles from the corresponding single ion PMFs (solid blue and red lines) are mainly caused by the variations in the cross-section area of the channels, because in the latter case the ions are not restricted to the z-axis. This can be seen in the region between about 40 Å and 65 Å, where the single ion PMFs are below the respective free energy profiles. In this region αHL has a wide cavity (see Figure 1) and, thus, ions have a higher statistical probability to be found there than in a narrower region. The narrowest region is within the bound βCD molecule. Therefore, the single ion PMFs of the channels with βCD in Figure 2 c, Figure 3 b, and Figure 3 c are above the respective free energy profiles in the region from about 20 Å to 35 Å, where the βCD molecules are located.
The single ion PMFs of αHL with βCD bound have steeper and more localized maxima (K+) and minima (Cl−) than those of the corresponding apo channels. A comparison between (M113N)7·βCD in Figure 3 b and the same system with uncharged βCD in Figure 3 c shows only minor differences in the single ion PMFs. From this, it follows that the partial charges of the βCD atoms should have no significant impact on ion permeation and selectivity.
I-V curves
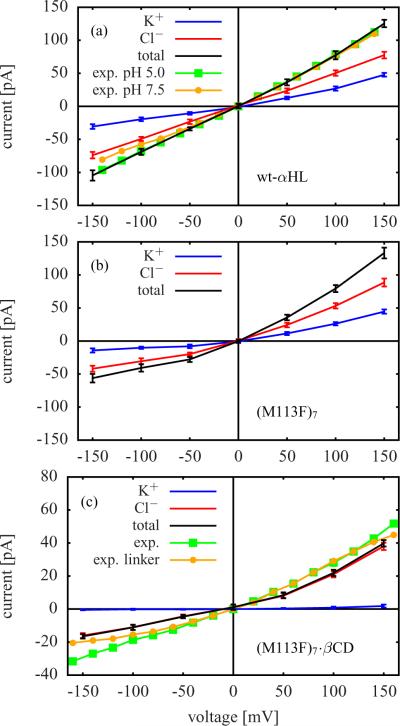
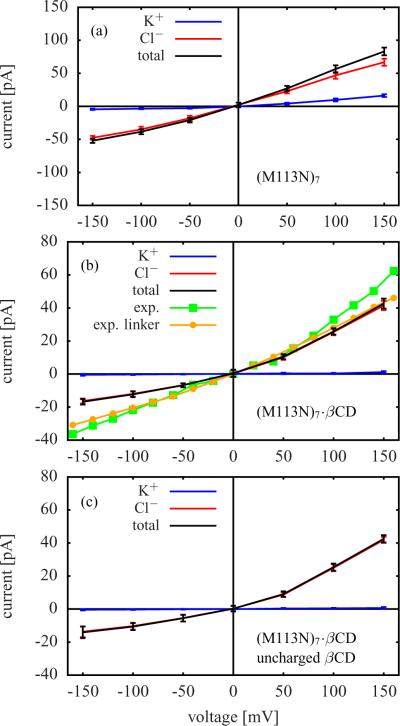
Figure 4 and Figure 5 contain the current-voltage (I-V) curves calculated for the six GCMC/BD simulation systems. The GCMC/BD simulations were performed with a symmetric salt concentration of 1 M KCl on both sides of the membrane. In addition to the GCMC/BD results for wt-αHL, Figure 4 a also shows experimental I-V curves measured at pH 5.0 and pH 7.5 using a symmetric salt concentration of 1 M NaCl.10 Both are in remarkable agreement with the GCMC/BD results. The measurements at pH 5.0 are almost perfectly aligned with the GCMC/BD I-V curve. Figure 4 c and Figure 5 b also contain experimental data which was measured for (M113F)7·βCD and (M113N)7·βCD (pH 8.0 and 1 M KCl) as well as for those versions of these channels possessing a covalent linker between protein and βCD.13 The data agrees well with the respective GCMC/BD results.
Figure 4.
I-V curves from GCMC/BD simulations with symmetric salt concentration (1.0 M KCl on cis and trans side). (a) wt-αHL (including experimental results measured at pH 5.0 and pH 7.5 using a symmetric salt concentration of 1 M NaCl10), (b) (M113F)7, and (c) (M113F)7·βCD (including experimental results for this channel without and with covalent linker between protein and βCD13).
Figure 5.
I-V curves from GCMC/BD simulations with symmetric salt concentration (1.0 M KCl on cis and trans side). (a) (M113N)7, (b) (M113N)7·βCD (including experimental results for this channel without and with covalent linker between protein and βCD13), and (c) (M113N)7·βCD with all charges on the βCD atoms set to zero.
The I-V curves calculated for wt-αHL and the (M113F)7 mutant (Figure 4 a and Figure 4 b) show a weak anion selectivity, because the Cl− currents exceed the still significant K+ currents. Figure 4 c contains the results for (M113F)7·βCD, which are quite different. The total current is reduced compared to (M113F)7. This can be explained by the narrow constriction caused by βCD. Moreover, the total current is now strongly dominated by Cl− ions, whereas the K+ current is suppressed. That is, the anion selectivity increases significantly after adding βCD.
The anion selectivity of (M113N)7 (see K+ and Cl− currents in Figure 5 a) is higher than for (M113F)7 and wt-αHL. This difference can be related to the orientation of the seven positively charged Lys147 residues in the pore.22 In (M113N)7 they are almost perpendicular to the channel axis, which results in a more narrow Lys147 ring than in the other cases so that the local electrostatic field is maximized. A comparison of Figure 5 a and Figure 5 b shows that adding βCD increases the anion selectivity of (M113N)7, which is in accord with the (M113F)7 case discussed above. There is a remarkable similarity between the computed I-V curves of (M113F)7·βCD in Figure 4 c and those of (M113N)7·βCD in Figure 5 b.
The results for (M113N)7·βCD in Figure 5 b and for the same system with uncharged βCD in Figure 5 c agree within the standard deviation of the currents. This is consistent with the high similarity of the respective single ion PMFs in Figure 3 and with the conclusion that the impact of the partial charges located on the βCD atoms is negligible.
Multi-ion PMFs
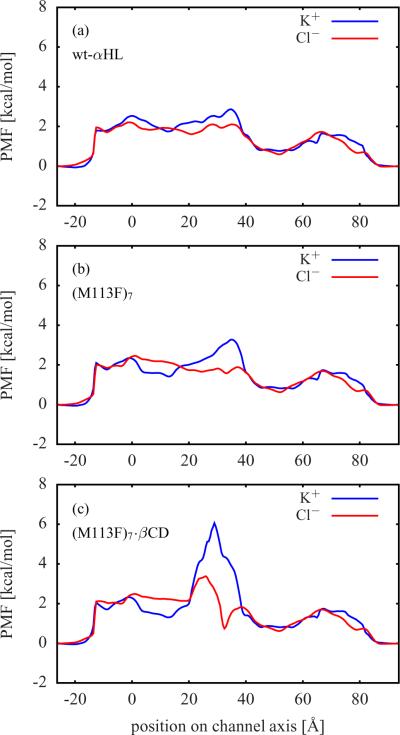
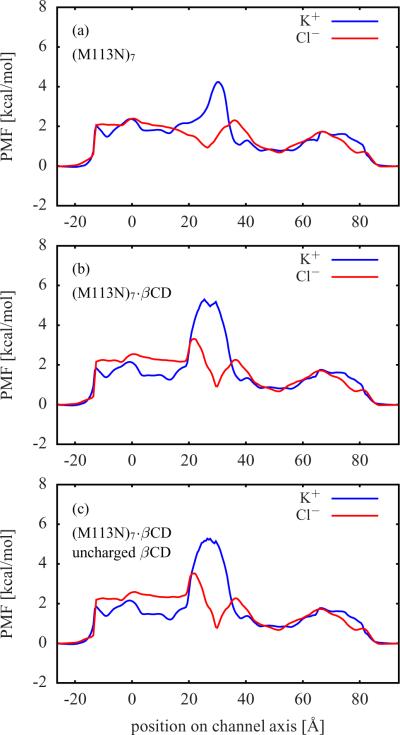
Figure 6 and Figure 7 display the multi-ion PMFs corresponding to the 1.0 M symmetric KCl concentration GCMC/BD simulations at zero current and zero membrane voltage shown in Figure 4 and Figure 5, respectively. These multi-ion PMFs are quite different from the single ion PMFs shown in Figure 2 and Figure 3 due to multi-ion screening. In the case of wt-αHL, the single ion K+ and Cl− PMFs in Figure 2 a differ from each other by up to about 9 kcal/mol, whereas the corresponding multi-ion PMFs in Figure 6 a are very similar, with a maximum difference of less than 1 kcal/mol. This shows the importance of multi-ion effects in wide pores like αHL.
Figure 6.
Multi-ion PMFs from GCMC/BD simulations at zero current and zero membrane voltage with 1.0 M symmetric KCl concentration for (a) wt-αHL, (b) (M113F)7, and (c) (M113F)7·βCD.
Figure 7.
Multi-ion PMFs from GCMC/BD simulations at zero current and zero membrane voltage with 1.0 M symmetric KCl concentration for (a) (M113N)7, (b) (M113N)7·βCD, and (c) (M113N)7·βCD with all charges on the βCD atoms set to zero.
Ionic shielding is the main multi-ion effect in aqueous solution. It reduces the electrostatic interactions between αHL and the ions therein as well as the ion-ion interactions themselves. Thus, the impact of electrostatic interactions in wide pores should decrease with increasing ion concentration and the shape of a pore should become more important. This shape effect is evident in all multi-ion PMFs (see Figure 6 and Figure 7), because there is almost no difference between the K+ and Cl− PMFs in the wide cavity at the cis entrance of the pore (from about 40 Å to 84 Å), although the corresponding parts of the single ion PMFs (see Figure 2 and Figure 3) are always several kcal/mol apart. The reason for this effect is that ions in the wide cavity are able to shield each other from the electrostatic field of the protein. On the other hand, the multi-ion PMFs for K+ and Cl− in the (M113F)7·βCD and (M113N)7·βCD systems differ significantly close to the βCD molecules (see Figure 6 c and Figure 7 b). This is caused by the narrow βCD pore, which decreases the channel radius locally and reduces ionic shielding in its surrounding compared to the wider apo structures (M113F)7 and (M113N)7 (see Figure 6 b and Figure 7 a).
Reversal potentials
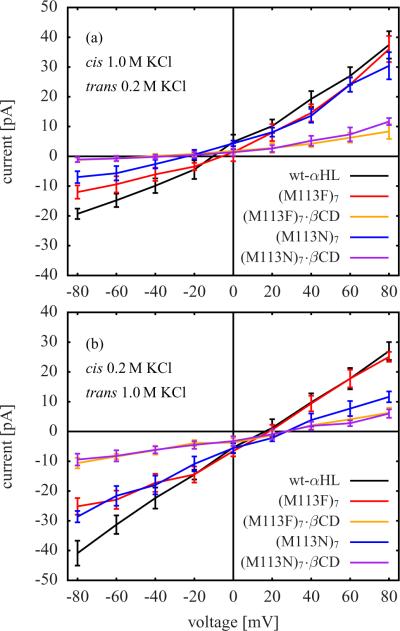
The reversal potential with asymmetric concentration is the most standard measure of ion selectivity. The larger the magnitude of the reversal potential, the more selective is an ion channel. Figure 8 shows I-V curves from GCMC/BD simulations with asymmetric salt concentration. In Figure 8 a the salt concentration was 1.0 M KCl on the cis side and 0.2 M KCl on the trans side of the membrane and in Figure 8 b 0.2 M KCl on the cis side and 1.0 M KCl on the trans side. The corresponding reversal potentials are those voltages which belong to zero current.
Figure 8.
I-V curves from GCMC/BD simulations with asymmetric salt concentration. (a) 1.0 M KCl on cis side and 0.2 M KCl on trans side (location of cis and trans side is indicated in Figure 1). (b) 0.2 M KCl on cis side and 1.0 M KCl on trans side. The reversal potential of a simulation system is the voltage at the intersection of the corresponding I-V curve with the zero current axis.
The reversal potentials from Figure 8 are listed in Table 1. They have large uncertainties, but there is a clear trend that the magnitude of the reversal potential increases after adding βCD to a channel, although the calculated magnitudes tend to overestimate the corresponding experimental ones.9,13 Additional tests indicate that the overestimated reversal potentials are due to the rigid protein structure approximation used in the GCMC/BD simulations. Even though the channel structure is extremely stable, all-atom MD simulations of αHL in an explicit membrane have shown that that there is a range of dynamics and that the interior of the pore is flexible.21 In particular, this flexibility allows charged and polar residues in the pore lumen to adjust and respond to electrostatic fields, so that direct Coulomb interactions are partly reduced. The rigid pore in the present GCMC/BD simulations does not fluctuate, giving rise to stronger electrostatic interactions and slightly overestimated reversal potentials. To illustrate the effect of a reduced electrostatic field, GCMC/BD simulations of wt-αHL with all protein charges scaled down by a factor of 0.5 were carried. The resulting reversal potentials are close to the corresponding experimental values (see Table 1). This problem appears to be more acute for the simulations of αHL without βCD. For αHL mutants with bound βCD, the approximation of the rigid structure used in the GCMC/BD simulations is more accurate, because the fluctuations of the residues in the narrowest part of the pore are restricted by the βCD molecule. As a result, there is better agreement between experiment and simulation.
Table 1.
Reversal potentials from Figure 8 and from additional GCMC/BD simulations.
| System | Reversal potential [mV] | |||
|---|---|---|---|---|
| 1.0M/0.2Ma | 0.2M/1.0Ma | |||
| GCMC/BD | Exp. | GCMC/BD | Exp. | |
| wt-αHL | −10±4 | −3.7g | 16 ± 7 | 9.1g |
| wt-αHLb | −5±7 | 9 ± 5 | ||
| wt-αHLc | −9±5 | 16 ± 4 | ||
| wt-αHLd | −14±4 | 19 ± 6 | ||
| wt-αHLe | -−0.5 | 11.2 | ||
| (M113N)7 | −24±8 | −2.2g | 27 ± 3 | 6.0g |
| (M113N)7f | −10±5 | 20 ± 4 | ||
| (M113N)7·βCD | −34±18 | −32.3g | 27 ± 8 | 29.7g |
| (M113N)7·βCDf | −25±15 | 28 ± 10 | ||
| (M113F)7 | −6±9 | −5.0h | 18 ± 4 | 11.4h |
| (M113F)7f | −13±5 | 19 ± 4 | ||
| (M113F)7·βCD | −43±14 | −26.0h | 28 ± 6 | 28.3h |
| (M113F)7·βCDf | −28±16 | 19 ± 10 | ||
Ratio of salt concentrations [KCl]cis/[KCl]trans
Protein charges scaled by a factor of 0.5
Dielectric constant of 4 instead of 2 within the protein and the membrane
Simulations without reaction field
Results from Noskov et al.;18
Mutant models generated from the wt-αHL structure
Experimental results taken from Ref. 9
Experimental results for the similar systems (M113F)6(M113C-D8RL2)1 and (M113F)6(M113C-D8RL2)1·βCD possessing a covalent linker between protein and βCD.13
Table 1 also contains reversal potentials from additional GCMC/BD simulations with asymmetric KCl concentration. In one wt-αHL system, a dielectric constant of 4 instead of 2 was used within the protein and the membrane. This increase in the dielectric constant has no significant effect on the reversal potential. In another wt-αHL system, the reaction field energy ΔWrf was omitted, which increases the magnitude of the reversal potential. The results of Noskov et al.18 for wt-αHL have lower reversal potential magnitudes.
In addition to the crystal structures of the αHL mutants (M113N)7 and (M113F)7, paper I22 also discusses respective mutants which were modeled using wt-αHL as a template. The free energy profiles of these mutant models are similar to the corresponding wt-αHL profile, but deviate from the profiles calculated for the (M113N)7 and (M113F)7 crystal structures. This is due to minor variations in the protein structures, which also cause the differences between the reversal potentials of the mutant models and the corresponding crystal structures in Table 1. The differences are significant, in particular in the case of (M113N)7, and show that the effect of structural variations is not negligible. In the cases of the mutant models equipped with βCD and the respective crystal structures, this effect is also evident.
Table 2 contains the reversal potentials from GCMC/BD simulations of wt-αHL with different asymmetric salt concentrations [KCl]cis and [KCl]trans. The value of the ratio [KCl]cis/[KCl]trans is the same in all cases. The results show that the reversal potential increases significantly by decreasing the ion concentration. That is, the ion selectivity depends strongly on the number of ions in the pore and multi-ion effects have to be taken into account in order to understand the charge specificity of αHL.
Table 2.
Reversal potentials from GCMC/BD simulations of wt-αHL with different asymmetric KCl concentrations.
| [KCl]cis/[KCl]trans | Reversal potential [mV] |
|---|---|
| 0.4M/2.0M | 12±4 |
| 0.2M/1.0M | 16±7 |
| 0.1M/0.5M | 24±6 |
| 0.02M/0.1M | 31±5 |
Lastly, it is worth pointing out that there is no simple and direct relationship between the reversal potentials and the multi-ion PMFs shown in Figure 6 and Figure 7. The latter were extracted from equilibrium BD simulations under symmetric concentration at zero current and zero membrane voltage, whereas the reversal potential results from a complex interplay between different factors in nonequilibrium simulations under asymmetric conditions. As shown by a comparison of Figure 2 and Figure 3 with Figure 6 and Figure 7, the effective PMFs of ions along the pore is extremely sensitive to the local ion concentration. Clearly, the local average ion concentration in the nonequilibrium simulations modulates the amount of multi-ion screening, which in turn, quantitatively controls the reversal potential.
Conclusion
In this second part of the study on ion selectivity of engineered αHL channels with βCD adapter, the impact of multi-ion effects was investigated using GCMC/BD simulations. That βCD is not ion selective on its own was already a result of the first part of the study,22 but it is confirmed here from the highly similar results of the GCMC/BD simulations for (M113N)7·βCD and (M113N)7·βCD with uncharged βCD.
The I-V curves calculated with the GCMC/BD algorithm at symmetric salt concentration are in good agreement with experiments and show a significant increase in anion selectivity after lodging βCD into an αHL pore. This trend was also seen in the reversal potentials from simulations at asymmetric salt concentrations. Further simulations of wt-αHL with asymmetric salt concentrations showed that an increase in salt concentration causes a decrease in ion selectivity, which can be explained by ion shielding of the electrostatic field induced by the protein. In a recent article,43 it was demonstrated that such concentration effects can help to distinguish different molecule species from each other in stochastic sensing experiments.
Comparisons between single and multi-ion PMFs showed that, in addition to electrostatic ion-protein interactions, multi-ion effects in combination with the pore shape play an important role for ion selectivity. In particular, the wide cavity at the cis side of the channels provides enough space for ion shielding, which makes this pore region non-selective in the multi-ion case, although the single ion PMFs are selective there. On the other hand, the narrow βCD region prevents ion shielding and, thus, enables strong ion-protein interactions. In addition, the first part of the study22 showed that an ion inside the narrow βCD molecule gets partially desolvated. These results complement each other and explain why βCD increases the anion selectivity of αHL. It is mainly because βCD reduces locally the ion shielding and also the water shielding of the strong electrostatic field induced by the nearby ring of seven Lys147 residues.
Supplementary Material
Acknowledgement
We are grateful to Eric Gouaux and Michelle Montoya for unpublished X-ray structures of αHL mutants with and without βCD bound. Useful discussions with Janice Robertson, Sergei Noskov, Devleena Shivakumar, Albert Pan, Luca Maragliano, Haichen Wu, and Hagan Bayley are acknowledged. This work was funded by the National Institutes of Health (NIH) through the NIH Roadmap for Medical Research (award number PHS 2 PN2 EY016570B) and by a research fellowship from the Deutsche Forschungsgemeinschaft (German Research Foundation). It was supported in part by the National Science Foundation through TeraGrid resources provided by the National Center for Supercomputing Applications (NCSA).
Footnotes
Supporting Information Available Figure S1 with the diffusion profiles used in the GCMC/BD simulations.
References
- (1).Gouaux E. J. Struct. Biol. 1998;121:110–122. doi: 10.1006/jsbi.1998.3959. [DOI] [PubMed] [Google Scholar]
- (2).Bayley H, Cremer PS. Nature. 2001;413:226–230. doi: 10.1038/35093038. [DOI] [PubMed] [Google Scholar]
- (3).Bayley H. Bioorg. Chem. 1995;23:340–354. [Google Scholar]
- (4).Howorka S, Cheley S, Bayley H. Nature Biotech. 2001;19:636–639. doi: 10.1038/90236. [DOI] [PubMed] [Google Scholar]
- (5).Ashkenasy N, Sánchez-Quesada J, Bayley H, Ghadiri MR. Angew. Chem. Int. Ed. 2005;44:1401–1404. doi: 10.1002/anie.200462114. [DOI] [PMC free article] [PubMed] [Google Scholar]
- (6).Astier Y, Braha O, Bayley H. J. Am. Chem. Soc. 2006;128:1705–1710. doi: 10.1021/ja057123+. [DOI] [PubMed] [Google Scholar]
- (7).Luchian T, Shin S-H, Bayley H. Angew. Chem. Int. Ed. 2003;42:1926–1929. doi: 10.1002/anie.200250666. [DOI] [PubMed] [Google Scholar]
- (8).Luchian T, Shin S-H, Bayley H. Angew. Chem. Int. Ed. 2003;42:3766–3771. doi: 10.1002/anie.200351313. [DOI] [PubMed] [Google Scholar]
- (9).Gu L-Q, Dalla Serra M, Vincent JB, Vigh G, Cheley S, Braha O, Bayley H. Proc. Natl. Acad. Sci. U.S.A. 2000;97:3959–3964. doi: 10.1073/pnas.97.8.3959. [DOI] [PMC free article] [PubMed] [Google Scholar]
- (10).Gu L-Q, Bayley H. Biophys. J. 2000;79:1967–1975. doi: 10.1016/S0006-3495(00)76445-9. [DOI] [PMC free article] [PubMed] [Google Scholar]
- (11).Shilov IY, Kurnikova MG. J. Phys. Chem. B. 2003;107:7189–7201. [Google Scholar]
- (12).Mamonova T, Kurnikova M. J. Phys. Chem. B. 2006;110:25091–25100. doi: 10.1021/jp065009n. [DOI] [PMC free article] [PubMed] [Google Scholar]
- (13).Wu H-C, Astier Y, Maglia G, Mikhailova E, Bayley H. J. Am. Chem. Soc. 2007;129:16142–16148. doi: 10.1021/ja0761840. [DOI] [PubMed] [Google Scholar]
- (14).Gu L-Q, Cheley S, Bayley H. J. Gen. Physiol. 2001;118:481–493. doi: 10.1085/jgp.118.5.481. [DOI] [PMC free article] [PubMed] [Google Scholar]
- (15).Song L, Hobaugh MR, Shustak C, Cheley S, Bayley H, Gouaux JE. Science. 1996;274:1859–1865. doi: 10.1126/science.274.5294.1859. [DOI] [PubMed] [Google Scholar]
- (16).Smart OS, Coates GMP, Sansom MSP, Alder GM, Bashford CL. Faraday Discuss. 1998;111:185–199. doi: 10.1039/a806771f. [DOI] [PubMed] [Google Scholar]
- (17).Misakian M, Kasianowicz JJ. J. Membr. Biol. 2003;195:137–146. doi: 10.1007/s00232-003-0615-1. [DOI] [PubMed] [Google Scholar]
- (18).Noskov SY, Im W, Roux B. Biophys. J. 2004;87:2299–2309. doi: 10.1529/biophysj.104.044008. [DOI] [PMC free article] [PubMed] [Google Scholar]
- (19).Cozmuta I, O'Keeffe JT, Bose D, Stolc V. Mol. Sim. 2005;31:79–93. [Google Scholar]
- (20).O'Keeffe J, Cozmuta I, Bose D, Stolc V. Chem. Phys. 2007;342:25–32. [Google Scholar]
- (21).Aksimentiev A, Schulten K. Biophys. J. 2005;88:3745–3761. doi: 10.1529/biophysj.104.058727. [DOI] [PMC free article] [PubMed] [Google Scholar]
- (22).Luo Y, Egwolf B, Walters DE, Roux B. submitted.
- (23).Im W, Seefeld S, Roux B. Biophys. J. 2000;79:788–801. doi: 10.1016/S0006-3495(00)76336-3. [DOI] [PMC free article] [PubMed] [Google Scholar]
- (24).Brooks BR, Bruccoleri RE, Olafson BD, States DJ, Swaminathan S, Karplus M. J. Comput. Chem. 1983;4:187–217. [Google Scholar]
- (25).Schleif R. Analysis of Protein Structure and Function: A Beginner's Guide to CHARMM. 2006 http://gene.bio.jhu.edu.
- (26).Brooks BR, et al. J. Comput. Chem. 2009;30:1545–1614. doi: 10.1002/jcc.21287. [DOI] [PMC free article] [PubMed] [Google Scholar]
- (27).MacKerell AD, Jr., et al. J. Phys. Chem. B. 1998;102:3586–3616. doi: 10.1021/jp973084f. [DOI] [PubMed] [Google Scholar]
- (28).Wang J, Wang W, Kollman PA, Case DA. J. Mol. Graph. Model. 2006;25:247–260. doi: 10.1016/j.jmgm.2005.12.005. [DOI] [PubMed] [Google Scholar]
- (29).Wang J, Wolf RM, Caldwell JW, Kollman PA, Case DA. J. Comput. Chem. 2004;25:1157–1174. doi: 10.1002/jcc.20035. [DOI] [PubMed] [Google Scholar]
- (30).Jakalian A, Bush BL, Jack DB, Bayly CI. J. Comput. Chem. 2000;21:132–146. [Google Scholar]
- (31).Jakalian A, Jack DB, Bayly CI. J. Comput. Chem. 2002;23:1623–1641. doi: 10.1002/jcc.10128. [DOI] [PubMed] [Google Scholar]
- (32).Pettersen EF, Goddard TD, Huang CC, Couch GS, Greenblatt DM, Meng EC, Ferrin TE. J. Comput. Chem. 2004;25:1605–1612. doi: 10.1002/jcc.20084. [DOI] [PubMed] [Google Scholar]
- (33).Baker NA, Sept D, Joseph S, Holst MJ, McCammon JA. Proc. Natl. Acad. Sci. U.S.A. 2001;98:10037–10041. doi: 10.1073/pnas.181342398. [DOI] [PMC free article] [PubMed] [Google Scholar]
- (34).Nina M, Beglov D, Roux B. J. Phys. Chem. B. 1997;101:5239–5248. [Google Scholar]
- (35).Ermak DL, McCammon JA. J. Chem. Phys. 1978;69:1352–1360. [Google Scholar]
- (36).Im W, Roux B. J. Mol. Biol. 2002;322:851–869. doi: 10.1016/s0022-2836(02)00778-7. [DOI] [PubMed] [Google Scholar]
- (37).Richards FM. Ann. Rev. Biophys. Bioeng. 1977;6:151–176. doi: 10.1146/annurev.bb.06.060177.001055. [DOI] [PubMed] [Google Scholar]
- (38).Roux B. Biophys. J. 1997;73:2980–2989. doi: 10.1016/S0006-3495(97)78327-9. [DOI] [PMC free article] [PubMed] [Google Scholar]
- (39).Im W, Beglov D, Roux B. Comput. Phys. Commun. 1998;111:59–75. [Google Scholar]
- (40).Im W, Roux B. J. Chem. Phys. 2001;115:4850–4861. [Google Scholar]
- (41).Egwolf B, Roux B. Biophys. J. Supp. Abs. 2008;94:745a–746a. [Google Scholar]
- (42).Hummer G. New J. Phys. 2005;7:34. [Google Scholar]
- (43).Zhao Q, Jayawardhana DA, Guan X. Biophys. J. 2008;94:1267–1275. doi: 10.1529/biophysj.107.117598. [DOI] [PMC free article] [PubMed] [Google Scholar]
Associated Data
This section collects any data citations, data availability statements, or supplementary materials included in this article.


