Abstract
Two sediment cores were collected from a marina in the San Francisco Bay to characterize historical sediment contamination resulting from the direct discharge of industrial wastewater from Naval Air Station Alameda. Depth profiles of trace metals, petroleum hydrocarbons, and radionuclides were determined with a 12-cm spacing down to a depth of 120 cm. The chronology of sediment accumulation is established by depth profiles of sedimentary time markers in conjunction with information on site history. The traditional approach of determining sediment accumulation rates by measuring atmospheric 210Pb deposition was obscured by a larger source of 210Pb in the sediments from the decay of anthropogenic 226Ra, likely from luminescent paints used at this facility and released to the marina. The sedimentation rates inferred from the data indicate that the greatest amount of contamination by trace metals and petroleum hydrocarbons took place between 1940 and 1960. In addition, anthropogenic 226Ra activities are positively correlated with some of the contaminants in the sediments, allowing the wastewater discharged from the facility to be distinguished from baywide contamination. In locations such as this, where there is a complex history of contaminant deposition, a source-specific tracer may be the only feasible method of attributing historical contamination to a point source.
Keywords: Water pollution, History, Sediment, Metals, California, San Francisco, Hydrocarbons
Introduction
Contaminated marine sediments are an important international problem that requires appropriate methods for site characterization and remediation. Contaminated sediments are typically found in estuaries near urban, industrial, and agricultural areas where fine-grained sediments accumulate. In general, the spatial extent of contamination is extensive while the vertical extent is limited. Two issues drive the need for characterization and remediation of contaminated sediment: the adverse impact on the ecosystem and the potential for contaminant bioaccumulation into fish and shell-fish used for human consumption National Research Council (NRC 1997).
The San Francisco Bay has received wastes from municipal, industrial, agricultural, and mining activities that have altered the sediment quality (Hornberger et al. 1999). A recent study of the impact of human activities on sediments within San Francisco Bay (van Geen and Luoma 1999) demonstrated that historical contamination in Northern California was recorded chronologically in the sedimentary record. If sediment remediation is warranted, the contaminant depositional record must be deconvoluted into contaminants from both regional nonpoint sources and local point sources. This study characterizes the vertical distribution of contaminants in two sediment cores from a marina in the San Francisco Bay that is adjacent to industrial wastewater outfalls. Sedimentation rates in the marina are determined using natural and anthropogenic radionuclides 210Pb and 137Cs along with historical records. These rates are then used to reconstruct contaminant depositional histories. The contribution of contamination from local sources is distinguished from baywide contamination by identifying and correlating a component specific to local industrial operations. This study was part of a larger environmental investigation by the U.S. Navy to close the air station and return the facility to the local community (PRC Environmental Management, Inc. 1994; O’Day et al. 2000).
Krishnaswami et al. (1971), Koide et al. (1973), and Robbins and Edgington (1975) originally established the use of 210Pb and 137Cs to measure sedimentation rates in marine and lacustrine sediments. This technique was promptly applied to industrial pollution in the sedimentary record (Bruland et al. 1974; Edgington and Robbins 1976; Schubel and Hirschberg 1977; Goldberg et al. 1979). Many recent studies have incorporated this geochronological method to constrain the time of contaminant deposition (Bopp and Simpson 1989; Macdonald et al. 1991; Valette-Silver 1993; Krom et al. 1994; Gerritse et al. 1998; Palanques et al. 1998; Smith and Schafer 1999; van Geen and Luoma 1999; Yunker et al. 1999), but none distinguished specific point sources in complex depositional environments.
Site History
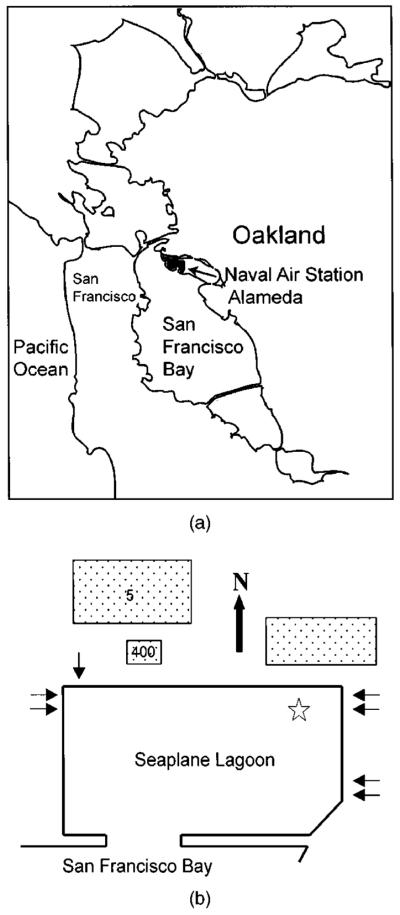
The former Alameda Naval Air Station is one of many military bases that has closed and requires a site investigation prior to returning the facility to the local community. The Seaplane Lagoon is a marina within this facility at the western end of Alameda Island, adjacent to the city of Oakland as shown in Figs. 1(a and b). The rectangular marina was constructed in the 1930s on mudflats by the use of seawalls and dredging to a water depth of 6–7 m that reached into a consolidated sand formation called the Merritt Sand. The surface area of the lagoon is 4.5×10⁵ m2 and there is a 250-m-wide opening with access to San Francisco Bay. The marina is a site for sediment accumulation since it was dredged deeper than its preconstruction condition and is relatively protected from the currents and wind-generated waves in the larger bay system. Even so, there was no maintenance dredging required during facility operations. During the period 1943–1975 storm water and untreated industrial wastewater exclusively from the air station were discharged into the marina through seven outfalls indicated in Fig. 1(b). Use of 226Ra to enhance night visibility of indicator needles, knobs, and deck markings began in the 1940s in the dial paint section of the instrument shop located in Building 5 treatment [Naval Energy and Environmental Support Activity (NEESA 1983)]. Normal operations in this building involved scraping old paint, cleaning with solvent, and repainting with paint containing 226Ra. Wastes from this location were discharged directly into the Seaplane Lagoon through the western outfall locations. The radium dial paint shop was closed in the late 1950s or early 1960s. Any refurbishing of radioluminescent paint was then performed on the second floor of Building 400 treatment (NEESA 1983). Between 1972 and 1975 the industrial wastewater from the whole facility was isolated and diverted for treatment (NEESA 1983). The industrial wastewater plumbing system from Buildings 5 and 400 has been removed due to high 226Ra levels on the interior pipe surfaces.
Fig. 1.
(a) Regional location of Naval Air Station Alameda and (b) diagram of Seaplane Lagoon. Arrows indicate location of wastewater outfalls. Star indicates sampling location. Relevant buildings are indicated by their building numbers
Experimental Methods
Coring
In July 1997, two sediment cores were collected using a gravity corer near the wastewater outfalls at the northeast corner of the marina as indicated in Fig. 1. These two cores were separated by approximately 3 m. The gravity corer was 1.8 m long with a clear acrylic liner (9 cm internal diameter) and weighed 330 kg. Each sediment core was approximately 120 cm in length. Complete cores were collected because the sediment-water interface on the inside was the same as the mud level on the outside of the core barrel. In addition, the water above the sediment was not turbid, indicating no sediment loss by resuspension. Cores were maintained in a vertical position at all times during core acquisition and transport to shore. The cores were packed vertically in dry ice for 24 h until completely frozen to retain any semivolatile organic constituents and to prevent disturbance of the core during transport to the laboratory. Once in the laboratory, the cores were stored at −15°C until they were sampled.
Both frozen cores were sectioned with a hacksaw into ten intervals, each approximately 12 cm deep. One core was used for radiologic analysis and bulk density determinations; the other was subsectioned for organic, metal, and bulk density determinations. Samples subsectioned for organic and metal analyses were approximately 9 cm in length; samples subsectioned for radiologic analyses were approximately 5 cm long; and bulk density profiles used subsections of approximately 2.5 cm. The frozen sediment was then extruded from the acrylic liner by hand and trimmed with a stainless steel surgical saw on all sides to avoid contamination from smearing during coring, sawing, and extrusion.
Dry bulk density was determined by gravimetric analysis after heating at 104°C. Porosity was determined from the measured wet volume and mass loss of the wet sediment after drying, assuming all pore space was filled with water.
Chemical Analysis
Samples for organic and metals analyses were kept frozen until they were thawed for extraction and analyses. The samples were homogenized over the depth interval of each sample. Methods for determining organic and metal concentrations in the sediment followed EPA guidelines (EPA 1996). The organic contaminants were extracted ultrasonically from the thawed sediment (3550A method). Total petroleum hydrocarbons (TPH) were measured using gas chromatography (8100 modified method). TPH were calculated from the gas chromatogram using Diesel No. 2 as the standard that most closely matched the hydrocarbon fingerprints in the samples. The metal contaminants were extracted from the thawed sediment by acid digestion (3050 method). The metals were measured using inductively coupled plasma–mass spectrometry (6020 method).
Radionuclide Analysis
The activities of the radionuclides 40K, 137Cs, 226Ra, 228Ra, and 228Th were determined by gamma spectrometry using germanium solid-state detectors with a planar geometry. Details of the method are described by Wong et al. (1992); Bandong et al. (2001); and Volpe et al. (2001). 40K was quantified due to its association with clay minerals, 137Cs as a tracer of atmospheric weapons testing, and radium and thorium isotopes to examine natural and anthropogenic sources of other radionuclides in the sediment. A 60–100 g sample of freeze-dried sediment was hermetically sealed into an aluminum can and stored for 30–60 days to allow 222Rn (3.8-day half-life) and 214Pb (26.8-min half-life) to establish secular equilibrium with 226Ra. Secular equilibrium occurs when the activities in a radionuclide decay series are equal. Samples were counted for 2–3 days in a low-level counting facility at Lawrence Livermore National Laboratory (LLNL) on calibrated detectors. Uncertainties (1 SD) from counting statistics, peak fitting, and line averaging were between 1 and 5%. With the exception of 137Cs, the nuclides mentioned were seen in every sample. Detection limits for 137Cs ranged from 8.3×10⁻⁵ to 4.3 ×10⁻⁴ Bq/g (0.005–0.026 dpm/g, where dpm indicates disintegrations per minute).
210Pb activity was determined by isotope-dilution alpha spectrometry of its 210Po granddaughter. The details of the method are described by Benoit and Hemond (1988); Wong et al. (1992); and Ritson et al. (1994). The method assumes secular equilibrium between 210Pb and 210Po, which is reasonable for sediments. In preparation of marine sediments for analysis, a standard practice is to leach approximately 1 g of dry sediment in hot nitric acid after addition of a 209Po tracer, evaporate the leachate to dryness, reconstitute the residue in hydrochloric acid, and then deposit polonium onto a small silver planchet. The planchet is then alpha counted using partially depleted silicon surface barrier detectors, and the 210Po activity is determined from the measured 210Po/209Po activity ratio. The uncertainty for the measurements is less than 6% (1 SD) and is dominated by counting statistics.
The normal technique for 210Pb determination was modified to remove the high concentration of refractory organic matter. One set of samples was dry ashed in a muffle furnace at 450°C (Krom and Berner 1983) and then leached in hot 1:3 hydrochloric:nitric acid. A second set of samples was leached in 1:3 hydrochloric:nitric acid and then wet ashed with hydrogen peroxide in concentrated nitric acid. Studies at LLNL (Wong et al. 1992) have shown that hot acid leaches quantitatively extract 210Po from marine sediments. Results from samples dry ashed were systematically low, indicating some loss of 210Po; therefore only 210Pb data from the wet-ashing protocol were considered.
Results
Seaplane Lagoon sediment properties are not uniform throughout the recovered depth of 120 cm. The sediment was black fine-grained silty clay from 0 to approximately 90 cm below the sediment-water interface. From 90 cm to the bottom of the core the sediment rapidly graded into a gray silty sand of the Merritt Sand formation. There was no visual evidence of sediment reworking by benthic grazing organisms or benthic infauna. Bulk density and porosity are reported in Tables 1(a and b) for the two cores. Over the depth interval 0–90 cm below the sediment-water interface the dry bulk density is about 0.4 g/cm3 and the porosity is about 75% in both cores. Since there is no evidence for compaction of the sediment over the depth interval of 0–90 cm, sedimentation rates are calculated as depth per time instead of reporting mass accumulation rates. The physical properties of the sediment were disturbed below 90 cm by the core retainer used to keep the sediment in the acrylic liner during sampling. Changes in sediment mineralogy can be discerned through 40K measurements since 40K is often used as a surrogate for clay content. The 40K activity at each measured interval (Table 2) from 0 to 90 cm below the sediment-water interface was 0.45±0.05 Bq/g (27±3 dpm/g). The uniformity in 40K activity and physical properties of the sediment indicates that there was no substantial change in sediment composition during the time period that deposited the upper 90 cm of sediment.
Table 1.
Sediment Bulk Properties
| Average depth (cm) |
Sample interval (cm) |
Dry bulk density (g/cm3) |
Porosity (–) |
|---|---|---|---|
| (a) Isotope core | |||
| 6.4 | 3.1 | 0.41 | 0.75 |
| 19 | 2.9 | 0.40 | 0.74 |
| 32 | 2.7 | 0.37 | 0.74 |
| 45 | 2.6 | 0.34 | 0.76 |
| 57 | 2.6 | 0.34 | 0.74 |
| 70 | 2.8 | 0.34 | 0.76 |
| 83 | 2.3 | 0.48 | 0.74 |
| 95 | 2.8 | 0.93 | 0.57 |
| 108 | 2.8 | 0.53 | 0.70 |
| 121 | 2.6 | 0.68 | 0.66 |
|
| |||
| (b) Organic and metals core | |||
| 10 | 2.6 | 0.42 | 0.74 |
| 23 | 2.4 | 0.43 | 0.73 |
| 33 | 2.9 | 0.45 | 0.74 |
| 45 | 2.8 | 0.36 | 0.76 |
| 56 | 2.3 | 0.40 | 0.76 |
| 67 | 3.1 | 0.36 | 0.73 |
| 79 | 2.2 | 0.36 | 0.78 |
| 90 | 2.4 | 0.49 | 0.74 |
| 102 | 2.7 | 0.95 | 0.48 |
| 113 | 2.3 | 0.80 | 0.76 |
Table 2.
Sediment Radionuclide Levels
| Average depth (cm) |
Sample interval (cm) |
40K (dpm/g) |
137Csa (dpm/g) |
226Raa (dpm/g) |
228Raa (dpm/g) |
228Tha (dpm/g) |
|---|---|---|---|---|---|---|
| 2.5 | 5 | 30.6 | 0.58 | 0.91 | 1.14 | 1.10 |
| 15 | 5 | 26.1 | 0.65 | 0.87 | 1.18 | 1.25 |
| 28 | 5 | 31.0 | 1.10 | 1.14 | 1.30 | 1.32 |
| 41 | 5 | 28.0 | 0.83 | 1.41 | 1.47 | 1.45 |
| 53 | 5 | 22.7 | 0.09 | 2.73 | 1.45 | 1.48 |
| 66 | 5 | 24.8 | LT | 3.32 | 1.41 | 1.48 |
| 79 | 5 | 25.8 | LT | 1.65 | 1.39 | 1.44 |
| 91 | 5 | 23.9 | LT | 1.33 | 1.18 | 1.29 |
| 104 | 5 | 31.1 | LT | 1.11 | 1.28 | 1.32 |
| 117 | 5 | 24.0 | LT | 1.12 | 1.29 | 1.35 |
Note: LT indicates below detection limit.
Normalized to 40K variation
Chemical contaminants are not uniformly distributed over the sediment profile. Concentrations of five metals were measured within ten intervals and are plotted in Fig. 2 and included in Table 3. There were significant increases above surface sediment levels in Cd, Cr, and Pb from 39 to 85 cm below the sediment-water interface. Within this interval, Cd increased 14-fold, Cr increased two- to threefold, and Pb increased threefold above surface sediment levels. The concentration of Cu and Zn increased slightly above surface sediment levels at depths of 35–65 cm. The concentration of Ni was below the quantitation limit of 85 mg/kg at every depth, while all other metals were significantly above the quantitation limit. The concentration of total petroleum hydrocarbons (Fig. 3 and Table 3) in the sediment varies from about 800 mg/kg in near surface sediments to levels as high as 4,200 mg/kg between the depths of 50 and 85 cm below the sediment-water interface.
Fig. 2.
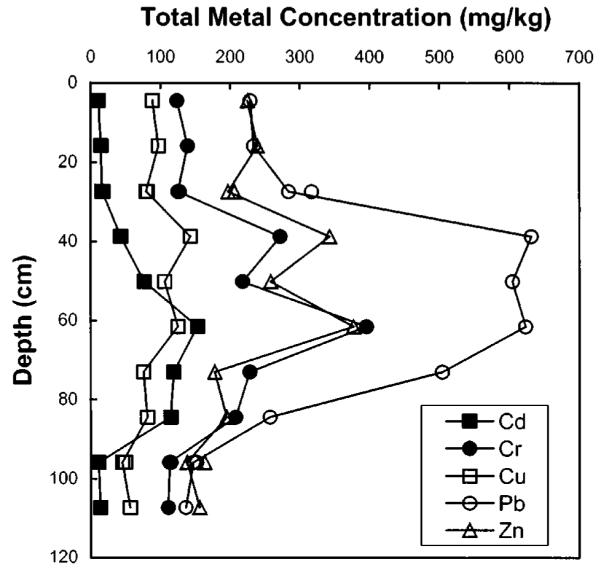
Depth profile of metal concentrations in Seaplane Lagoon sediment. Multiple points for each metal at 27 and 96 cm below sediment-water interface indicate duplicate measurements.
Table 3.
Sediment Metals and Total Petroleum Hydrocarbon Concentrations
| Average depth (cm) |
Sample interval (cm) |
Cd (mg/kg) |
Cr (mg/kg) |
Cu (mg/kg) |
Pb (mg/kg) |
Zn (mg/kg) |
Ni (mg/kg) |
Total petroleum hydrocarbons (mg/kg) |
|---|---|---|---|---|---|---|---|---|
| 4.5 | 9 | 10.9 | 124 | 89 | 230 | 230 | LT | 1,130 |
| 16 | 9 | 15.0 | 139 | 98 | 230 | 240 | LT | 830 |
| 27 | 9 | 16.2 | 125 | 80 | 280 | 197 | LT | 820 |
| 17.5 | 127 | 81 | 320 | 210 | LT | |||
| 39 | 9 | 43 | 270 | 143 | 630 | 340 | LT | 900 |
| 50 | 9 | 77 | 220 | 106 | 600 | 260 | LT | 2,800 |
| 62 | 9 | 153 | 400 | 125 | 620 | 380 | LT | 3,600 |
| 4,200 | ||||||||
| 73 | 9 | 119 | 230 | 76 | 500 | 178 | LT | 3,000 |
| 85 | 9 | 115 | 210 | 81 | 260 | 195 | LT | 2,000 |
| 96 | 9 | 11.3 | 113 | 45 | 147 | 138 | LT | 1,200 |
| 9.9 | 114 | 50 | 152 | 163 | LT | 1,300 | ||
| 107 | 9 | 13.6 | 111 | 56 | 136 | 156 | LT | 1,900 |
Note: LT indicates below detection limit.
Fig. 3.
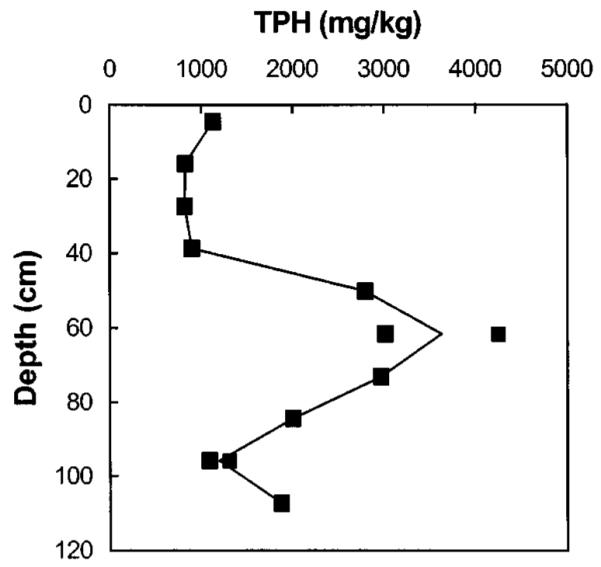
Depth profile of total petroleum hydrocarbons in Seaplane Lagoon sediment. Multiple points for TPH at 62 and 96 cm indicate duplicate measurements.
The activity profile of gamma-emitting radionuclides is shown in Fig. 4 and the data are presented in Table 2. The activities of 137Cs, 226Ra, 228Ra, and 228Th are normalized to the 40K variation using the following equation:
This normalization accounts for variations in radionuclide abundance associated with changes in clay content.
Fig. 4.
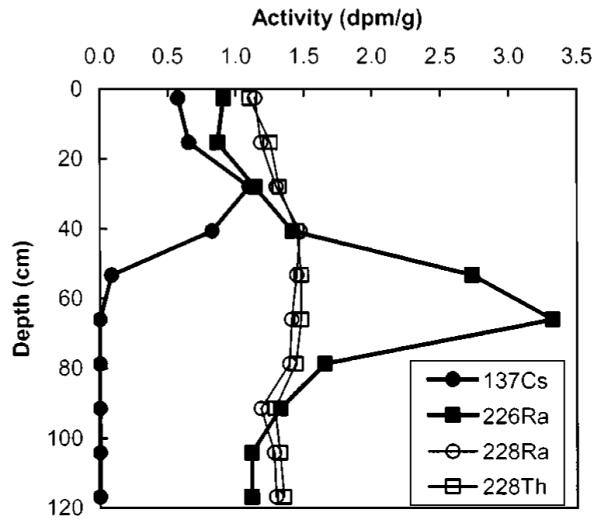
Depth profile of gamma-emitting radioisotopes in Seaplane Lagoon sediment. Measurements normalized to 40K variation.
137Cs is an anthropogenic radioactive isotope introduced into the global environment from fission reactions by atmospheric nuclear weapon testing. 137Cs has been deposited from the atmosphere into the sedimentary record since the inception of such activity in 1952 and fallout of 137Cs peaked in 1963. Since the position of the 137Cs maximum is at a sediment depth of 28±6 cm, this depth is a chronological marker for the year 1963 and suggests an average sedimentation rate of 0.8±0.2 cm/year from 1963 to 1997. The 6-cm uncertainty in the peak depth of 137Cs activity is attained from half the distance between sediment samples. The surface and near-surface 137Cs activities are comparable to activities measured elsewhere in the Bay (Fuller 1982; Fuller et al. 1999).
The radionuclides 226Ra and 210Pb are both constituents of the 238U decay series
The pronounced 226Ra maximum at 66 cm depth is anomalous compared to other San Francisco Bay sediment profiles (Fuller et al. 1999). Over the sediment depth intervals of 0–28 cm and 91–120 cm, the 226Ra activities are relatively constant and are similar to 226Ra activities found in other Bay sediments (Fuller et al. 1999). There are three possible reasons for enriched 226Ra within the core: (1) this sediment layer is mineralogically enriched in radium, (2) the sediment layer is mineralogically enriched in 238U, which then decays to 226Ra, or (3) there is an anthropogenic source of 226Ra.
The reason for 226Ra enrichment within the core is explained by examining other radionuclides over the sediment profile. If the sediment minerals are enriched in radium overall, the isotope 228Ra should also be enriched, but the 228Ra profile is uniform over the depth of the core. Thus, there is no enrichment in radium. The uniform composition of 228Ra and 228Th in the sediment also argues against an enriched U sediment source, since sediments enriched in U are often also enriched in Th because of geochemical similarities (Faure 1986). If U were the source for 226Ra, than these radioisotopes would be enriched in the sediment profile where 226Ra is elevated. Since neither a natural radium nor uranium source is indicated, the most likely source of the excess 226Ra in the Seaplane Lagoon sediment is anthropogenic. The historical record of 226Ra-based painting at this facility supports this analysis.
Sediment accumulation rates during the last 10–100 years are commonly determined by the 210Pb method. This method uses the natural deposition of 210Pb, but is complicated by multiple 210Pb sources in the sediment. In a closed system, all of the 210Pb results from the 238U decay series. In contrast, sediments accumulate 210Pb from atmospheric and water column sources as well as production within the sediment. The 210Pb produced within the sediment is called “supported” and the 210Pb from other sources is called unsupported or “excess.” The atmospheric source of 210Pb is from the decay of 222Rn and the water column contributes 210Pb from the decay of dissolved 226Ra. These additional 210Pb contributions to the sediments from the atmosphere and water column provide the excess 210Pb. Supported 210Pb is generally determined by measuring 226Ra activity in the core, assuming secular equilibrium, or by determining 210Pb activity at depth, where all excess 210Pb has decayed away. The excess activity of 210Pb is determined by subtracting the supported 210Pb from the total measured 210Pb. If the flux of atmospheric and water column 210Pb and the sedimentation rate are constant over time, a log-linear plot of excess 210Pb against depth in the sediment will yield a straight line as the excess 210Pb decays exponentially. The anthropogenic radium in the Seaplane Lagoon, a nonmineralogic contributor of 210Pb that presumably comes from World War II luminescent paint operations, obscures the excess 210Pb values by contributing 210Pb produced by the deposited paint. As a result, the atmospheric and water column excess 210Pb cannot be adequately distinguished from the 210Pb arising from the decay of anthropogenic 226Ra. Therefore, 210Pb is not useful in determining sediment accumulation rates at depth intervals containing anthropogenic 226Ra.
In light of these complications, supported 210Pb activities are estimated from the average of 226Ra in the upper 0–30 cm and bottom 90–120 cm sediment depths that are assumed not to contain significant anthropogenic 226Ra. This approach is justified by the close agreement of the 226Ra activity in these intervals, 1.7 ×10⁻² Bq/g(1.04 dpm/g), with 226Ra measured elsewhere in the bay. Excess 210Pb was then estimated by subtracting the average 226Ra from the measured 210Pb activities. Data are only available from three depth intervals in the sediment over depths from 0 to 30 cm below the surface as shown in Fig. 5. Excess 210Pb decays exponentially and was fitted to the simple sedimentation model
| (1) |
where 210Pbsurface=3.0×10⁻²±0.2×10⁻² Bq/g(1.8±0.1 dpm/g)=surface excess 210Pb; λ=decay rate constant for 210Pb (3.09 ×10⁻² year−1), z=depth; and s=sedimentation rate, determined to be 1.37±0.15 cm/year. This 210Pb-derived sedimentation rate is greater than the 137Cs-derived rate of 0.8±0.2 cm/year.
Fig. 5.
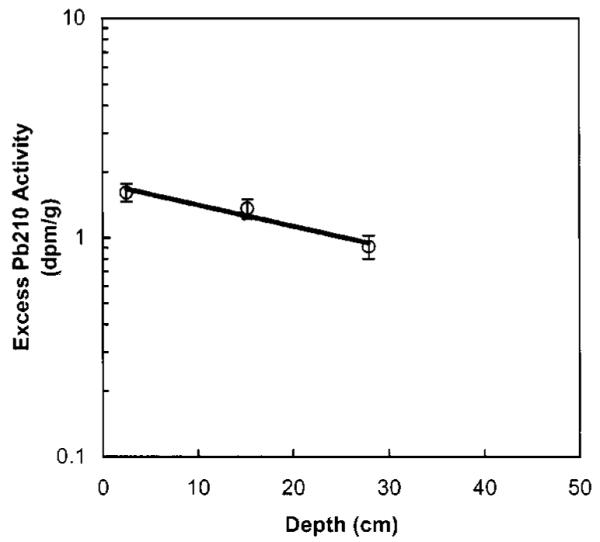
Excess 210Pb activity versus depth in Seaplane Lagoon sediment
One method for evaluating the quality of the 210Pb data is to compare the flux of excess 210Pb to the sediment surface with other studies in the region. The excess 210Pb flux is determined by multiplying the surface excess 210Pb by the sedimentation rate and the bulk density. At the Seaplane Lagoon the excess 210Pb flux is 160 Bq/m2/year (1.0 dpm/cm2/year). This flux is five times higher than the local atmospheric fallout of 33 Bq/m2/year (0.2 dpm/cm2/year) (Fuller and Hammond 1983). Sediment focusing is commonly observed in estuarine sediments (Ivanovich and Harmon 1992), and a sediment 210Pb flux 15 times the atmospheric flux has been measured in Richardson Bay, approximately 20 km from the Seaplane Lagoon (Fuller et al. 1999). Within the larger San Francisco Bay system, in situ decay of 238U in the water column enhanced by exchange between bay waters and Pacific Ocean waters and the erosion within the drainage basin of soils containing excess 210Pb have been used to explain the elevated 210Pb flux results (Fuller 1982; Fuller et al. 1999). The Seaplane Lagoon is too shallow for in situ decay of 238U in the water column to be the dominant source of the additional 210Pb component. Input of additional 210Pb in sediment from the wastewater and storm water outfalls is the most likely source of the nonatmospheric component. The calculated surface 210Pb activity for the core is significantly lower than the baywide annual average 210Pb activity in suspended sediment, 4.5 ×10⁻² Bq/g(2.7 dpm/g) (Fuller 1982), suggesting that wastewater and storm water outfalls may be the primary source of nonatmospheric excess 210Pb activity in lagoon sediments.
Two additional time markers can be used to determine sedimentation rates below sediment depths of 28 cm (1) The Seaplane Lagoon was dredged in 1935 into the Merritt Sand formation. In the sediment cores collected, the top of the Merritt Sand was located at approximately 90 cm depth, and (2) Significant radioactive fallout from atmospheric testing of nuclear weapons began in 1952, so the first appearance of 137Cs at 53 cm depth can be used as a chronological marker as well. Both of these time markers below 28 cm indicate a sedimentation rate of approximately 2.2 cm/year between depths of 90 and 28 cm below the sediment-water interface.
Discussion
The 210Pb and the 137Cs methods for measuring sedimentation rates had a discrepancy in the results, and some justification is required in selecting one result over the other. Differences using these two methods are often the result of either bioturbation of the sediment or loss of the core top during sampling. Bioturbation would mix the greater surface activity of excess 210Pb with deeper sediments containing less 210Pb. As a result of bioturbation the calculated sedimentation rate is an upper limit. However, the effect of bioturbation is expected to be minimal since the sedimentation rate is relatively high (Olsen et al. 1981) and the high contaminant concentrations and anoxic conditions may deter biological habitation. If the core top was lost, the 137Cs-determined sedimentation rate would be higher than actual but there would be no change in the 210Pb sedimentation rate. If the upper 19±8 cm of the sediment profile were lost during sampling, then equal sedimentation rates would result from the 210Pb and 137Cs methods. There is no physical evidence for sediment loss during sampling, and the 137Cs estimate is more reliable than the 210Pb estimate due to uncertainty caused by the presence of luminescent-based paints. Nonetheless, if the 210Pb sedimentation rate is used for the years since 1963, the contaminant reconstruction changes very little because most of the contaminants were deposited prior to 1963.
The time period of contaminant deposition can be approximated using a sedimentation rate of 0.8 cm/year from the surface of the sediment to 28 cm, and 2.2 cm/year between 28 and 90 cm depth. The Cd, Cr, and TPH deposited within the sedimentary interval of 39–85 cm correspond with the years 1958–1938, where the highest levels at a depth of 62 cm represent 1950. The Cu profile is relatively uniform down to a sediment depth of 85 cm (estimated as 1938) followed by a decline at deeper depths. The Pb signature is uniformly high at 600 mg/kg over the sample depths of 39–73 cm corresponding to 1958–1944. The Zn deposited within the sedimentary interval of 39–62 cm corresponds with the years 1958–1950.
The lower metal concentrations at sediment depths of 0–27 cm appear to reflect the diversion and treatment of industrial wastewater from the lagoon outfalls in about 1974. The anthropogenic 226Ra peak corresponds to about 1944±4, which is consistent with the greatest industrial activity occurring during and after World War II. To demonstrate the degree to which these multiple lines of evidence are consistent, the sedimentary time markers, diversion of industrial wastewater, and peak of 226Ra are all plotted versus depth in Fig. 6.
Fig. 6.
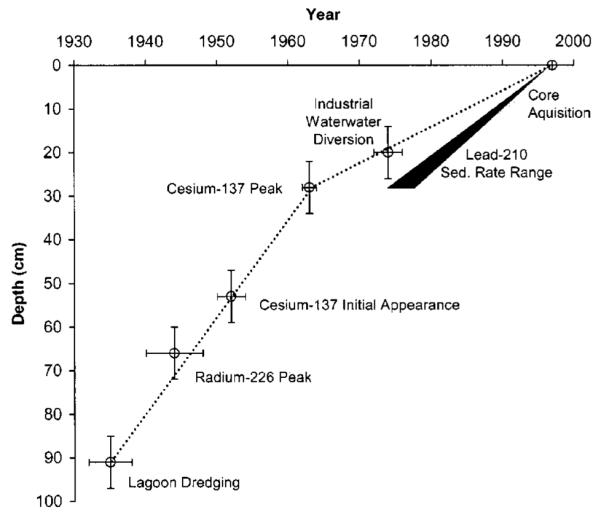
Sedimentary time markers in sediment from Seaplane Lagoon
Distinguishing the contribution of local sources of contamination from regional sources is often done by comparison with background locations. In some locations, such as the San Francisco Bay, sediment contamination is widespread and has fluctuated with altered industrial activities in the region. This precludes identification of a background level for comparison purposes. Therefore quantifying the contribution of site-specific sources is problematic.
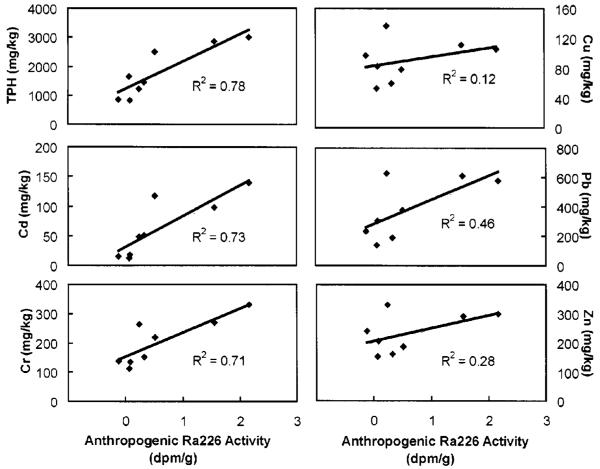
In the Seaplane Lagoon one of the wastewater effluents contained a tracer, 226Ra, which is most likely unique to Naval Air Station operations. The anthropogenic contribution of 226Ra as a function of depth in the sediments is determined by using the 228Ra activity at that depth and the natural activity ratio of 228Ra/226Ra to estimate natural 226Ra levels. Total 226Ra activity at a given depth minus the calculated natural 226Ra activity provides an estimate of the anthropogenic contribution. The uniformity of the 228Ra activity with depth and the reproducibility of the 226Ra/228Ra ratio at depths where anthropogenic 226Ra is not evident both support this approach. Correlation of a contaminant with anthropogenic 226Ra suggests that the contaminant and 226Ra had similar release histories. Fig. 7 tests the correlation of the metals and TPH concentrations with the anthropogenic 226Ra activity. Total petroleum hydrocarbon, Cd, and Cr concentrations correlated with anthropogenic 226Ra activity and are likely from the same wastewater source or reflect similar levels of industrial activity at the base. Anthropogenic 226Ra activity and Pb, Zn, and Cu concentrations are not correlated. Although Pb has a distinct peak in the sediment, the lack of correlation with anthropogenic 226Ra may result from a contaminant source difference such as atmospheric deposition before leaded fuels were phased out for U.S. automobiles or spillage of leaded fuels from refueling of aircraft. The Zn data fluctuate in concentration with depth, but do not have a single distinct peak that correlates with anthropogenic 226Ra. Finally, no correlation of anthropogenic 226Ra with Cu should be expected since the Cu concentrations are relatively constant over the depth interval 0–90 cm where significant variations in 226Ra were observed.
Fig. 7.
Correlation of calculated anthropogenic radium-226 activity with contaminants in Seaplane Lagoon sediment
The engineering profession needs adequate characterization of contaminated sediments prior to undertaking remedial activities. The sediment characterization methodology usually adopted by the maintenance dredging community is based on the collection of sediment cores and homogenizing them over intervals of meters since sediment removal operations will mix sediments over those depths. In contrast, the sediment chronologists are interested in the details of sediment accumulation and strive for sediment analysis over centimeter-depth intervals. Neither approach is practical for contaminated sediment sites that have spatial as well as depth variations. The use of 12-cm intervals in this study permitted determination of sediment accumulation rates and resolved contaminant releases over time intervals of decades. In addition, the ease of gamma counting minimizes sample handling and provides data on radionuclides for age dating, and in this case, identification of an anthropogenic source of 226Ra. This depth interval resolution was sufficient to assess the time periods when the majority of the contaminants were released into the marina. The approach could be easily extrapolated from a single location to a field site such as the whole marina without excessive analytical costs or modeling efforts.
Conclusion
The composition, quantity, and vertical distribution of contaminants were characterized for only one location in an estuarine marina. Multiple lines of evidence arrived at average sedimentation rates and determined that the greatest contaminant loading was during or soon after World War II. These contaminants have been buried and there is no evidence for their presence in near-surface sediment. This one location is not representative of the entire marina since substantial horizontal heterogeneity was evident from earlier sampling efforts. The 226Ra in the sediments is specific to discharges from the Naval Air Station and can provides a unique opportunity to delineate the horizontal heterogeneity in contaminant distribution for a site with multiple sources of contamination. The data suggests that 226Ra measurements could be used as a surrogate for levels of some other industrial wastewater contaminants with a similar release history. Given the ease of 226Ra analysis, much greater spatial and depth distributions could be determined if warranted. These data suggest that vertical resolution of sediment contamination is essential in understanding historical discharges and current exposures. There is always a trade-off in the value of additional information and the cost of data acquisition that must be addressed during each investigation. While this site has unique features, taking advantage of those features has been beneficial.
Acknowledgments
Site characterization was funded by the Naval Facilities Engineering Command, U.S. Navy, to the Berkeley Environmental Restoration Center (K. Udell, Principal Investigator) through Contract No. N62474-94-D-7430, Deliver Order No. 004. William Mabey was instrumental in the coordination of field activities. Continuing research is being funded by the National Institute of Environmental Health Sciences, Superfund Basic Research Program, P42 ES04705-15. These results do not reflect the view nor have the concurrence of the Western Division, Naval Engineering Command.
Notation
The following symbols are used in this paper:
- Anorm
normalized radionuclide activity
- A(z)
radionuclide activity at depth z
- A40K(avg)
average 40K activity
- A40K(z)
40K activity at depth z
- 210Pbexcess
excess 210Pb at depth z
- 210Pbsurface
excess 210Pb at sediment-water interface
- s
linear sedimentation rate (cm/year)
- z
depth (cm)
- λ
210Pb decay constant (year−1).
References
- Bandong BB, Volpe AM, Esser BK, Bianchini GM. Pre-concentration and measurement of low levels of gamma-ray emitting radioisotopes in coastal waters. Appl. Radiat. Isot. 2001;55(5):653–665. doi: 10.1016/s0969-8043(01)00081-1. [DOI] [PubMed] [Google Scholar]
- Benoit G, Hemond HF. Improved methods for the measurement of 210Po, 210Pb, and 226Ra. Limnol. Oceanogr. 1988;33(6):1618–1622. part 2. [Google Scholar]
- Bopp RF, Simpson HJ. Contaminated marine sediments—Assessment and remediation. National Academy Press; Washington, D.C.: 1989. Contamination of the Hudson River: The sediment record. [Google Scholar]
- Bruland KW, Bertine K, Koide M, Goldberg ED. History of metal pollution in southern California coastal zone. Environ. Sci. Technol. 1974;8:425–432. [Google Scholar]
- Edgington DN, Robbins JA. Record of lead deposition in Lake Michigan sediments since 1800. Environ. Sci. Technol. 1976;10:266–274. doi: 10.1021/es60114a007. [DOI] [PubMed] [Google Scholar]
- Environmental Protection Agency (EPA) Test methods for evaluating solid waste. Washington, D.C.: Rep. No. SW-846. 1996
- Faure G. Principles of isotope geology. 2nd Ed Wiley; New York: 1986. [Google Scholar]
- Fuller CC. PhD thesis. USC Sea Grant Institutional Program, Institute for Marine and Coastal Studies, Univ. of Southern California; Los Angeles: 1982. The use of Pb-210, Th-234 and Cs-137 as tracers of sedimentary processes in San Francisco Bay, California. [Google Scholar]
- Fuller C, Hammond DE. The fallout rate of Pb-210 on the western coast of the United States. Geophys. Res. Lett. 1983;10(12):1164–1167. [Google Scholar]
- Fuller CC, van Geen A, Baskaran M, Anima R. Sediment chronology in San Francisco Bay, California by Pb-210, Th-234, Cs-137, and Pu-239,240. Mar. Chem. 1999;64:7–27. [Google Scholar]
- Gerritse RG, Wallbrink PJ, Murray AS. Accumulation of phosphorous and heavy metals in the Swan-Canning estuary, Western Australia. Estuarine Coastal Shelf Sci. 1998;47:165–179. [Google Scholar]
- Goldberg ED, Griffin JJ, Hodge V, Koide M, Windom H. Pollution history of the Savannah River estuary. Environ. Sci. Technol. 1979;13:588–594. [Google Scholar]
- Hornberger MI, Luoma SN, van Geen A, Fuller C, Anima R. Historical trends of metals in the sediment of San Francisco Bay, California. Mar. Chem. 1999;64:39–55. [Google Scholar]
- Ivanovich M, Harmon RS, editors. Uranium-series disequilibrium: Applications to earth, marine, and environmental sciences. 2nd Ed Clarendon; Oxford, England: 1992. [Google Scholar]
- Koide M, Bruland KW, Goldberg ED. Th-228/Th-232 and Pb-210 geochronologies in marine and lake sediments. Geochim. Cosmochim. Acta. 1973;37:1171–1187. [Google Scholar]
- Krishnaswami S, Lal D, Martin JM, Meybeck M. Geochronology of lake sediments. Earth Planet. Sci. Lett. 1971;11:407–414. [Google Scholar]
- Krom MD, Berner RA. A rapid method for the determination of organic and carbonate carbon in geological samples. J. Sediment. Petrol. 1983;53:660–663. [Google Scholar]
- Krom MD, Kaufman A, Hornung H. Industrial mercury in combination with natural Pb210 as time-dependent tracers of sedimentation and mercury removal from Haifa Bay, Israel. Estuarine Coastal, Shelf Sci. 1994;38:625–642. [Google Scholar]
- Macdonald RW, Macdonald DM, Obrien MC, Gobeil C. Accumulation of heavy metals (Pb, Zn, Cu, Cd), carbon and nitrogen in sediments from Strait of Georgia, B.C., Cananda. Mar. Chem. 1991;34:109–135. [Google Scholar]
- National Research Council (NRC) National Academy Press; Washington, D.C.: Contaminated sediments in ports and waterways: Cleanup strategies and technologies. 1997
- Naval Energy and Environmental Support Activity (NEESA) Initial assessment study of Naval Air Station, Alameda, California. Port Hueneme; Calif.: Rep. No. NEESA-13-014. 1983
- O’Day PA, Carroll SA, Randall S, Martinelli RE, Anderson SL, Jelinski J, Knezovich JP. Metal speciation and bioavailability in contaminated estuary sediments, Alameda Naval Air Station, California. Environ. Sci. Technol. 2000;34:3665–3673. [Google Scholar]
- Olsen CR, Simpson HJ, Peng TH, Bopp RF, Trier RM. Sediment mixing and accumulation rate effects on radionuclide depth profiles in Hudson Estuary sediments. J. Geophys. Res., C: Oceans Atmos. 1981;86:1020–1028. [Google Scholar]
- Palanques A, SanchezCabeza JA, Masque P, Leon L. Historical record of heavy metals in a highly contaminated Mediterranean deposit: The Besos prodelta. Mar. Chem. 1998;61:209–217. [Google Scholar]
- PRC Environmental Management Inc. San Francisco: Ecological Assessment Draft Rep. (17 February) and Ecological Assessment Draft Report Amendment (1 July) 1994
- Ritson PI, Esser BK, Niemeyer S, Flegal AR. Lead isotopic determination of historical sources of lead to Lake Erie, North America. Geochim. Cosmochim. Acta. 1994;58(15):3927–3305. [Google Scholar]
- Robbins JA, Edgington DN. Determination of recent sedimentation rates in Lake Michigan using Pb-210 and Cs-137. Geochim. Cosmochim. Acta. 1975;39:285–304. [Google Scholar]
- Schubel JR, Hirschberg DJ. Pb210-determined sedimentation rate, and accumulation of metals in sediments at a station in Chesapeake Bay. Chesapeake Sci. 1977;18:379–382. [Google Scholar]
- Smith JN, Schafer CT. Sedimentation, bioturbation, and Hg uptake in the sediment of the estuary and Gulf of St. Lawrence. Limnol. Oceanogr. 1999;44:207–219. [Google Scholar]
- Valette-Silver NJ. The use of sediment cores to reconstruct historical trends in contaminated estuarine and coastal sediments. Estuaries. 1993;16(3B):577–588. [Google Scholar]
- van Geen A, Luoma SN. The impact of human activities on sediments of San Francisco Bay, California: An overview. Mar. Chem. 1999;64:1–6. [Google Scholar]
- Volpe AM, Bandong BB, Esser BK, Bianchini GM. Radiocesium in North San Francisco Bay and Baja California coastal surface waters. J. Environ. Radioact. 2002;60(3):365–380. doi: 10.1016/s0265-931x(01)00115-1. [DOI] [PubMed] [Google Scholar]
- Wong KM, Jokela TA, Eagle RJ, Brunk JL, Noshkin VE. Radionuclide concentrations, fluxes, and residence times at Santa Monica and San Pedro Basins. Prog. Oceanogr. 1992;20:353–391. [Google Scholar]
- Yunker MB, Macdonald RW, Goyette D, Paton DW, Fowler BR, Sullivan D, Boyd J. Natural and anthropogenic inputs of hydrocarbons to the Strait of Georgia. Sci. Total. Environ. 1999;225:181–209. doi: 10.1016/s0048-9697(98)00362-3. [DOI] [PubMed] [Google Scholar]


