

Abstract
Orosensory exposure to dietary fat elicits an early, transient spike (first phase; minutes 0–60) and augmented, more sustained postprandial (second phase; minutes 120–360) elevation of serum triacylglycerol (TAG) in humans. To assess the physiological significance of these effects, TAG concentrations were monitored following manipulation of the oral exposure pattern and accompanying lipid load. Fifteen healthy adults participated in a randomized, 6-arm, crossover design study. Conditions consisted of ingestion of 30-g loads of safflower oil, provided as capsules to bypass oral stimulation, followed by 15 min of oral stimulation (mastication and expectoration) with full-fat or nonfat cream cheese (conditions 1 and 2); the same oral load ingested intermittently with oral stimulation by both food forms (conditions 3 and 4); and 10-g lipid loads ingested with intermittent oral stimulation by both food forms (conditions 5 and 6). Blood was collected via an indwelling catheter and TAG was measured at minutes −15, 0, 10, 20, 30, 40, 50, 60, 120, 240, and 360 relative to the onset of sensory stimulation. Testing was conducted weekly. Sequential (lipid loading followed by oral stimulation) and intermittent (intermixed lipid loading and oral stimulation) conditions led to comparable TAG responses. Significant first- and second-phase TAG concentration increases were observed with the 30-g loads, but not the 10-g loads. TAG responses to the full-fat and nonfat stimuli were similar. These data support the veracity of the earlier literature based on sequential oral exposure regimens and indicate that TAG responses reflect an interaction between oral fat signaling and gut lipid content. The augmentation of TAG associated specifically with dietary fat exposure, as compared to a nonfat food matched on other sensory properties, may only occur with higher fat loads.
Keywords: Fat Taste, Fat Exposure, Cephalic Phase Fat Response, Serum Triacylglycerol, First-Phase Fat Response, Postprandial Lipemia
Introduction
Orosensory stimulation with dietary fat influences lipid metabolism (Mattes 2009b). Aside from a contribution to the sensory properties of foods that may modify food choice and the quality and quantity of fat consumed, multiple metabolic effects have been documented. Oral fat exposure modulates gastric emptying (Kaplan et al. 1997; Cecil et al. 1999) and elicits a robust pancreatic exocrine response in rats (Hiraoka et al. 2003; Laugerette et al. 2005) that has not yet been explored in other species. In the human gastrointestinal tract, it alters hormone secretion (Wisen et al. 1992; Heath et al. 2004) and rapidly promotes the mobilization of stored triacylglycerol (TAG) into the circulation contributing to a first-phase (0–60 min poststimulation) TAG peak (Mattes 2002). It also stimulates pancreatic polypeptide secretion (Heath et al. 2004; Crystal and Teff 2006), and either directly or through the pancreatic endocrine response, it stimulates hepatic very low density lipoprotein (VLDL) secretion (Robertson et al. 2002). The latter effects probably contribute to an augmented second-phase (120–360+ h poststimulation) serum TAG concentration.
The magnitudes of the TAG responses are sensitive to properties of the oral stimulus and exposure conditions. Although the evidence is preliminary, several salient stimulus properties have been identified. First, while there is a nonspecific element of oral stimulation that can raise the first- and second-phase TAG concentration, the presence of dietary fat augments the response (Mattes 1996, 2001a; Parks 2008). Fat replacers of various macronutrient bases are not as effective as a bioaccessible fat (Mattes 2001a). Second, humans can detect and scale the intensity of fats varying in chain length (Mattes 2009c, d) and saturation (Chale-Rush et al. 2007), but unsaturated fats appear to elicit more robust TAG responses (Tittelbach and Mattes 2001). Third, recent data suggest that there is an inverse association between self-reported stimulus palatability and the second-phase TAG rise (Mattes 2009a). Fourth, adding sweetness to a high-fat stimulus, independent of palatability, does not alter the response (Mattes 2009a; Singleton et al. 1999), although co-ingestion of a nutritive sweetener raises the second-phase response (Singleton et al. 1999), probably by independently serving as substrate for hepatic TAG synthesis. Finally, taste, as compared to olfactory and somatosensory cues, is reportedly the most salient sensory attribute for eliciting a rise of serum TAG (Mattes 2001b).
These properties help to characterize the TAG response and provide mechanistic insights, but the physiological relevance of the phenomenon is also a function of exposure dynamics. Early work was modeled on observations with rats (Ramirez et al. 1985) and entailed prolonged sensory exposure times. However, recent evidence indicates that exposures of 20 min, simulating a meal (Mattes 2009e), 3–5 min, simulating a snack (Crystal and Teff 2006; Mattes 2009e), or even a single 10-s exposure (Mattes 2009e) may be sufficient. Thus, realistic exposure times are effective. More questions remain regarding the exposure pattern. Under customary eating conditions, oral exposure would be coincident with gastric filling. Limited evidence indicates that gastric loading is a required component of the response (Mattes 2001b), but the level required has not been assessed. Examination of this was one aim of the present project. In addition, during eating, exposure and gastric delivery of lipid is concurrent (i.e., oral exposure is accompanied by swallowing). In prior work, lipid loading preceded sensory exposure (i.e., it was sequential). A second aim of this study was to contrast TAG responses to conditions that provided the lipid load before sensory stimulation with the more ecological condition of interspersing stimulation with ingestion. The overall goal of this project was to expand understanding of the TAG response to oral stimulation under more naturalistic conditions to better assess its health implications.
Methods
Participants
Eligibility was based on self-reported good health, body mass index (BMI) between 18 and 30 kg/m2, not initiating or terminating the use of medications reported to affect appetite or body weight during the proposed study period, stable activity level (no change more than one time per week of 30 min per session), resting serum TAG below 250 mg/dl, no allergies to test foods, and agreement to abstain from alcohol consumption and vigorous physical activity for 48 h prior to study days. The final sample included seven males and eight females with a mean age of 23.1±0.8 years and mean BMI of 25.4±0.8 kg/m2. Their resting serum TAG concentration was 113.4±10.3 mg/dl.
General Protocol
The trial was a 6-arm randomized crossover design with conditions administered at approximately weekly intervals. Participants meeting eligibility criteria based on responses to a screening demographic, diet and health questionnaire, and resting serum TAG concentration provided written informed consent. Resting serum TAG was assessed in the morning of a session held at least a week prior to testing sessions. At 2000 hours, the night before each test session, participants ingested 56 g of Reese's Pieces (Hershey Co., Hershey, PA, USA) as the last eating event of the day. These high-fat confections (i.e., approximately 43%, 51%, and 10% of energy from fat, carbohydrate, and protein, respectively) were consumed to increase the probability of lipid stores in enterocytes, the presumed source of TAG appearing in the blood following oral stimulation (Robertson et al. 2003), on the test day. They then reported to the laboratory the next morning in a fasted state, and a catheter was placed in an antecubital vein. Participants were started at the same time for each of their six trials, almost always at 0700 hours. They remained in the laboratory for the duration of the trial and were not exposed to verbal references to foods or eating or any form of sensory exposure to foods (e.g., sight, odor, etc.). Baseline blood draws were followed by one of six exposures per loading regimen. Blood samples were collected 0, 10, 20, 30, 40, 50, 60, 120, 240, and 360 min after the onset of sensory stimulation. All samplings were conducted under the supervision of a researcher. The protocol was approved by the University Institutional Review Board.
Conditions
Six conditions were contrasted. All participants completed all conditions, and the order was randomized. One entailed 15-s oral exposure to a 5.2-g full-fat cream cheese sample (Philadelphia, Brand, Kraft Foods Inc., Northfield, IL, USA) that was then expectorated, followed by a water rinse and ingestion of six 1-g capsules of safflower oil (Nature's Plus, Neville, NY, USA) with 100 ml of water in 120 s. This was repeated five times so the total lipid and water loads were 30 g and 500 ml, respectively, and oral exposure and lipid loading were intermittent as would be the case with customary ingestion. This is referred to as the full-fat, intermittent, 30-g (FFI30) trial. A second trial was the same except that the oral stimulus was nonfat cream cheese, designated as nonfat, intermittent, 30-g (NFI30) trial. A third and fourth trial required participants to ingest 30 g of the safflower oil capsules with 500 ml of water as a preload in 15 min followed by oral exposure to either full-fat or nonfat cream cheese for 15-s intervals each followed by a water rinse during the 45-s interstimulus pause. Thus, these two trials were matched to the above-noted trials for total oil and water intake, but varied in oral stimulation pattern. They are referred to as the full-fat preload, 30-g (FFP30) and nonfat, preload, 30-g (NFP30) trials. The remaining trials were matched to the FFI30 and NFI30 with respect to oral exposure, except that only 2 g of safflower oil capsules were ingested intermittently between oral exposures to the two types of cream cheese. Thus, in these two trials, the total lipid load was only 10 g. These trials are designated as full-fat, intermittent, 10 g (FFI10) and nonfat, intermittent, 10 g (NFI10), respectively. A no-oral stimulation condition could not be included because of limitations on the amount of blood that could ethically be drawn from participants, but prior studies (e.g., Mattes 1996, 2001a) document the requirement for oral exposure to elicit a postprandial TAG rise under conditions comparable to those used here.
Hematology
Four milliliters of blood were collected into a red top vacutainer at each sampling time. Samples were centrifuged and the serum aliquoted and frozen at −80°C for later analysis. TAG concentrations were determined by an enzymatic procedure using a Cobas Integra 400 Analyzer (Roache Diagnostics, Summerville, NJ, USA). The precision of the assay was 2%.
Statistical Analysis
To aid comparisons with previously published data, the time 0 TAG concentration was subtracted from each subsequent sample to compute a change from baseline value. Area under the curve (AUC) values were computed on these data by the trapezoidal method for the first-phase (minutes 0–60) and second-phase (minutes 120–360) TAG concentrations. These values were assessed by repeated measures analysis of variance. Associations between the first and second-phase TAG responses were explored by Pearson correlation coefficients. The criterion for statistical significance was p<0.05 (two-tailed).
Results
Analyses of the serum TAG change values over each 6-h trial revealed significant main effects of treatment (F(2, 28)=6.59, p=0.005), time (F(8, 112)=3.89, p<0.001) and a treatment × time interaction (F(16, 224)=3.96, p<0.001). There was no significant overall difference in responses to the full-fat and nonfat samples, but to facilitate inspection of the data, values following oral exposure to the two types of stimuli are presented separately in Fig. 1. Analyses of these two data sets indicated only a main effect of time for the FFI30, FFP30, and FFI10 trials. In contrast, there were main effects of treatment (F(2, 28)=5.30, p=0.011) and time (F(8, 112)=2.22, p=0.031) as well as a treatment × time interaction (F(16, 224)=3.27, p<0.001) for the NFI30, NFP30, and NFI10 trials. This was attributable to a greater TAG response to the NFP30 treatment compared to the NFI10 treatment (p=0.004). There were significant differences at minutes 50 (p=0.017), 120 (p=0.005), 240 (p= 0.003), and 360 (p=0.002).
Fig. 1.
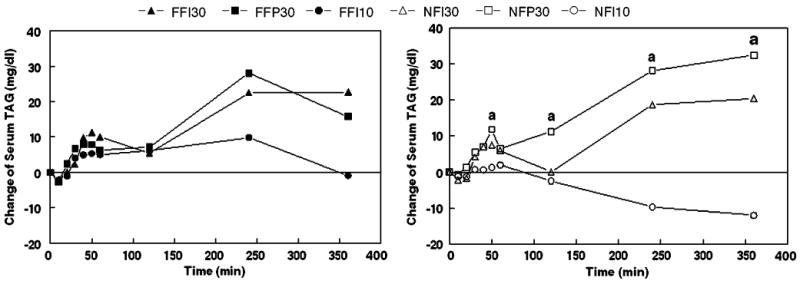
Mean change of serum triacylglycerol after oral exposures to full-fat cream cheese (left) and nonfat cream cheese (right). FFI30 full-fat cream cheese oral stimulus, intermittent exposures and rinses with 30-g lipid load; FFP30 full-fat cream cheese oral stimulus, single preload with 30-g lipid load before oral stimulation; FFI10 full-fat cream cheese oral stimulus, intermittent exposures and rinses with 10-g lipid load; NFI30, NFP30, and NFI10 are the same respective treatments but the oral stimulus was nonfat cream cheese (N=15). a indicates time points where comparisons between NFP30 and NFI10 were statistically significant
The discrepancy in treatment effects for the full-fat and nonfat stimuli was due primarily to the 10-g load trials. There was a trend for trial FFI10 to lead to a greater TAG response compared to NFI10 (F(1, 14)=3.18, p<0.1) and a significant treatment × time interaction between these trials (F(8, 112)=2.20, p=0.032). The latter was due to a greater TAG rise at 120 min (p=0.039) and a trend for a great rise at 240 min (p=0.085) with the full-fat sample.
Relative to baseline, significant TAG rises were noted during the first-phase periods for trials involving 30-g lipid loads, but not 10-g loads. Similarly, significant rises were observed during the second phase for all 30-g load trials except NFPI30, but none were significant with the 10-g trials. Analyses of the AUC values during these two periods revealed no significant differences during phase 1, but significant differences between NFI10 and FFI30 (p=0.047), FFP30 (p=0.004), and NFP30 (p=0.009) during phase 2.
For the trials providing intermittent oral stimulation and loading, there was a significant correlation between the first- and second-phase responses, quantified by AUC when 30-g loads were ingested with full fat (r=0.65, p=0.008) or nonfat (r=0.62, p=0.014) stimulation. They were also correlated with a 10-g load, but only with full-fat oral stimulation (r=0.66, p=0.008).
The mean percent recoveries of the cream cheese samples after mastication, expectoration, and drying were FFI30=99.2±2.2%, NFI30=101.8±2.8%, FFP30=97.7± 2.0%, NFP30 = 95.4±1.1%, FFI10 = 98.4±2.1%, and NFI10=99.6±2.4%. There was no significant difference across conditions.
Discussion
The consumption of meals regularly varying in composition is metabolically challenging (Woods 1991). To ensure that needed nutrients are efficiently absorbed and toxins are not requires coordination of the rate of passage of ingested food with digestive processes and nutrient uptake (Woods 2005, 2009). This is facilitated by sensory signaling that anticipates the arrival of food in the gastrointestinal tract and initiates responses at each of these levels (Kaplan et al. 1997; Zafra et al. 2006; Mattes 1997; Power and Schulkin 2008; Mace et al. 2007). These early sensory signals also alter the appearance (Robertson et al. 2003; Parks 2008) and clearance (Picard et al. 1999) of nutrients into and from the circulation, respectively. The timing of each element is critical to its function. For example, delaying insulin secretion for as little as 15 min after glucose delivery, which may occur in the absence of sensory stimulation with eating (e.g., tube feeding), markedly increases the blood glucose concentration for the subsequent 3 h compared to when insulin is secreted coincident with the load (Kraegen et al. 1981). Prior work has demonstrated that oral fat exposure augments postprandial (after a meal) lipemia (blood lipid concentration) (Mattes 1996, 2001a; Parks 2008), but the protocol has generally entailed 15 min of lipid loading followed by the onset of sensory stimulation. Thus, based on the evidence on glycemia (blood glucose concentration), this nonphysiological pattern of stimulation could yield unrepresentative effects on lipemia. One aim of this work was to explore the effects of a more ecologically relevant stimulation/ingestion pattern on postprandial lipemia. Our findings reveal sequential and intermittent stimulation conditions result in comparable first- as well as second-phase TAG concentrations. This supports the relevance of the earlier trials despite their preloading experimental approach. This lesser sensitivity to timing effects for fat, compared to carbohydrate, may reflect its slower inherent gastric emptying and less precise regulation in the circulation.
The importance of lipid loading for the TAG response to oral stimulation has received limited attention. With 50-g lipid loads, oral fat exposure leads to an earlier and more consistent first-phase response (Mattes 2009e) and greater second-phase TAG concentrations (Mattes 1996, 2001a; Parks 2008) than when loading is accompanied by exposure to nonfat stimuli or no oral stimulation. In contrast, oral stimulation without lipid loading fails to prompt a TAG response (Mattes 2001b). Testing with a 30-g load leads to a TAG rise, but the magnitude of the first-phase response is lower than with 50-g loads and the differential second-phase response to full-fat and nonfat stimulation is less robust (Parks 2008). The present study extended the exploration of loading effects by comparing TAG responses to the same oral stimulation regimen in individuals receiving either 30- or 10-g loads. The absence of significant TAG rises during either the first- or second-phase periods with the 10-g loads and significant increases with the 30-g loads confirms the needs for some minimal load to observe an oral exposure effect. This is notable given recent evidence that much of the lipid in the first phase is derived from lipid stores from previously eaten meals (Parks 2008). Thus, it appears that postprandial lipemia is a function of the interaction of sensory and nutritive (i.e., lipid load) input and that there is a dose–response relationship with respect to both the level of sensory stimulation (Mattes 2009e) and lipid load in the gut. A single 10-s oral exposure may be sufficient whereas the minimal effective lipid load appears to be between 10 and 30 g.
The present study did not reveal a generally greater TAG response to the full-fat oral stimulus compared to the nonfat version of the same food. However, the NFI10 treatment did lead to a TAG response that was significantly lower than responses to the FFI30 and FFP30 conditions as well as the NFP30 treatment. This was not the case for the FFI10 treatment suggesting some increment attributable to the full-fat exposure. This weak differential response may be attributable to the lower lipid loads used in this trial compared to most prior studies (e.g., Mattes 1996, 2001a, 2002). However, other possibilities exist. First, to our knowledge, this was the first study where an oral rinse followed each oral exposure. This would likely have reduced stimulation duration by more completely removing residual lipid from the oral cavity. Differentiation between the nonspecific effects of oral stimulation and those that are fat-related may require a longer stimulation period (Mattes 2009e). Recent studies (Mattes 2009f) also suggest that stimulus palatability is inversely related to the magnitude of the TAG response. Prior trials (Mattes 1996) with the same stimuli revealed participants could not differentiate between the two cream cheese forms, but a lower rating for the full-fat version in this study could also have blunted its effect. Unfortunately, palatability ratings were not obtained to test this possibility.
It should be noted that one study reported a significant TAG rise following modified sham feeding of a meal high in linoleic acid (∼85% of energy) versus water exposure 5 h after consumption of a meal providing 59.4 g of fat (Smeets and Westerterp-Plantenga 2006). No significant rise was observed when the high linoleic meal was actually ingested or when oral stimulation was comprised of meals rich in olive oil or oleic acid. The authors posited a fatty acid-specific effect, but the preponderance of the evidence for an oral exposure effect of fat stems from studies using cream cheese as a stimulus and it contains <3% of energy as linoleic acid and about 24% as monounsaturated fat. We propose two explanations for the discrepant responses to the oral stimulation alone and actual ingestion of the linoleic-rich meal. First, insulin levels were higher when the meal was consumed, and this could stimulate lipoprotein lipase (LPL) activity and TAG clearance (Picard et al. 1999). Additionally, plasma nonesterified fatty acids were higher with modified sham feeding, and this may have stimulated intestinal and hepatic lipoprotein production (Duez et al. 2008). The absence of effects with the other fats is presently more problematic, but this study raises the important question of how other food components may modify the TAG response to oral fat exposure.
The present study confirms accumulating evidence (Mattes 2009e, 2002; Parks 2008) for a biphasic TAG response to conditions mimicking ingestion of a fat-containing food/meal. Given that this trial and others (Mattes 2009a, 2002) indicate that the first- and second-phase responses are correlated and the latter one is an independent predictor of cardiovascular disease (CVD) risk (Mora et al. 2008; Nordestgaard et al. 2007; Bansal et al. 2007), the role of the first-phase response requires further study. It could be an added source of TAG that raises the blood concentration. Drawn from lipid droplets in enterocytes remaining from previous eating occasions, this lipid would compete for access to LPL with TAG entering the circulation from a current load as chylomicrons as well as VLDL from the liver. However, its contribution is limited. In the present study, it accounted for about 20% of the AUC which did not capture the full response, so would overestimate the first-phase influence, especially after higher fat meals. Second, it may be a signal that activates processes required for the peripheral disposition of the anticipated influx of lipid postprandially. Modified sham feeding activates LPL in myocytes and inhibits it in adipocytes (Picard et al. 1999). This may be mediated by insulin, but a rise of circulating TAG cannot presently be excluded as a regulatory signal. Third, it is possible that the first-phase TAG rise merely reflects activation of enterocyte lipid trafficking pathways that clear residual lipid from the cells to optimize absorption and processing of lipid from the current meal. In this latter case, the association between the first and second phases would be only correlational rather than causal.
Conclusion
This study further documents and characterizes an interaction between the orosensory stimulation that accompanies dietary fat ingestion and the amount of fat consumed on the lipemic response that eating event produces. It confirms the relevance and veracity of prior work that used an oral exposure and loading paradigm that did not mimic normal eating by showing comparable results with one that does. Further, the data indicate that oral stimulation fails to elicit notable first- or second-phase responses when associated with small loads (e.g., ≤10 g of fat). This suggests that such limited exposures may not be problematic with respect to effects on postprandial TAG concentrations. However, the required conditions for oral augmentation of blood TAG concentrations remain in the realm of daily experience. Finally, evidence that the first-phase response is correlated with the second and the latter is a significant predictor of CVD risk calls for further study of the former.
Acknowledgments
The author would like to thank Robin Rhine, Judy George, and Christen Woods for their technical assistance in the conduct of this study. This study was supported by grant R01 DK45294 awarded by the National Institute of Diabetes and Digestive and Kidney Diseases.
References
- Bansal S, Buring JE, Rifai N, Mora S, Sacks FM, Ridker PM. Fasting compared with nonfasting triglycerides and risk of cardiovascular events in women. JAMA. 2007;298:309–316. doi: 10.1001/jama.298.3.309. [DOI] [PubMed] [Google Scholar]
- Cecil JE, Francis J, Read NW. Comparison of the effects of a high-fat and high-carbohydrate soup delivered orally and intragastrically on gastric emptying, appetite, and eating behavior. Physiol Behav. 1999;67:299–306. doi: 10.1016/s0031-9384(99)00069-4. [DOI] [PubMed] [Google Scholar]
- Chale-Rush A, Burgess JR, Mattes RD. Evidence for human orosensory (taste?) sensitivity to free fatty acids. Chem Senses. 2007;32:423–431. doi: 10.1093/chemse/bjm007. [DOI] [PubMed] [Google Scholar]
- Crystal SR, Teff KL. Tasting fat: cephalic phase hormonal responses and food intake in restrained and unrestrained eaters. Physiolo Behav. 2006;89:213–220. doi: 10.1016/j.physbeh.2006.06.013. [DOI] [PubMed] [Google Scholar]
- Duez H, Lamarche B, Valero R, Pavlic M, Proctor S, Xiao C, Szeto L, Patterson BW, Lewis GF. Both intestinal and hepatic lipoprotein production are stimulated by an acute elevation of plasma free fatty acids in humans. Circulation. 2008;117:2369–2376. doi: 10.1161/CIRCULATIONAHA.107.739888. [DOI] [PMC free article] [PubMed] [Google Scholar]
- Heath RB, Jones R, Frayn KN, Robertson MD. Vagal stimulation exaggerates the inhibitory ghrelin response to oral fat in humans. J Endocrinol. 2004;180:273–281. doi: 10.1677/joe.0.1800273. [DOI] [PubMed] [Google Scholar]
- Hiraoka T, Fukuwatari T, Imaizum M, Fushiki T. Effects of oral stimulation with fats on the cephalic phase of pancreatic enzyme secretion in esophagostomized rats. Physiol Behav. 2003;79:713–717. doi: 10.1016/s0031-9384(03)00201-4. [DOI] [PubMed] [Google Scholar]
- Kaplan JM, Siemers W, Grill HJ. Effect of oral versus gastric delivery on gastric emptying of corn oil emulsions. Am J Physiol. 1997;273:R1263–R1270. doi: 10.1152/ajpregu.1997.273.4.R1263. [DOI] [PubMed] [Google Scholar]
- Kraegen EW, Chisholm DJ, McNamara ME. Timing of insulin delivery with meals. Horm Metab Res. 1981;13:365–367. doi: 10.1055/s-2007-1019271. [DOI] [PubMed] [Google Scholar]
- Laugerette F, Passilly-Degrace P, Patris B, Niot I, Febbraio M, Montmayeur JP, Besnard P. CD36 involvement in orosensory detection of dietary lipids, spontaneous fat preference, and digestive secretions. J Clin Invest. 2005;115:3177–3184. doi: 10.1172/JCI25299. [DOI] [PMC free article] [PubMed] [Google Scholar]
- Mace OJ, Affleck J, Patel N, Kellett GL. Sweet taste receptors in rat small intestine stimulate glucose absorption through apical GLUT2. J Physiol. 2007;582:379–392. doi: 10.1113/jphysiol.2007.130906. [DOI] [PMC free article] [PubMed] [Google Scholar]
- Mattes RD. Oral fat exposure alters postprandial lipid metabolism in humans. Am J Clin Nutr. 1996;63:911–917. doi: 10.1093/ajcn/63.6.911. [DOI] [PubMed] [Google Scholar]
- Mattes RD. Physiologic responses to sensory stimulation by food: nutritional implications. J Am Diet Assoc. 1997;97:406–413. doi: 10.1016/S0002-8223(97)00101-6. [DOI] [PubMed] [Google Scholar]
- Mattes RD. Oral exposure to butter, but not fat replacers elevates postprandial triacylglycerol concentration in humans. J Nutr. 2001a;131:1491–1496. doi: 10.1093/jn/131.5.1491. [DOI] [PubMed] [Google Scholar]
- Mattes RD. The taste of fat elevates postprandial triacylglycerol. Physiol Behav. 2001b;74:343–348. doi: 10.1016/s0031-9384(01)00578-9. [DOI] [PubMed] [Google Scholar]
- Mattes RD. Oral fat exposure increases the first phase triacylglycerol concentration due to release of stored lipid in humans. J Nutr. 2002;132:3656–3662. doi: 10.1093/jn/132.12.3656. [DOI] [PubMed] [Google Scholar]
- Mattes RD. Experimental Biology 2009. New Orleans, LA: 2009a. Apr 18-22, Hedonics and the cephalic phase fat response in humans. Abstr. [Google Scholar]
- Mattes RD. Is there a fatty acid taste? Annu Rev Nutr. 2009b;29:7.1–7.23. doi: 10.1146/annurev-nutr-080508-141108. [DOI] [PMC free article] [PubMed] [Google Scholar]
- Mattes RD. Oral detection of short-, medium-, and long-chain free fatty acids in humans. Chem Senses. 2009c;34:145–150. doi: 10.1093/chemse/bjn072. [DOI] [PMC free article] [PubMed] [Google Scholar]
- Mattes RD. Oral thresholds and suprathreshold intensity ratings for free fatty acids on 3 tongue sites in humans: implications for transduction mechanisms. Chem Senses. 2009d;34:415–423. doi: 10.1093/chemse/bjp015. [DOI] [PMC free article] [PubMed] [Google Scholar]
- Mattes RD. Brief oral stimulation, but especially oral fat exposure, elevates serum triglycerides in humans. Am J Physiol Gastrointest Liver Physiol. 2009e;296:G365–G371. doi: 10.1152/ajpgi.90591.2008. [DOI] [PMC free article] [PubMed] [Google Scholar]
- Mattes RD. Experimental Biology 2009. New Orleans, LA: 2009f. Apr 18-22, Hedonics and the cephalic phase fat response in humans. Abstr 350.5. [Google Scholar]
- Mora S, Rifai N, Buring JE, Ridker PM. Fasting compared with nonfasting lipids and apolipoproteins for predicting incident cardiovascular events. Circulation. 2008;118:993–1001. doi: 10.1161/CIRCULATIONAHA.108.777334. [DOI] [PMC free article] [PubMed] [Google Scholar]
- Nordestgaard BG, Benn M, Schnohr P, Tybjaerg-Hansen A. Nonfasting triglycerides and risk of myocardial infarction, ischemic heart disease, and death in men and women. JAMA. 2007;298:299–308. doi: 10.1001/jama.298.3.299. [DOI] [PubMed] [Google Scholar]
- Parks EJ. Oral fat sensory exposure elevates chylomicron-TG and delays subsequent glucose metabolism. Am Diabetes Assoc 68th Annual Mtg; San Francisco, CA. June.2008. Abstr. [Google Scholar]
- Picard F, Naimi N, Richard D, Deshaies Y. Response of adipose tissue lipoprotein lipase to the cephalic phase of insulin secretion. Diabetes. 1999;48:452–459. doi: 10.2337/diabetes.48.3.452. [DOI] [PubMed] [Google Scholar]
- Power ML, Schulkin J. Anticipatory physiological regulation in feeding biology: cephalic phase responses. Appetite. 2008;50:194–206. doi: 10.1016/j.appet.2007.10.006. [DOI] [PMC free article] [PubMed] [Google Scholar]
- Ramirez I, Kryski AJ, Ben-Zeev O, Schotz MC, Severson DL. Characterization of triacylglycerol hydrolase activities in isolated myocardial cells from rat heart. Biochem J. 1985;232:229–236. doi: 10.1042/bj2320229. [DOI] [PMC free article] [PubMed] [Google Scholar]
- Robertson MD, Mason AO, Frayn KN. Timing of vagal stimulation affects postprandial lipid metabolism in humans. Am J Clin Nutri. 2002;76:71–77. doi: 10.1093/ajcn/76.1.71. [DOI] [PubMed] [Google Scholar]
- Robertson MD, Parkes M, Warren BF, Ferguson DJ, Jackson KG, Jewell DP, Frayn KN. Mobilisation of enterocyte fat stores by oral glucose in humans. Gut. 2003;52:834–839. doi: 10.1136/gut.52.6.834. [DOI] [PMC free article] [PubMed] [Google Scholar]
- Singleton MJ, Heiser C, Jamesen K, Mattes RD. Sweetener augmentation of serum triacylglycerol during a fat challenge test in humans. J Am Coll Nutr. 1999;18:179–185. doi: 10.1080/07315724.1999.10718847. [DOI] [PubMed] [Google Scholar]
- Smeets AJ, Westerterp-Plantenga MS. Satiety and substrate mobilization after oral fat stimulation. Br J Nutr. 2006;95:795–801. doi: 10.1079/bjn20051725. [DOI] [PubMed] [Google Scholar]
- Tittelbach TJ, Mattes RD. Oral stimulation influences postprandial triacylglycerol concentrations in humans: nutrient specificity. J Am Coll Nutr. 2001;20:485–493. doi: 10.1080/07315724.2001.10719057. [DOI] [PubMed] [Google Scholar]
- Wisen O, Bjorvell H, Cantor P, Johansson C, Theodorsson E. Plasma concentrations of regulatory peptides in obesity following modified sham feeding (MSF) and a liquid test meal. Regul Pept. 1992;39:43–54. doi: 10.1016/0167-0115(92)90007-h. [DOI] [PubMed] [Google Scholar]
- Woods SC. The eating paradox: how we tolerate food. Psychol Rev. 1991;98:488–505. doi: 10.1037/0033-295x.98.4.488. [DOI] [PubMed] [Google Scholar]
- Woods SC. Signals that influence food intake and body weight. Physiol Behav. 2005;86:709–716. doi: 10.1016/j.physbeh.2005.08.060. [DOI] [PubMed] [Google Scholar]
- Woods SC. The control of food intake: behavioral versus molecular perspectives. Cell Metabol. 2009;9:489–498. doi: 10.1016/j.cmet.2009.04.007. [DOI] [PMC free article] [PubMed] [Google Scholar]
- Zafra MA, Molina F, Puerto A. The neural/cephalic phase reflexes in the physiology of nutrition. Neurosci Biobehav Rev. 2006;30:1032–1044. doi: 10.1016/j.neubiorev.2006.03.005. [DOI] [PubMed] [Google Scholar]