

Abstract
We analyse the characteristics of a force-ventilated isolation room, and the contributions to transport caused by the movement of people and doors opening/closing.
The spread of fine droplets and particles can be understood, to leading order, by considering the movement of passive contaminants. A scaled (1:10) model of an isolation room (with water instead of air) was used to analyse the dilution of a passive contaminant (food dye), released either instantaneously or at a constant rate. The high level of turbulence, typical of isolation rooms, ensures that the dye concentration is uniform within the model room and mixing is perfect, and the measured mean concentration can be predicted theoretically. In a second series of experiments, the exchange generated by a door opening/closing is measured for different opening angles. A dipolar vortex is generated at the tip of the door which moves into the centre of the room, with a large coherent structure moving along the wall. The exchange volume is comparable to the swept volume of the door.
Larger droplets and particles do not move passively. Their movement within a turbulent flow is studied by combining a Lagrangian model of particle movement with a kinematic simulation of a pseudo turbulent flow. The results show that while the mean fall velocity of particles is largely unchanged, turbulence significantly enhances horizontal and vertical dispersion. The horizontal spread as a function of the level of turbulence and droplet properties is estimated.
The conclusions from both studies are brought together and discussed in the context of the airborne spread of contaminants within a general hospital room.
Keywords: droplet evaporation, dispersion, hospital-acquired infection
1. Introduction
The British National Audit Office (2000) estimated that the National Health Service spends an additional £1 billion per year as a result of nosocomial infections through airborne and contact transmission routes. Tuberculosis, measles and chickenpox are generally considered as truely airborne infectious diseases, as the transmission and infection involves the respiratory tract. Other diseases may have some component of their transmission via the air, such as severe acute respiratory syndrome (SARS), flu (H1N1, bird flu), methicillin-resistant Staphylococcus aureus (MRSA) and Norwalk virus. Many diseases can enter the air from oral secretions aerosolized by breathing, coughing, sneezing, skin flakes naturally shed from the body, faeal matter or vomit splashing on surfaces. Transport over long distances can be mediated through the air, spread to surfaces and thence by contact transmission.
The size distribution and number of potential airborne sources of infection varies considerably depending on the mechanism of generation; indeed, the variability of reported conclusions depends on the measurement technique. To put the size of the fomites into perspective, it is worth recapping that the typical diameter of a virus, bacteria and fungal spore is 0.02–0.3, 0.3–10 and 2–5 µm, respectively (Cole & Cook 1998). Multiple pathogens are required to create a sufficient level of infection for the disease to be expressed. These pathogens are generally transported on larger aerosols such as skin flakes (typical size 13–17 µm in diameter), or droplets (ejected with peak diameters 20–40 µm, Cole & Cook 1998). Duguid (1945) reported that 95 per cent of droplets are smaller than 100 µm, while most are in the range 4–8 µm (see also Chao et al. 2009). With improved diagnostics, Papineni & Rosenthal (1997) were able to show that 80–90% of droplets were less than 1 µm in diameter. The number of fomites varies considerably depending on the generation mechanism. Coughing/sneezing generates 104/105 droplets, respectively (Cole & Cook 1998). Typically, 107 skin particles are shed each day (per person); each ml of vomit/faeces contains about 107/1012 virus particles, respectively (Barker et al. 2001).
The potential for fomites to remain in the air is determined by their terminal fall velocity, which varies with the square of their diameter (see figure 1 for non-evaporating droplets). Fine particles are susceptible to remaining aloft in air for long periods while larger particles will sediment to surfaces in regions of slowly moving air. Wells (1934) underlined the importance of evaporation in reducing droplet sizes to such an extent that their residence time in the air can be significant. Wells originally considered the evaporation of spherical droplets of initial diameter d0 in unsaturated air and concluded that large droplets (>120 µm) of a pure solvent strike the floor while smaller droplets evaporate to create droplet nuclei. In practice, mucus and saliva droplets contain a small volume fraction Rs ∼ 1.5% (Duguid 1966). When all the liquid has evaporated, the droplets have a diameter  . Thus even with a small fraction of mass, all droplets ultimately fall out of stagnant air.
Figure 1.

Droplet fall velocity as a function of droplet diameter.
In this paper, we focus on some of the physical processes that occur in a single-bed hospital isolation room and that determine the effect of turbulence on the spread of fomites in air. Small fomites (<20 µm) move passively through the air and their bulk removal is largely through dilution in the air. But larger fomites (>40 µm) move relative to the air flow. A series of new experiments and theory are developed to understand these processes. In §2, the key processes are identified and characteristic scales estimated. A laboratory study of transport and mixing of passive material in a model room is described in §3, where flushing and door exchange processes are studied. To analyse the influence of turbulence on the movement of fomites which are not passively advected, in §4 we introduce a model of turbulence and droplet movement. The general conclusions and relevance for infection control are described in §5.
2. Characteristics of the air flow within an isolation room
To set the scene within a typical hospital isolation room, we discuss some of the recommendations set down in the Department of Health Technical Memorandum (2007), which are similar to those issued by the Centre for Disease Control (CDC) (Sehulster et al. 2004). The specification is in terms of room air exchange volumes per hour (ACH), pressure difference and air flow directions, some of which are summarized briefly in table 1.
Table 1.
Summary of recommended ventilation strategies for different room types in a hospital (taken from Guidelines for Environmental Infection Control in Health-Care facilities (CDC 2004, appendix B). The symbols +, − and × for pressure correspond to positive pressure, negative pressure and no pressure difference, respectively.
| room type | ACH | pressure |
|---|---|---|
| operating/delivery room | 15 | + |
| airborne infection isolation room | 12 | − |
| toilet | 10 | − |
| patient room | 6 | × |
| patient corridor | 2 | × |
The pressure difference between rooms, corridors and toilets is specified with the sign set to minimize risk. The pressure difference is generated by a difference between the ventilation inlet and the outlet volume flux (of about 10%). The leakage area in a room is typically set at 0.03 m2 (Sehulster et al. 2004), usually with doors undercut by about 1–1.5 cm (for instance at University College London Hospital (UCLH)); undercutting also minimizes resuspension due to the door scraping the floor. The minimum pressure difference between rooms and corridors, rooms and toilets, is usually about 2.5 Pa (but 6 Pa is typical). Simple mechanical systems such as coloured ping-pong balls, flaps and in a few cases electronic monitors are used to indicate when pressure reversal occurs. The importance of ensuring that the pressure difference is correctly applied is underlined by the number of cases when reversal has been shown to lead to infectious disease spreading beyond isolation rooms (Tang et al. 2005).
Here, we try to estimate the various contributions to mixing and transport within an isolation room which has a volume V = HLW and dimensions L, H (approx. 3 m), W. Escombe et al. (2007) reviewed the volume of isolation rooms and found an average of V ∼ 31 m3. The main specification is in terms of the air room change per hour (ACH), ventilation strategies which are summarized in table 1. Consider the case when the inlet duct has a cross section AI, which leads to a Reynolds number of  , where
  is the volumetric flux of air into the room and
  . The effect of a diffuser is to reduce the vertical momentum flux of the inlet air flow and to enhance turbulence through the use of diffuser veins. Near to the duct, the turbulence is large in the sense that
  , though this decreases with distance from the duct. Wan et al. (2007) measured the (Eulerian) integral length scale of the air flow in a turbulent room and found it to be LE ∼ 0.08–0.12 m. The smallest length scale of the air flow is typically less than one or two orders of magnitude smaller than LE.
The flow is turbulent and characterized by a turbulent diffusivity νT which scales as  , where LD is the size of the diffuser veins and λv ∼ 0.3 (Tennekes & Lumley 1970; Klettner et al. 2009). Both the presence of a mean flow and turbulence assist in spreading passive material. An estimate of how long it takes for the material to spread in a room is
  . These estimates show that the turbulence disperses material over a typical isolation room in a period of about 8 min, comparable to the flush time
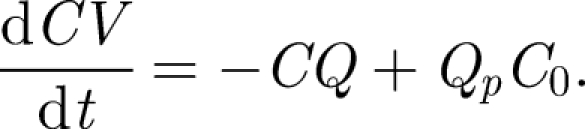
  for isolation rooms (with ACH = 12). The placement of the vent outlet may not be important—although usually situated at the ceiling level to remove hot air. The flow created by the exit vent decays slower with distance than the inlet vent. This explains why the forced ventilation in isolation rooms and theatres is so effective as airborne contaminants are rapidly diluted. Extraction then removes the contaminant with a concentration equal to the average in the room. When a contaminant is released with a concentration C0 at a steady volume flux Qp, the mean concentration in an isolation room changes according to
 |
2.1 |
The solution to equation (2.1) for an initial concentration C(0) = 0 is
 |
2.2 |
where T = Qt/V is time rendered dimensionless in terms of the time to displace a room of air. This solution is identical to the Wells–Riley equation (Noakes & Sleigh 2009). It shows that the concentration of a species in the air is inversely proportional to the ventilation flow rate. For a finite volume of contaminant injected at t = 0 in a room, the mean concentration decreases according to
 |
2.3 |
from the initial mean value C0. The success of predictions (2.2) and (2.3) depends on the flow being turbulent and the level sufficiently high that homogenization takes place on a time comparable to or shorter than the flushing time.
The level of contamination within an isolation room depends on how material enters, for instance, through the door way. We estimate the anthropogenic contribution from doors opening/closing and body wakes. Door opening events create a large coherent vortex which can propagate some distance within a room. For a door of height Hd ∼ 2 m, width Wd ∼ 1 m opening a door an angle Θm in time ΔTO, the angular speed is  . The Reynolds number associated with a door opening is typically
  . The swept volume is
  , which is typically about 3 m3. When the door to an isolation room (with Q ∼ 1 m3 s−1) which remains open for ΔTDO = 10 s, the volume of air drawn into the isolation room is 0.1QΔTDO ∼ 1 m3. Nevertheless, these estimates do not account for the transport of material from one room to another by vortical structures.
The second component, largely ignored, is the volume flux in the wake of a person moving with velocity UW, which is estimated by the Betz (1925) classic formula
 |
2.4 |
where A is the projected area of a person (approx. 0.8 m2). The drag coefficient corresponding to a moving body is similar to that of a flat plate, so that CD ∼ 1. For a person walking with velocity UW ∼ 1 m s−1, the wake volume flux is QW ∼ 0.4 m3 s−1, which is significant. When a person walks into an isolation room, with the door left open for time ΔTDO, the volume transported by the wake flow is QWΔTDO ∼ 4 m3. By mass conservation, an equal volume is displaced in the opposite direction. In combination, we see that both door opening/closing and people moving can lead to significant transport, with potential volume of exchange being 1–5 per cent of the room volume.
3. Mixing and transport within an isolation room
To test the estimates for the movement and dilution of a passive contaminant in an isolation room, we employed a physical scaled model using water instead of air. The transport and dilution of passive contaminants are analysed by following dye within the transparent acrylic models using optical methods. This method is used to evaluate natural ventilation within individual rooms and whole buildings (Linden 1999; Hunt & Kaye 2006). The focus of our study is to analyse how a contaminant, introduced instantaneously or continuously, is mixed and diluted. The second component is to analyse the transport between rooms caused by opening/closing a door; this extends the visualization results of Tang et al. (2006) by quantifying the exchange process.
3.1. Model design and experimental methodology
The architectural plans for UCLH were used together with a site visit to prepare a model of a single-bed isolation room. Thermal effects from heating and solar gain did not appear to be significant as the level of ventilation is high (ACH = 12). Natural ventilation is entirely eliminated as the windows are sealed. The basis for using this analogue here is the matching of the vent Reynolds number and scaled geometry; not all features were represented, such as beds. The high Reynolds number associated with the inlet flow ensures that viscous effects are negligible, supporting the dynamical similarity between the air flow in an isolation room and the water flow in the analogue.
An elevated view of the model hospital room is shown in figure 2a. The model has internal dimensions 0.95 × 0.56 × 0.32 m and was constructed from acrylic to enable the interior to be viewed from three directions. The model includes a toilet, annex room and corridor with doors though these were not used in this study. Multiple holes were cut to enable the venting positions to be changed. The volume flow rate through the inlet section was at Q = 8.5 cm3 s−1 and entered through a 7 cm × 7 cm hole which was covered with a fine metal gauze. The volume of the open space in the single-bed isolation room is V = 0.122 m3. The vent Reynolds number is about ReD ∼ 7000.
Figure 2.

(a) Elevated image of the model testing tank. (b) Three projected views for the testing tank, showing the plane, side and front view.
The model is illuminated with three light box diffusers constructed using fluorescent tubes and 4 mm thick white acrylic. Two mirrors are used to collect three projected views which are crowded onto a single image (see figure 2b). To quantify how a passive contaminant spreads within the model, we examined how dilute dye spreads with time. The concentration of dye was sufficiently low that buoyancy effects were negligible. By comparing images with and without dye captured using a machine vision camera (Dolphin, Firstsight Vision) at a rate of 3.75 fps, the fractional change in the intensity of the images is related to the integral of the dye concentration along a light ray; for dilute dye concentrations, the ratio of the pixel intensity with and without the attenuation caused by the dye (I, I0) is related to the integral of dye concentration over a projected distance d through  , where λC is a constant (e.g. Cenedese & Dalziel 1998). Capturing a series of images then provided information about the temporal and spatial patterns of how dye moves within the model room. Image processing algorithms written using Matlab 6.3 were applied to analyse image sequences. The plane, side and front projected views were isolated using digital masks. The reported results of mean concentration were obtained by summing C̅ over a projected view.
In the first series of experiments, a fixed volume of diluted dye (5 cm3) was injected from a syringe into the model room through an access port and the decrease in mean concentration was analysed. In the second series, the dye was injected at a constant rate through a side opening in a needle (external radius 1.1 cm) from a header tank; at the exit from the header tank, a flow meter was used to measure Qp. The header tank initially contained 90 000 cm3 of fluid and 120 cm3 of black dye. In both studies, the dye was injected between the inlet and the outlet vents. The third series of tests involved studying the effect of doors opening and closing on local exchange between rooms. This model is the same as Tang et al. (2006) where rooms had dimension 0.3 m × 0.3 m, water depth 0.22 m. The door width and height were Wd = 0.08 m and Hd = 0.15 m, respectively. The experiments consisted of opening a door over a fixed angular displacement (in a time of ΔTO = 2 s), keeping the door open for ΔTDO ∼ 30 s, before closing the door.
3.2. Results
Figure 3 shows a plane view of the main room after a fixed volume of dye has been injected. The greyscale gives an indication of the vertically integrated depth concentration with white indicating higher concentrations of dye. After T = 0.25, the dye has spread over most of the room except near the door. By T = 0.5, the concentration is uniform and appears to decrease uniformly in time. Figure 4 shows the plane view of the room as dye is injected at constant rate, in this example Qp = 1.67 cm3 s−1. The dye is not spatially uniform and has a higher concentration near the source and the outlet; analysis of the front projected images shows that the dye concentration is higher near the floor. Close to the inlet vent, the dye concentration is reduced. Figure 5a,b shows comparisons between the measurements and the analytical prediction. The agreement is good, especially for the instantaneous release.
Figure 3.

Sequence of images which show a plane view of how an injection of dye, midway between the inlet and the outlet varies with time for (a) T = 0.25, (b) 0.51, (c) 0.75, (d) 1.0 and (e) 1.25. The dye concentration is represented as an intensity of white.
Figure 4.

Sequence of images which show a plane view of how a constant flux of dye, injected at near to ground level spreads with time for (a) T = 0.5, (b) 1, (c) 1.5, (d) 1.99 and (e) 2.5. The dye concentration is represented as an intensity of white.
Figure 5.

Mean concentration C(t) within the isolation room as a function of dimensionless time Qt/V for (a) instantaneous release of dye and (b) constant flux of dye added at a rate of Qp = 0.33, 1.33 and 1.67 cm3 s−1. In (a) and (b), the analytical predictions are plotted as a dashed line and defined by equations (2.2) and (2.3), respectively.
Figure 6 shows a sequence of false colour images that show the exchange caused by a door opening and closing (with red on the right-hand side SR and blue on the left-hand side SL). Figure 6a(i) shows the generation of a positively signed vortex attached to the door as it opens. As the door stops, the opening vortex moves around the tip of the door generating negative vorticity, which combines with the door vortex and moves into the room SR at an angle similar to the final angle of the door. Opening the door leads to a return flow into SL, which leads to a separation around the door frame and a vortex with negative vorticity. After the door has opened, the cumulative positive vorticity generated by boundary layer separation is still weak and the vortex in SL does not propagate. As the vortex sits adjacent to the gap in the door, the usual induced velocity (caused by a mirror image) is weak. The exchange volume caused by closing the door is quite weak, which we also notice for full scale doors. A high speed jet is generated along the adjoining wall when the door closes as seen in figure 6f(i). The vortex in SL is now able to propagate, and breaks down. The side projected view shows that the initial exchange is largely over the height of the door.
Figure 6.

Time sequence of a door exchange flow. The false colour shows where fluid from the left and right partition is exchanged. (i) corresponds to the plane view while (ii) the side view. (a)–(d) correspond to when the door is opening, (e) corresponds to 5 s after door opening has ceased and (f) corresponds to the instant that the door is closed.
Figure 7 shows the fractional volume of fluid exchanged between the rooms as a function of time (between opening and finally closing the door). The volume was estimated from the mass of dye exchanged between the two sides. The volume appears to rapidly increase during door opening, increase at a slow rate until the volume exchange settles down and finally during the closing event, the increase in the exchange volume is small. The exchange volume is plotted in terms of the room model volume; a more detailed comparison indicates that the exchange volume is comparable to (but smaller) than the swept volume of the door. The results appear to show a weak dependence for Θm ∼ 40–60°.
Figure 7.

Fractional volume exchanged between two rooms for different door opening angles. The symbols ○, +, * correspond to the period of door opening, door fixed and door closing. The limit of the time axis indicates the start of door opening and when the door is finally closed.
4. Effect of turbulence on droplets spreading
The effect of turbulence leads to passive material spreading throughout an enclosed volume. Droplets and particles sediment relative to the local flow and therefore do not move passively. Many computational studies have analysed the motion of droplets and particles in forced and naturally ventilated rooms, largely based on fixed meshes (with 300 k to a few million nodes) and k–ε or large eddy simulation closures. Zhao et al. (2004) and Chao & Wan (2006) looked at droplet dispersion in an empty clean room. A more thorough study of a hospital room (with mixing type ventilation) by Chao et al. (2008) included the effects of hospital fittings (e.g. beds) and the thermal effects of patients and medical equipment. Gravitational effects dominated the motion of larger droplets which resulted in low lateral dispersion. However, smaller droplets (subjected to a low supply flow rate) were dispersed vertically due to thermal plumes. Other recent work includes particle tracking to study the effect of emission velocities (Mui et al. 2009) and patient–nurse interaction (Zhao et al. 2009) on droplet dispersion. An issue to highlight with k–ε models is that since the range of length scales in hospital flow fields varies from a few millimetres to about 0.2 m, most simulations tend to under-resolve the flow field and sometimes must include a forcing term to account for the diffusive motion of elements that are followed in time (e.g. Chao et al. 2008).
We extend previous studies to account for the influence of turbulence on the movement and dispersal of evaporating droplets in the air using a different modelling approach to account for the whole range of scales in the air flow. This requires a model of both the droplet movement and the turbulent flow. A more detailed description of this methodology is given by Klettner et al. (2009). In developing this model, we abstract from the practical problem and model the turbulence as homogeneous turbulence without the kinematic effect of the floor.
Droplets are assumed to be spherical (of diameter dp, density ρp) moving with velocity v in an air flow u. The droplet equation of motion (for dp < 200 µm) is determined by a balance of linear drag and buoyancy forces and is expressed as
 |
4.1 |
where  is the droplet centre at time t, g is the gravitational acceleration and
  is the droplet response time and
  is the dynamic viscosity (e.g. Eames & Gilbertson 2004). The evaporation time te for small droplets less than 150 µm is set by a constant diffusion coefficient De ∼ 6.1 × 10⁻⁹ m2 s−1 (for unsaturated air at 18°C), so that te = d02/De (Wells 1934). The droplet diameter varies as
 |
4.2 |
with time. The effect of a solid fraction (Rs) is introduced through setting dp = Rs1/3d0 for t/te ≥ 1 – Rs2/3. A synthetic model of homogeneous turbulence can be generated by summing unsteady random Fourier components (Fung et al. 1992):
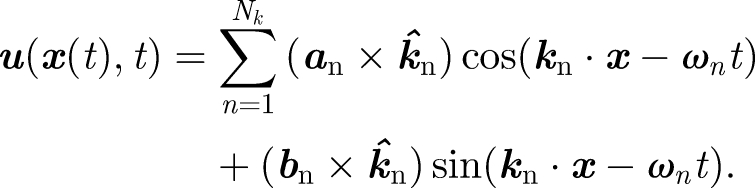 |
4.3 |
The velocity field is constructed to ensure that the flow is incompressible and the magnitudes of the Fourier components (i.e. an and bn) are chosen to satisfy a prescribed energy spectrum E(k). While the flow field does not include any dynamical component, it has been shown to be able to pick up processes such as Richardson dispersion and the Euler–Lagrangian frequency spectrum (Fung et al. 1992). As discussed in §2, the inertial energy spectrum spans about one to two decades within a hospital room with forced ventilation and this is included through a prescription of kη. The energy spectrum prescribed is the von Kármán spectrum
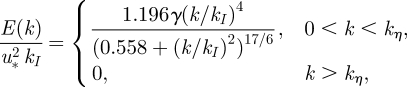 |
4.4 |
where 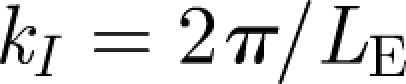 . u* is the r.m.s. velocity of the flow. To analyse how particles move within a turbulent flow, we release the particles at a height of h = 1.5 m and track their subsequent movement with time. The initial droplet diameter was varied from d0 = 20 to 100 µm. The turbulence of the velocity field, quantified by u*, was varied between 0.01 and 0.05 ms−1, and the integral length scale was kept constant at LE = 0.05 m, typical values of a hospital room (Wan et al. 2007). Two diagnostics were applied to analyse the results of how droplets moved and spread with time
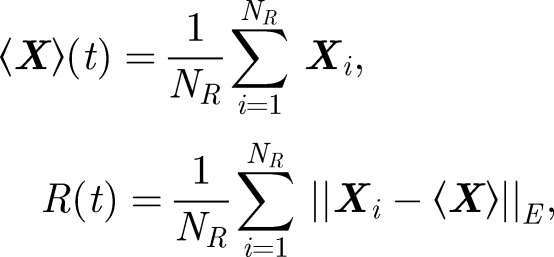 |
4.5 |
where ‖·‖E is the Eulerian norm. Equation (4.5) gives an indication of how particles move vertically with time (see figure 8). The mean droplet settling velocity (on average) changed by a small amount (less than 10 per cent—consistent with Maxey 1987). However, droplet dispersion is significant. From figure 8b, R/L ∼ 0.8(u*t/LE)1/2. Since the mean settling speed is Rs2/3 〈vT0〉, the droplet cloud spreads a distance
 |
4.6 |
Figure 8.

(a) Average height of a collection of droplets with initial d0 = 50 µm, as a function of time. Full thick line indicates droplet evaporating with turbulence, u* = 0.01 ms−1 and L = 0.05 m. Full thin line is a non-evaporating droplet in no turbulence (analytical solution derived from equation (4.1)). Dashed line is an evaporating droplet in no turbulence (numerical solution from (4.1) with u = 0). (b) Variation of R/LE with u*t/LE for d0 = 50 µm with LE = 0.05 m and u* = 0.01, 0.02, 0.05 ms−1.
Figure 9.

Variation of Rc with droplet diameter (dp), according to equation (4.6). h = 2 m assumed. Full thick and dashed line indicates u* = 0.01, 0.05 ms−1 respectively (LE = 0.05 m). Thin line indicates u* = 0.03 ms−1 and LE = 0.12 m and (estimated values from Wan et al. 2007).
These results show that turbulence may be as important as evaporation in keeping droplets in the air close to the cutoff diameter of 100 µm estimated by Wells (1934). For typical values of u* and LE found in the hospital environment, a droplet of d0 ≈ 30 µm will be spread a distance of 2 m (see figure 9), even without a mean flow. With the current bed spacing guidelines at 1.5–2 m (World Health Organization 2004) means that if forced ventilation is used in general wards, patients might suffer from cross-contamination. However, it should be noted that turbulence can also be useful, as in an isolation room the increased mixing (due to turbulence) can help decrease the mean contaminant concentration.
5. Conclusion
In this paper, we have analysed how material is spread within a force-ventilated single-bed isolation room. The major conclusions are as follows:
(i) Turbulence within a single-bed isolation room quickly leads to a homogeneous concentration of any passive contaminant, which is then removed via the outlet vent. This explains the success of perfect mixing models observed in the series of experiments (and elsewhere in the literature). In this environment, turbulence should be promoted.
(ii) The exchange caused by doors opening/closing and people moving is estimated. The contribution from the body wake is comparable to the door swing mechanism and can be up to 10 per cent of a room volume (for V ∼ 31 m3). The movement of exchanged air depends on whether the door opens into/out of the isolation room and has been previously identified as a risk.
(iii) Large droplets or particles sediment relative to the floor. Using a model which combines a Lagrangian analysis of droplet movement with a kinematic simulation of a pseudo turbulent flow, we show that while the mean fall velocity is largely unchanged, turbulence significantly enhances horizontal and vertical dispersion. The horizontal spread as a function of the level of turbulence and droplet properties is estimated.
These general conclusions show that the turbulence plays an important role in the ventilation strategy of a single-bed isolation room. For multiple occupants in a single room, serviced by either an individual or a collective forced ventilation system, turbulence not only dilutes airborne contaminants, but also transports them to other bays with the potential for cross-infection. This highlights the importance of understanding the influence of both ACH and turbulence in forced and naturally ventilated systems.
Acknowledgements
C.A.K. acknowledges support from EPSRC.
Footnotes
One contribution of 10 to a Theme Supplement ‘Airborne transmission of disease in hospitals’.
References
- Barker J., Stevens D., Bloomfield S. F. 2001. Spread and prevention of some common viral infections in community facilities and domestic homes. J. Appl. Microbiol. 91, 7–21. ( 10.1046/j.1365-2672.2001.01364.x) [DOI] [PMC free article] [PubMed] [Google Scholar]
- Betz A. 1925. A method for the direct determination of profile drag. Z. Flugtechn. Motorluftschiffahrt. 16, 42–44. [In German.] [Google Scholar]
- Cenedese C., Dalziel S. 1998. Concentration and depth fields determined by the light transmitted through a dyed solution. In 8th Int. Symp. on flow visualisation (eds Carlomagno and Grant). [Google Scholar]
- Chao C. Y. H., Wan M. P. 2006. A study of the dispersion of expiratory aerosols in unidirectional downward and ceiling-return type airflows using a multi-phase approach. Indoor Air. 16, 296–312. ( 10.1111/j.1600-0668.2006.00426.x) [DOI] [PubMed] [Google Scholar]
- Chao C. Y. H., Wan M. P., Sze To G. N. 2008. Transport and removal of expiratory droplets in hospital ward environment. Aero. Sci. Tech. 42, 377–394. [Google Scholar]
- Chao C. Y. H., et al. 2009. Characterization of expiratory air jets and droplet size distributions immediately at the mouth opening. J. Aero. Sci. 40, 122–133. ( 10.1016/j.jaerosci.2008.10.003) [DOI] [PMC free article] [PubMed] [Google Scholar]
- Cole E. C., Cook C. E. 1998. Characterisation of infectious aerosols in healthcare facilities: an aid to effective engineering controls and preventative strategies. Am. J. Infect. Control 26, 453–464. ( 10.1016/S0196-6553(98)70046-X) [DOI] [PMC free article] [PubMed] [Google Scholar]
- Department of Health Technical Memorandum. 2007. Heating & ventilation systems health technical memorandum 03-01. The Stationary Office: Norwich: ISBN: 978-0-11-322805-8. [Google Scholar]
- Duguid J. P. 1945. The numbers and the sites of origin of the droplets expelled during expiratory activities. Edinb. Med. J. 52, 385–401. [PMC free article] [PubMed] [Google Scholar]
- Duguid J. P. 1966. The size and duration of air-carriage of respiratory droplets and droplet nuclei. J. Hyg. 4, 471–480. [DOI] [PMC free article] [PubMed] [Google Scholar]
- Eames I., Gilbertson M. A. 2004. Bulk settling and dispersion by spherical vortices. J. Fluid Mech. 498, 182–203. ( 10.1017/S0022112003006888) [DOI] [Google Scholar]
- Escombe A. R., et al. 2007. Natural ventilation for the prevention of airborne contagion. PLoS Med. 4, 309–317. [DOI] [PMC free article] [PubMed] [Google Scholar]
- Fung J. C. H., Hunt J. C. R., Malik N. A., Perkins R. J. 1992. Kinematic simulation of homogeneous turbulence by unsteady random Fourier modes. J. Fluid Mech. 236, 281–318. ( 10.1017/S0022112092001423) [DOI] [Google Scholar]
- Hunt G. R., Kaye N. B. 2006. Pollutant flushing with natural displacement ventilation. Build. Environ. 41, 1190–1197. ( 10.1016/j.buildenv.2005.04.022) [DOI] [Google Scholar]
- Klettner C. A., Eames I., Tang J. W. 2009. The effect of turbulence on the spreading of infectious airborne droplets in hospitals. In ‘Synthetic models of turbulence’ (ed. Nicolleau F.). Berlin, Germany: Springer Verlag. [Google Scholar]
- Linden P. F. 1999. The fluid mechanics of natural ventilation. Ann. Rev. Fluid Mech. 31, 201–238. ( 10.1146/annurev.fluid.31.1.201) [DOI] [Google Scholar]
- Maxey M. R. 1987. The gravitational settling of aerosol particles in homogeneous turbulence and random flow fields. J. Fluid Mech. 174, 441–465. ( 10.1017/S0022112087000193) [DOI] [Google Scholar]
- Mui K. W., Wong L. T., Wu C. L., Lai A. C. K. 2009. Numerical modeling of exhaled droplet nuclei dispersion and mixing in indoor environments. J. Hazard. Mater. 167, 736–744. ( 10.1016/j.jhazmat.2009.01.041) [DOI] [PMC free article] [PubMed] [Google Scholar]
- Noakes C. J., Sleigh P. A. 2009. Mathematical models for assessing the role of airflow on the risk of airborne infection in hospital wards. J. R. Soc. Interface 6, S791–S800. ( 10.1098/rsif.2009.0305.focus) [DOI] [PMC free article] [PubMed] [Google Scholar]
- Papineni R. S., Rosenthal F. S. 1997. The size distribution of droplets in the exhaled breath of healthy human subjects. J. Bio-aerosol Med. 10, 105–116. ( 10.1089/jam.1997.10.105) [DOI] [PubMed] [Google Scholar]
- Sehulster L. M., et al. 2004. Guidelines for environmental infection control in health-care facilities. Recommendations from CDC and the Healthcare Infection Control Practices Advisory Committee (HICPAC). American Society for Healthcare Engineering/American Hospital Association. [PubMed] [Google Scholar]
- Tang J. W., Eames I., Li Y., Taha Y. A., Wilson P., Bellingan G., Ward K. N., Breuer J. 2005. Door-opening motion can potentially lead to a transient breakdown in negative-pressure isolation conditions: the importance of vorticity and buoyancy airflows. J. Hosp. Infect. 61, 283–296. ( 10.1016/j.jhin.2005.05.017) [DOI] [PMC free article] [PubMed] [Google Scholar]
- Tang J. W., Li Y., Eames I., Chan P. K., Ridgeway G. L. 2006. Factors involved in the aerosol transmission of infection and control of ventilation in healthcare premises. J. Hosp. Infect. 64, 100–114. ( 10.1016/j.jhin.2006.05.022) [DOI] [PMC free article] [PubMed] [Google Scholar]
- Tennekes H., Lumley J. L. 1970. A first course in turbulence. Boston, MA: M.I.T. Press. [Google Scholar]
- The British National Audit Office. 2000. The management and control of hospital acquired infection in acute NHS trusts in England. London, UK: Stationery Office. [Google Scholar]
- Wan M. P., Chao C. Y. H., Ng Y. D., Sze To G. N., Yu W. C. 2007. Dispersion of expiratory droplet in a general hospital ward with ceiling mixing type mechanical ventilation system. Aerosol Sci. Tech. 41, 244–258. ( 10.1080/02786820601146985) [DOI] [Google Scholar]
- Wells W. F. 1934. On airborne infection. Study II: droplets and droplet nuclei. Am. J. Hyg. 20, 611–618. [Google Scholar]
- World Health Organization. 2004. Practical guidelines for infection control in health care facilities. Accessed 10 July 2009. See http://www.wpro.who.int/NR/rdonlyres/006EF250-6B11-42B4-BA17-C98D413BE8B8/0/Final_guidelines_Dec2004.pdf [Google Scholar]
- Zhao B., Zhang Y., Li X., Yang X., Huang D. 2004. Comparison of indoor aerosol particle concentration and deposition in different ventilated rooms by numerical method. Build. Environ. 39, 1–8. ( 10.1016/j.buildenv.2003.08.002) [DOI] [Google Scholar]
- Zhao B., Yang C., Chen C., Feng C., Yang X., Sun L., Gong W., Yu L. 2009. How many airborne particles emitted from a nurse will reach the breathing zone/body surface of a patient in ISO Class-5 single-bed hospital protective environments?—A numerical analysis. Aerosol Sci. Tech. 43, 990–1005. ( 10.1080/02786820903107925) [DOI] [Google Scholar]